Wayne State University Dissertations
1-1-2017
An Analysis Of Gateway Programs On African
American Student Retention: A Case Study In An
Urban Higher Education Setting
Janice Cook Johnson Wayne State University,
Follow this and additional works at:https://digitalcommons.wayne.edu/oa_dissertations
Part of theEducational Administration and Supervision Commons
This Open Access Dissertation is brought to you for free and open access by DigitalCommons@WayneState. It has been accepted for inclusion in Wayne State University Dissertations by an authorized administrator of DigitalCommons@WayneState.
Recommended Citation
Cook Johnson, Janice, "An Analysis Of Gateway Programs On African American Student Retention: A Case Study In An Urban Higher Education Setting" (2017).Wayne State University Dissertations. 1691.
by
JANICE COOK JOHNSON DISSERTATION
Submitted to the Graduate School of Wayne State University,
Detroit, Michigan
in partial fulfillment of the requirements for the degree of
DOCTOR OF PHILOSOPHY
2017
MAJOR: EDUCATIONAL LEADERSHIP AND POLICY STUDIES Approved By: _________________________________________ Advisor Date _________________________________________ _________________________________________ _________________________________________
©COPYRIGHT BY JANICE COOK JOHNSON
2017
ii
DEDICATION
To Mom and Dad, we did it.
This study was dedicated in memory of my parents, Erma L. Tinsley Cook and Albert L. Cook, who believed in me more than I believed in myself.
To my daughter, Alysha L. Johnson, who was in the trenches with me through her daily phone calls giving me life and replenishing me when I was giving everything to this study.
To my son, Marcus A. Johnson, who walks in my footsteps kinder, gentler, and more powerful.
To Greg Johnson who matched my passion in his work and understood my complete submersion in this process.
To my cousins, Dr. LaShonda Reid and Dr. Terry Rowden, who earned their degree before me and showed me it was possible.
To the host of family and friends that encouraged and fed me and supported me along this journey, you illuminated my path. I love you all so much.
iii
ACKNOWLEDGEMENTS
To be successful in completing the dissertation process you need a powerful advocate. My advocate and dissertation chair was Dr. Carolyn Muriel Shields. You showed up as I emerged from my fog of loosing both of my parents. You were gentle yet firm. You set deadlines and moved the process forward. I am grateful.
To my friend and fellow PhD compadre, Leah Robinson, who wouldn’t let me stop: for the gentle reminders of impending due dates, the articles and resources available to us in our struggle.
To my dissertation committee, Dr. Michael Addonizio, Dr. R. Khari Brown and Dr. Monte Piliawsky for reading, providing feedback, and showing up for me.
To all the other family and friends, thanks for believing in me. Thanks for allowing me to cocoon, neglecting relationships. I’m back.
iv
TABLE OF CONTENTS
DEDICATION ... ii
ACKNOWLEDGEMENTS ... iii
LIST OF TABLES ... vii
LIST OF FIGURES ...x
CHAPTER 1. INTRODUCTION ...1
Background ... 2
Landmark Legislation ... 3
Statement of the Problem ... 4
Purpose of Research ... 7
Research Questions ... 9
Rationale for the Research ... 9
Overview of Literature ... 10
Overview of Methodology ... 11
Limitations ... 12
Delimitations ... 13
Assumptions of the Study ... 13
Definition of Terms... 14
Significance of the Problem ... 15
CHAPTER 2. LITERATURE REVIEW ...16
Historical Background for the Study ... 17
v
Theoretical Framework ... 19
Cyclical Theory ... 19
Critical Race Theory ... 19
White Privilege ... 21
White Privilege vs. Equity Agenda in the Federal Government ... 22
White Privilege vs. Equity in the Courts ... 35
Affirmative Action Executive Order Under Attack ... 36
Why Reform Education ... 38
Early Education Reform Success ... 39
Segregation Defeats School Reform Efforts ... 46
College Academic Achievement Gap Explanation ... 48
Generational Consequences of Uneducated Black Men ... 50
Institutional Leadership ... 52 CHAPTER 3. METHODOLOGY ...54 Research Design... 55 Data Collection ... 57 Data Analysis ... 59 Trustworthiness ... 62 CHAPTER 4. FINDINGS ...63 Research Question 1 ... 63 Research Question 2 ... 68 Research Question 3 ... 75
vi Research Question 4 ... 82 Research Question 5 ... 85 Research Question 6 ... 87 Research Question 7 ... 90 Research Question 8 ... 97 Research Question 9 ... 102 CHAPTER 5. SUMMARY ...117 Overview ... 117 Findings... 118 Research Questions ... 118 Discussion ... 123 Recommendations ... 126 Conclusion ... 129 REFERENCES ...132 APPENDIX ...140 ABSTRACT ...144 AUTOBIOGRAPHICAL STATEMENT ...146
vii
LIST OF TABLES
Table 1.1: College Characteristics for Select Michigan Universities. ...6
Table 1.2: Admission & Graduation Characteristics of Select Michigan Universities ...6
Table 1.3: 2013 Six Year Graduation Rates by Ethnicity, Gender and Pell Standing. ...7
Table 1.4: Six Year Graduation Rates for Select Michigan Universities 2008 – 2013 ...7
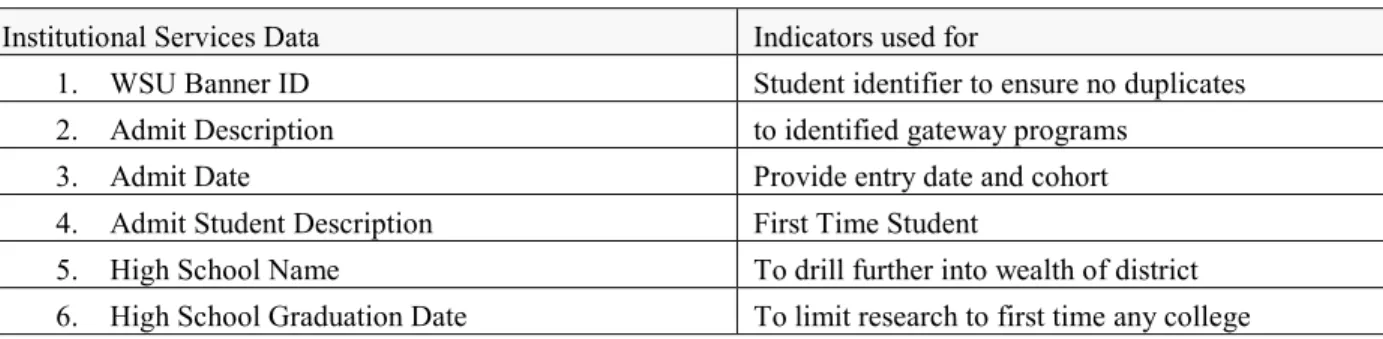
Table 3.1: Data Collection Instrument ...58
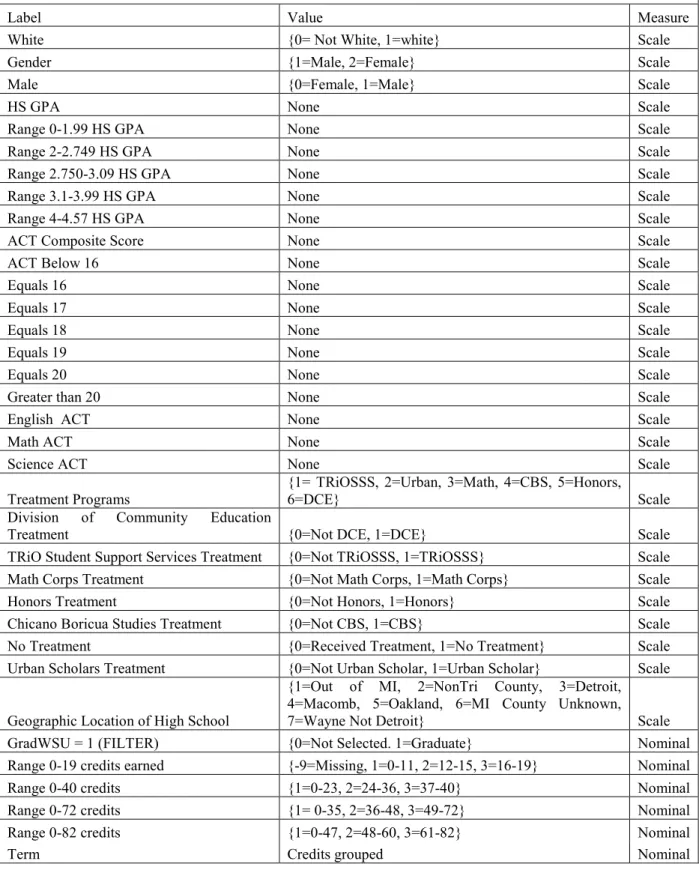
Table 3.2: Variable List ...60
Table 4.1: Descriptive Ethnicity of Students by Treatment Program ...64
Table 4.2: Descriptive Treatment Programs by Year and Ethnicity ...65
Table 4.3: Chi-Square – Treatment Program by WSU Graduates, Ethnicity ...67
Table 4.4: ANOVA –Credits by Treatment Programs ...69
Table 4.5: Cross Tabulation – Treatment Programs by Ethnicity ...71
Table 4.6: Descriptive – WSU Graduates by Control and Treatment Programs ...72
Table 4.7: Descriptive – WSU Graduates by Ethnicity and Treatment Program ...73
Table 4.8: Comparison of Enrollment University and Treatment ...74
Table 4.9: High School Location by WSU Graduates ...75
Table 4.10: ANOVA – WSU Graduates by HS Location ...77
Table 4.11: ANOVA – Sum of Squares WSU Graduates by HS Location ...77
Table 4.12: Tukey Multiple Comparisons Post Hoc Test Location by Ethnicity ...78
Table 4.13: Descriptive – WSU Graduates by Ethnicity ...78
Table 4.14: WSU Graduates by Ethnicity and Geographic Location ...79
viii
Table 4.16: WSU Non-Graduates by Ethnicity, Treatment, Geographic Location ...81
Table 4.17: Descriptive Statistics One-Way ANOVA Credits Earned Second Semester ...83
Table 4.18: ANOVA Table Credits Earned Second Semester ...84
Table 4.19: Cross tabulation – WSU Graduates by High School GPA and Gender ...86
Table 4.20: Comparison of Graduates and Non-Graduates by High School GPA ...87
Table 4.21: Descriptive – Effects of High School GPA on Treatments ...88
Table 4.22: ANOVA – Sum of Squares Treatment by High School GPA ...88
Table 4.23: ANOVA – Treatment by High School GPA Ranges ...89
Table 4.24: Cross tabulation – ACT Composite by Credits Earned Fourth Semester ...93
Table 4.25: Cross tabulation – ACT English by Credits Earned Fourth Semester ...94
Table 4.26: Cross tabulation – ACT Math by Credits Earned Fourth Semester ...95
Table 4.27: Cross tabulation – ACT Science by Credits Earned Fourth Semester ...96
Table 4.28: Pearson’s Correlation – HS GPA by Credits Earned 4th Term and Ethnicity ...97
Table 4.29: Descriptive – Mean High School GPA ...98
Table 4.30: Compare Mean – High School GPA by Ethnicity of Non-WSU Graduates ...99
Table 4.31: Correlations – Effect of HS GPA and Ethnicity on WSU Graduation ...100
Table 4.32: Academic Preparation of WSU Graduates and Non-Graduates ...102
Table 4.33: Descriptive – ANOVA ACT Composite Score by Ethnicity ...103
Table 4.34: Academic Preparation of WSU Graduates and ...105
Table 4.35: Descriptive – ANOVA Mean High School GPA by Ethnicity ...106
Table 4.36: Homogeneous Subsets ACT Composite Score by Ethnicity ...106
ix
Table 4.38: ANOVA – ACT Composite Scores ...107
Table 4.39: ANOVA – High School GPA ...108
Table 4.40: ANOVA – WSU Graduates by High School GPA ...109
Table 4.41: ANOVA – Non-WSU Graduates by High School GPA ...111
Table 4.42: WSU Graduates by Ethnicity, ACT Composite and High School GPA...112
x
LIST OF FIGURES
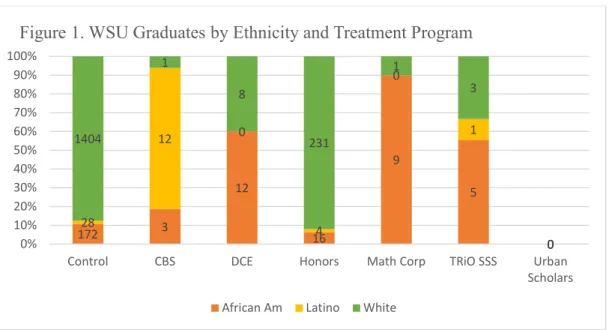
Figure 1. Stacked Bar Chart – WSU Graduates by Ethnicity and Treatment Programs ...73
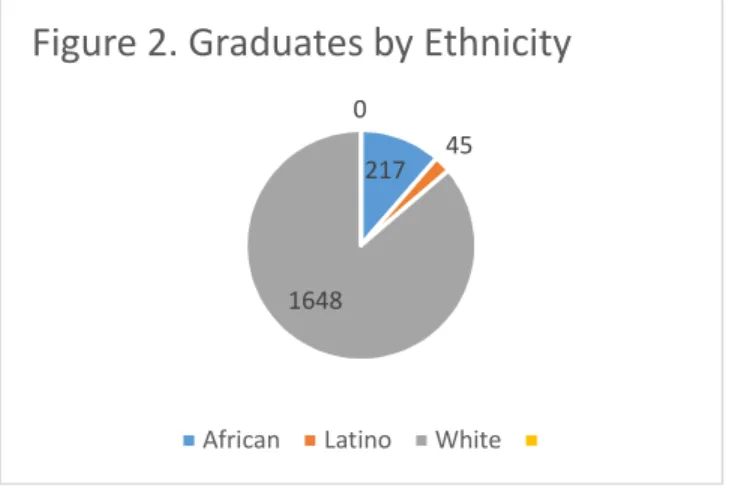
Figure 2. Pie Chart – Graduates by Ethnicity ...74
Figure 3. Stacked Bar Chart ACT Comp Score by Ethnicity, Less than 47 Credits Earned....92
Figure 4. Stacked Bar Chart ACT English Score by Ethnicity, Less than 47 Credits Earned .93
Figure 5. Stacked Bar Chart ACT Math Score by Ethnicity. Less than 47 Credits Earned ...95
Figure 6. Stacked Bar Chart ACT Science Score by Ethnicity. Less than 47 Credits Earned .96
CHAPTER 1. INTRODUCTION
In the American educational system, there has been a persistent disparity in academic achievement between African Americans and Whites in every region of the United States and at every level of education (Mincy, 2006). This disparity, as measured by enrollment trends and graduation rates, placed ethnic minorities at the bottom (Lawrence III, 2006). Researchers have identified economic, social, and governmental policies as the culprit of the factors that continued to thwart African American progress (Blackmon, 2008; deMarrais & LeCompte, 1999; Harper, Patton, & Wooden 2009; Kozol, 2005; Litwack, 1998; Marger, 2009; Mincy, 2006; Minor, 2008; Payne, 2005; Peterson, 2006). In particular, some believed that the role of the United States judicial system in protecting an ethnic social order was at the core of the second-class status many African Americans occupied (Blackmon, 2008).
Discriminatory economic, social, and governmental policies reinforced and perpetuated other areas of inequality in African American life beyond academic achievement. The Black Codes and Jim Crow Laws of the nineteenth and twentieth century embodied the tenets of social discrimination. The practice of geographic discrimination in bank lending and insurance availability in combination with restrictive racial covenants in many housing markets and discriminatory hiring practices set in motion the current conditions and maladies that afflict African American life (Burrell, 2010). The inability of large numbers of African Americans to secure stable (even subsistence) employment, live in secure housing, and regularly attend high performing fully funded public schools were remnants of those practices.
In a diverse stratified society where ethnicity affected how individuals perceived the character of others, the majority politic engaged in deliberative and sometimes unconscious exploitation of minorities (Dovidio, Glick & Budman, 2005). Hegemonic theorists suggested that
the exploitation of minorities was just and socially beneficial, that the inequalities of power and wealth distribution were acceptable, and gave the majority motive to oppress (Marger, 2009). Cultural capital, like any other form of capital, was subject to deflationary pressures (McVeigh, 2009). Therefore, limiting the number of individuals with a degree inflated the value of the degree in the market place. Blaming external factors, including educational reforms, as the culprit for this academic disparity rather than striving to dismantle White privilege had been tolerated. However, social class differential was possibly the most powerful determiner of inequality in society, and its roots were embedded throughout American legislation and litigation (Harper, Patton & Wooten, 2009).
Background
The educational achievement gap was a by-product of a racialized society. African Americans did not become over-represented in the lower class in America because of inferior genetic makeup – it was because the law allowed for ethnicity defined enslavement, segregation and removal from equal opportunity (Rothstein, 2004).
Gains made by the minority in the economic, social and political spheres in the United States were not chance occurrences. They were through deliberate confrontation and clashes with the power structure. When the majority had the ability to implement legislation to preserve and secure their favorable class structure, the cultural minority attempted to temper that legislation through litigation and resistance. When the U.S. Supreme Court affirmed the rights of White
men, excluding African Americans from citizenship in the Dred Scott v. Sandford, 1857
decision, the anti-slavery movement in the United States galvanized to sway public opinion. It sought out, published and widely distributed persuasive slave narratives. It supported safe houses
on the Underground Railroad and refused to recognize the Fugitive Slave Acts, culminating in the election of Abraham Lincoln in 1860, the American Civil War (1861-1865), the Emancipation Proclamation (1863) and the Reconstruction Period (1863–1877). During Reconstruction, the U.S. Constitution was amended ratifying the fourteenth and fifteenth Amendments gaining African Americans citizenship and the right to vote.
Landmark Legislation
Some of the landmark legislation, since the American Civil War, questioned how to further dismantle or restore the American class system instituted with ethnicity defined slavery.
The U.S. Supreme Court decision, Plessy v. Ferguson,1896, formalized second-class citizenship
for African Americans by legitimizing Jim Crow segregationist practices. Brown v. Board of Education, 1954 combined with the Civil Rights Act and Affirmative Action Executive Order 11246 of 1965, set in motion practices and laws to dismantle the American class system making segregation unconstitutional. Those decisions as well as other court cases punctuated how ethnicity in America shaped the trajectory of African American achievement in their educational, social, political and economic life.
Swann v. Charlotte-Mecklenburg Board of Education, 1971 mandated the busing of African American schoolchildren as a tool for integration. Milliken v. Bradley, 1974 effectively blocked integration efforts by exempting Detroit suburbs from participating in busing, essentially condoning White flight and segregation. Those court cases established the parameters of inclusivity or exclusivity of African Americans in education (Anderson, 1988; Bennett, 1988; Harper, Patton, & Wooden; Lawrence III, 2006; Litwack, 1998).
During the 1970’s, more minorities attended and graduated from college, held white-collar positions and were making gains in achievement at every educational level. The Supreme
Court case, Regents of the University of California v. Bakke, 1978, ushered in the conservative
tide that successfully challenged and weakened affirmative action. Prior to desegregation of higher education, 90 percent of all African American students were enrolled at a Historically Black College or University (Harper, Patton, & Wooden, 2009). However, by 2001, there was a reversal in attendance patterns, with 87 percent of all African Americans in higher education enrolled at predominately White institutions (NCES, 2004).
Statement of the Problem
With more African Americans having attended predominately White institutions and social mobility tied to the attainment of degrees, the lag of African Americans in attaining such degrees was problematic in that it perpetuated their continued occupation at the bottom of the American class structure. Horace Mann, a nineteenth century American educator, believed that above all other human devices, education was, “the balance wheel of the social machinery” (Lynch & Engle, 2010). If earning a degree positively influenced every quality of life indicator, then not earning one negatively affected that life. The manifestations of the lower educational achievement was adverse health and incarceration statistics as well as losses of tax revenue and an increased dependence on public assistance (Belfield & Levin, 2007).
Less than a high school diploma was synonymous to a life of poverty. However, a high school diploma had limited financial mobility options. Research showed six pathways traditionally taken by low-income American high school graduates:
2. enlist in the armed forces, 3. join the unskilled workforce,
4. become chronically unemployed,
5. incarceration,
6. or die prematurely (Lee & Ransom, 2010).
The data confirmed that attaining a high school diploma, and thus a college degree, was a gateway to greater social upward mobility and increased an individual’s economic opportunities by greatly influencing the type of employment, life income earnings, housing opportunities, positive health and incarceration indices, and many other quality of life measures (Belfield & Levin, 2007, Tinto, 2004). Education had been and continued to be an instrument of great importance because it controlled who gained access to upward mobility and social status in the United States and represented a bulwark against intergenerational downward mobility (McVeigh, 2009). The leadership within the Ku Klux Klan, a paramilitary hate group, frequently identified education as the most important way to affect social change, exploiting the fears and anxieties of individuals that they wanted to recruit, while subduing the ambitions of those they considered a threat to the White male dominance (McVeigh, 2009).
American Sociologist, W. I. Thomas surmised that if people defined a situation as real, such as the importance of a college education to upward mobility, then the situation was real in its consequences (Marger, 2009). Moreover, data confirmed the differential achievement and completion rates among major universities was a factor limiting upward mobility opportunities.
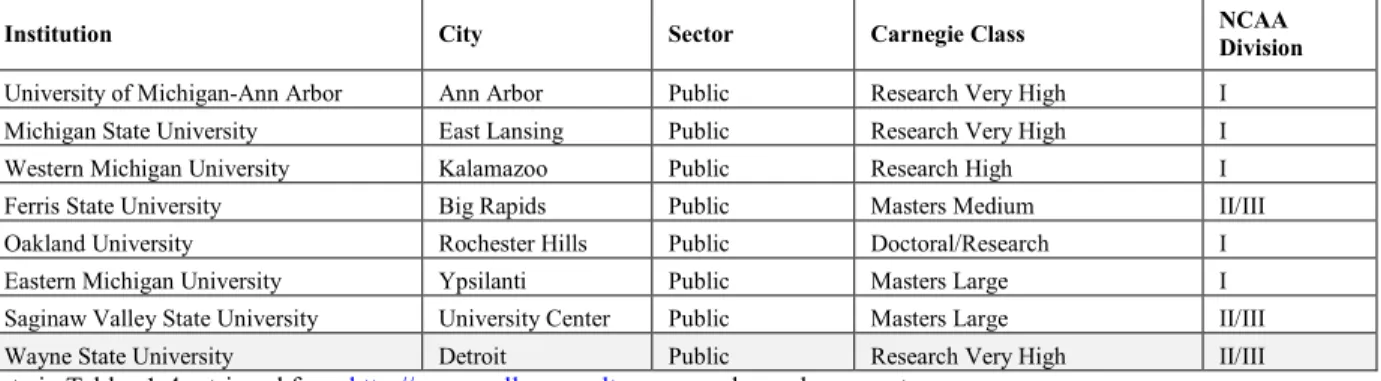
Comparative data from eight Michigan public universities dispersed throughout the Lower Peninsula showed the variances in graduation rates between African American and White
students. Table 1.1 showed the location of the university within the state, its membership as a public sector institution, its research designation as a Carnegie institution, and its athletic affiliation. The characteristics of the eight universities placed in context where Wayne State University (WSU) ranked as a leader in providing education in the state.
Table 1.1. College Characteristics for Select Michigan Universities
Institution City Sector Carnegie Class NCAA Division
University of Michigan-Ann Arbor Ann Arbor Public Research Very High I
Michigan State University East Lansing Public Research Very High I
Western Michigan University Kalamazoo Public Research High I
Ferris State University Big Rapids Public Masters Medium II/III
Oakland University Rochester Hills Public Doctoral/Research I
Eastern Michigan University Ypsilanti Public Masters Large I
Saginaw Valley State University University Center Public Masters Large II/III
Wayne State University Detroit Public Research Very High II/III
Data in Tables 1-4 retrieved from http://www.collegeresults.org saved search parameters
Table 1.2 provided a comparative look at the 2009 and 2013 six-year graduation rates looking at the 2009 selectivity of admittance of applicants and the 2009 median ACT Composite score of incoming freshman.
Table 1.2. Admission & Graduation Characteristics of Select Michigan Universities
Institution % Admitted Open
Admissions Median ACT Composite 2009 6-Year Grad Rate 2013 6-Year Grad Rate
University of Michigan-Ann Arbor 42.20% No 29 89.40% 90.00%
Michigan State University 70.00% No 25 77.10% 77.60%
Western Michigan University 84.90% No 22.5 54.10% 54.90%
Ferris State University 55.40% No 21 45.90% 48.90%
Oakland University 78.30% No 22 40.70% 42.90%
Eastern Michigan University 74.90% No 21 39.70% 38.40%
Saginaw Valley State University 87.90% No 21 38.10% 38.70%
Wayne State University 78.90% No 20 31.70% 32.30%
Table 1.3 provided the 2013 six-year graduation rate by ethnicity and gender for freshmen receiving federal financial support through the Pell Grant. In this research, Pell Grant recipient status was the proxy for low-income status. Of the eight colleges compared, WSU had
the largest number of Pell Grant recipients, an indicator of the level of poverty of the student
body.WSU also had the lowest graduation rate for poor minoritized students.
Table 1.3. 2013 Six-Year Graduation Rates by Ethnicity, Gender AND Pell Standing
Institution %Pell Freshmen 2013 6-Year Black Female Black Male White Female White Male
University of Michigan-Ann Arbor 15.70% 90.00% 83.20% 69.10% 92.80% 89.70%
Oakland University 20.30% 42.90% 19.10% 23.50% 49.40% 41.80%
Michigan State University 23.90% 77.60% 57.70% 54.50% 82.40% 80.40%
Western Michigan University 39.70% 54.90% 46.40% 41.50% 59.30% 53.40%
Saginaw Valley State University 40.80% 38.70% 9.20% 13.20% 45.40% 38.70%
Ferris State University 41.20% 48.90% 43.80% 28.60% 50.40% 46.10%
Eastern Michigan University 44.70% 38.40% 26.40% 18.70% 49.60% 40.60%
Wayne State University 48.00% 32.30% 12.20% 8.70% 47.00% 43.20%
Table 1.4 provided the 2008 to 2013 graduation rates of eight Michigan universities. Wayne State University ranked eighth in each year.
Table 1.4. Six-Year Graduation Rates for Select Michigan Universities 2008 - 2013
Purpose of Research
The purpose of this study was to identify possible barriers as well as possible ways to support student retention through graduation of African Americans at Wayne State University. Within the historical and political framework outlined, the academic achievement gap at Wayne State University was viewed in the context of social and political subordination. Students
Institution 2008 2009 2010 2011 2012 2013
University of Michigan-Ann Arbor 88.00% 89.40% 89.70% 89.50% 90.70% 90.00%
Michigan State University 75.40% 77.10% 72.20% 77.30% 79.40% 77.60%
Western Michigan University 55.10% 54.10% 52.20% 55.90% 55.60% 54.90%
Ferris State University 43.40% 45.90% 47.80% 40.00% 39.30% 48.90%
Oakland University 43.70% 40.70% 39..70% 40.30% 43.40% 42.90%
Eastern Michigan University 35.70% 39.70% 37.70% 39.50% 37.20% 38.40%
Saginaw Valley State University 37.50% 38.10% 42.70% 38.50% 38.40% 38.70%
matriculating to Wayne State University from impoverished and/or minoritized neighborhoods often failed to graduate (Carnoy, 2005).
Rumburger, 2005 noted that where a student attended school made a difference in how much they learned and their chances of graduating; that the socioeconomic status of the children attending the school had a small yet significant affect on their learning and dropout rates. With communities more segregated by socioeconomic factors, it was deduced that those attending schools in the lower socioeconomic communities were not getting the same educational value as those attending schools in predominately affluent communities, which in turn impacted their ability to graduate prepared for the academic rigors of university study. The index of Dissimilarity, which measured segregation by residence, concluded that students from the metro Detroit area were very racially segregated with minoritized communities less able to access networks and resources in other communities (Farley, Danziger and Holzer, 2002). This research sought to understand why the dropout rate was disproportionately skewed toward African Americans in the lower ranks of academic achievement. Discussions of an educational system in crisis had been described as an exercise in the social construction of a social problem rather than an accurate assessment of the worsening conditions of the schools (McVeigh, 2009). Thus, the null hypothesis for this research was that ethnicity was not a factor in matriculation at Wayne State University.
Research Questions
The specific questions unique to this research were:
1. What pathways did African Americans use to enroll at the university as compared to Latino and White students? Specifically, were they associated with a gateway program or did they enroll independently or non-attached?
2. Did participation in a university gateway program increase retention as measured by credits earned after two years?
3. Did county median household income, predict WSU graduation?
4. Did the enrollment trends of African American students differ from White and Latino students after one year as measured by credits earned?
5. Was there a correlation between high school cumulative GPA and WSU graduation?
6. Did treatment participants vary statistically in their academic preparation prior to college enrollment as measured by their incoming high school cumulative GPA?
7. Did ACT subject scores predict college persistence after two years the same across ethnicity?
8. Did students persist differently by ethnicity at the same high school cumulative GPA?
9. For WSU graduates, was there a statistical difference by ethnicity and gender in their high school preparation as measured by ACT Composite and high school GPA?
Rationale for the Research
There was a plethora of data chronicling the deleterious effects of an uneducated community. This study identified factors to support African American achievement with their White counterparts and addressed what could be done to support all students through graduation.
This was the gap in existing literature. Research exists regarding the academic achievement gap; however, this research was specific to one institution. This research explored how African Americans progressed within the university and determined that their lower graduation rate and lack of academic parity with other ethnic groups was not a derivative of their prior academic preparation as measured by high school cumulative GPA and ACT Composite score. That indeed, institutional barriers and culture were suspect.
Overview of Literature
The impetus for this research was a pair of articles written thirteen years apart describing the plight of African American students at WSU. The first, Four Decades of Progress and Decline: An Assessment of African American Educational Attainment, published in the Journal of Negro Education, in 1997, lauded WSU as one of the largest grantors of degrees to African
Americans outside of HBCU’s (Garibaldi, 1997). The second, Wayne State's Black-White
Graduation Gap Reflects Detroit's Struggles, published in the Chronicle of Higher Education, in 2010, cited WSU as the worst public institution for African Americans to attain a baccalaureate degree compared to their White counterparts (Kiley, 2010). The juxtaposition of those two articles highlighted that something had gone terribly wrong in academia for African American students at WSU.
The Education Trust, a Washington DC based advocacy and research group, noted that WSU enrolled more African American students in the fall of 2007 than the other 49 public and private universities referenced in the Chronicle article (Lynch & Engle, 2010). With the ability of WSU to attract a viable African American applicant pool, then to admit and enroll them, it would be expected that the University would graduate them at the same or higher rate as schools with
lesser African American student enrollment. Data from the Education Trust website, www.collegeresults.org, showed that in 2013 Wayne State University’s undergraduate African American student enrollment was 21.3 percent with a four year graduation rate of 11.2 percent.
The ethnic delineation in the graduation gap appeared to be more than a chance occurrence. The gap reflected the social class differential between African Americans and Whites residing in the counties served by Wayne State University. Wayne County, the largest feeder community to WSU encompassed Detroit, one of America’s poorest and racially segregated communities. Other themes that added to that disparity were the lack of transportation, secure housing and subsistence employment.
This research was valuable since college completion had become a determinate of employability due to employers reinforcing this connection by placing a premium on higher educational attainment (Heller, 2001). The significance of the college completer achievement gap was that it disproportionately affected African Americans, making them more likely to occupy the fringes of society. Therefore, when employers placed a premium on education, higher education became a necessity (Belfield, Nores, Barnett & Schweinhart, 2006)
Overview of Methodology
This quantitative study was multifaceted. The data source was Wayne State University Banner software. Analyses were conducted on First-Time In Any College students, (FTIAC), enrolled from the years 2002 through 2009. Each year was treated as a cohort. The data were further analyzed by ethnicity and gender. The results of the analysis contributed to existing scholarship of African American student retention at an urban higher education setting, specifically Wayne State University (WSU). The research focused on the prior academic
preparation of African American and White students at the time of first college enrollment with differences in preparation determined by variables high school cumulative GPA, ACT Composite, ACT English, ACT Mathematics, and ACT Science scores. Latino students were included in the analysis as a comparative index to determine if the second largest involuntary minority ethnic group on campus achieved differently than African Americans.
This retrospective analysis compared enrollment trends, stop-out patterns, and retention and graduation rates by all WSU students, WSU graduates and WSU non-graduates. The results were then reported by ethnicity and gender. The goal of this research was to identify how ethnic groups differed in their preparation for college. Then, the research identified institutional barriers by eliminating variable differences in ACT scores, county of origin, and high school cumulative GPA to find the area that affected African Americans disproportionately from the other ethnicities.
Limitations
There were several limitations to this research outside of the control of the researcher:
1. The WSU TRiO Student Support Services’ program received federal funds to serve 100
freshmen level students each year. Recruitment was coordinated through the Admissions office from January through June or until the program reached capacity. Students without access to email or who did not list an email address on their initial WSU application may not have been informed of the various conditional admit programs. This process may have served as a filter function eliminating the very poor without access to the internet. 2. Conditional admit programs, such as TRiO, could only serve a minimal number of the
WSU with lower high school GPA’s and/or ACT Composite scores and high financial need. The research answered the question of whether or not those factors impeded degree completion.
3. Results from this statistical analysis of administrative data were subject to possible bias from omitted but relevant variables.
Delimitations
This quantitative study reviewed historical enrollment data to discern admission practices, student progression and graduation trends of African American students in comparison to White students at one institution. This research brought awareness to conditions at Wayne State University that could inform future decisions. However, the research may not lend itself to explaining the existence of the ethnic academic achievement gap at other colleges and universities. Secondly, the historical data did not reflect current or ongoing efforts by the university to enhance student achievement toward graduation. This research was a snapshot of the university relying on longitudinal data collected over a limited period at a time when the city of Detroit was experiencing record economic distress. Third, the years that this study covered were chosen because they bracket the time period that the researcher was employed at the institution and had a working knowledge of the students and institution being analyzed. Finally, a quantitative study did not lend itself to interpreting the nuisances of the human experience or intangible factors.
Assumptions of the Study
1. Non-White Ethnicity was a factor in academic achievement at WSU
3. Minority ethnicity combined with gender was a factor in academic achievement at WSU
4. That factors identified as impeding African American college completion could be
remedied with the right type of research based interventions.
Definition of Terms
Terms used in this dissertation that may be unfamiliar to readers were defined in the following ways:
Admit Regular Traditional or regular admit standards were a cumulative high
school GPA of 2.75 or higher or an ACT Composite score of 21 or higher.
At-Risk Those factors, (poverty, homelessness, reared in a single or
no-parent household), that impede a child’s ability to reach their full academic potential.
Gateway Programs WSU has several gateway or conditional admit programs that
accept students from underrepresented groups who may or may not have met traditional admissions standards of a 2.75 cumulative high school GPA or higher or an ACT Composite score of 21 or higher. Appendix A list those programs evaluated in this research.
Low-Income status U.S. Department of Education defines low-income status as
130 percent of poverty level. Usually people who fall within this range receive state and federal assistance to meet basic subsistence levels for food, housing and clothing.
NCLB The No Child Left Behind Act of 2001 was education reform
proposed by President Bush in his first week in office and passed into law January 8, 2002 by Congress. The 2001 NCLB Act was based on four principles: accountability for results, more choices for parents, greater local control and flexibility, and an emphasis on doing what works in schools based on scientific research.
Racial Profiling A practice by law enforcement personnel of using an
individual’s race or ethnicity as a key factor in deciding whether to stop or arrest them.
Redlining The unethical practice of financial institutions perpetuated against African Americans and the poor to deny mortgages, insurance or access to other financial services based on geography without taking into consideration the qualifications of the individual or their creditworthiness.
Sundown Towns A geographic area, neighborhood, town, city or county, where
the residents were intentionally overwhelmingly all White and non-Jewish. The term came from posted signs that advised people of color to leave town by sun down.
Tri-County Area The Detroit metropolitan area, often referred to as
Metro Detroit, also informally as the Detroit Tri-County Area encompassing Macomb, Oakland and Wayne counties
Significance of the Problem
Administrators at WSU have sought answers to the cause of the student retention gap by gender and ethnicity. The Chronicle of Higher Education article, Wayne State's Black-White Graduation Gap Reflects Detroit's Struggles, appearing in the October 17, 2010 issue, placed a national spotlight on the institution. In response, screening, admittance and retention of students received critical attention in order to change the trajectory and experiences of African Americans through graduation. By understanding issues of access and student progression, this research informed efforts to improve the overall retention and graduation rates of all students at WSU. The significance of this research, supported by evaluative processes, helped to identify institutional barriers that could inform future policy initiatives in closing this gap.
CHAPTER 2. LITERATURE REVIEW
Title searches on the academic achievement gap using Google Scholar through WSU library identified articles, books and journals on the degree attainment differential between African American and White students. In addition, other authors frequently cited in the readings were included to develop this scholarship. The literature supported the premise that the disparity in academic achievement, distinguishable along ethnic, gender and class characteristics, was a product of a stratified society (Harper, Patton, Wooten, 2009; Rothstein, 2009). However, it was the contention of this research that in addition to a stratified society, a greater phenomenon operated within American culture. Like gravity, racism and racial discrimination in this country were ever present exerting pressure on people of color. They were forces that limited the academic mobility of ethnic minorities. Thompson Christman, 2013 identified systematic and institutionalized racism as a byproduct of a hierarchical ordering defined as Whiteness and White privilege. It was those concepts that were explored.
The first part of the chapter laid the groundwork with a brief history of race relations specific to Detroit. Next, this chapter focused on the scholarship addressing the educational achievement gap in the United States through the lens of educational public policy in the maintenance or temperance of White privilege.
As discussed in detail in Chapter 1, economic oppression, social exclusion and discriminatory governmental policies produced and perpetuated the marginalized status of African Americans in education and their diminished participation in greater economic opportunities (Blackmon, 2008; deMarrais & LeCompte, 1999; Harper, Patton, & Wooden 2009; Kozol, 2005; Litwack, 1998; Marger, 2009; Mincy, 2006; Minor, 2008; Payne, 2005; Peterson,
2006). So, too, was the case with African American students at WSU who continued to be affected by segregationist residue in contemporary America (Minor, 2008).
Historical Background for the Study
Detroit has had a long history of racial unrest. Segregationist practices systematically excluded African Americans from most housing in the region and routinely disenfranchised African Americans from entering the skilled labor market in the automobile industry. Ethnic communities were developed with many of the surrounding communities considered “sundown towns,” places where ethnic minorities were not welcomed (Loewen, 2005). This practice, coupled with an influx of African Americans moving to the city from southern states lured by hopes of employment in the automobile industry, exacerbated racial tensions. Financial means did not protect affluent African Americans from discrimination. In 1925, Dr. Ossain Sweet and his family defended their home against a mob trying to force them from their neighborhood in Detroit on Garland Avenue (Marable, 2011). In 1942, tensions rose when African Americans began moving into the Sojourner Truth housing projects. The citywide race riots of 1943 and 1967 ended only after federal troops restored peace. The 1973 election of Coleman Young, Detroit’s first African American mayor, was a racial event with 90 percent of African Americans and ten percent of Whites supporting him. The 1992 fatal beating of an African American motorist, Malice Green, who was pulled over for a traffic stop by two White police officers, highlighted the police practice of racial profiling (Poremba, 2001).
This glimpse of Detroit’s racial history provided the context for the social environment in which WSU faculty, staff and administrators lived and worked. Those employees, the majority of which were White, served African American students who were also a minority on campus. With
students educated similarly, comingling within the integrated classrooms and limited residential units, why then were there variances in graduation rates? The blatant and subtle forms of discrimination must be suspect in the continued subpar advances African American students were making toward graduation at WSU.
Credentialing Movement
The National Commission on Excellence in Education, 1983, A Nation at Risk report added to the credentialing movement by defining the education problem as the failure of the public school system. The report identified the lack of a higher skilled labor force to compete globally as an indictment of the nation’s public schools (Curtler, 2006). The report also paved the way for student assessment using standardized tests as legislated in the No Child Left Behind Act 2001 (NCLB). The NCLB legislation was to bring equity to learners from all backgrounds including the socioeconomically disadvantaged and non-native English language speakers. However, the most vulnerable students were removed for various reasons such as pregnancy, incarceration, declaration to take the GED exam or declaring intent to transfer to another district (McNeil, Coppola, Radigan, & Heilig, 2008). In 2012, President Obama allowed ten states to drop the NCLB law in exchange for higher standards approved by the administration (Feller, 2012). Michigan successfully applied for and received administrative approval to waive the NCLB requirements through the 2014-2015 academic year reported in the Detroit Free Press July 19, 2012, article Michigan Granted waiver from No Child Left Behind Act. In 2015, President Obama signed a new education law replacing NCLB with the Every Student Succeeds Act (ESSA).
Theoretical Framework
The seminal works of Schlesinger’s Cyclical Theory and Derrick Bell’s Critical Race Theory (CRT) which later was adapted by Ladson-Billings, Tate, Parker and others for use in education, provided the conceptual framework for this study. It was in the linking of Cyclical and Critical Race theories that provided insight to understand the life experiences of African American students at Wayne State University – experiences that have led to their lower representation in the ranks of graduates.
Cyclical Theory
Father and son historians, Arthur Schlesinger – senior and junior, developed the Cyclical Theory. They showed that when the value shifts occurred in the larger society, the schools made accommodations and those accommodations occurred in roughly fifteen year increments (Cuban, 1990). Those increments reflected generational attitudes or the amount of time for an individual to formulate ideas independent of their parents. During liberal eras, the focus turned to concerns for minorities and the poor, resulting in school to work programs and reduction in the achievement gap. At those times, White privilege interests were low. During conservative political eras, schools were concerned with producing students who could compete. In turn, White privilege interests were high.
Critical Race Theory
Critical Race Theory questioned viewing Whiteness as normal without thought of the oppressors or the oppressed. Those responsible for creating deplorable educational facilities and conditions did not have to witness that despair. Tyack and Cuban, (1995) gave an example of racism as parents not wanting other children to have more of an advantage than their own
children. In this instance, the racism was subtle. Of course, parents should want the best for their own children. However, the problem occurred when that thinking, followed by behavior, lead to the implementation of policies and practices that relegated a segment of the population to the fringes of society. Critical Race Theory provided analytical tools for the scholar to deconstruct how race and ethnicity were present in decision-making circles so that equity became the goal rather than one-upmanship.
The tenants of CRT:
1) That racism and racist practices may manifest themselves in institutions that espouse equity and social justice.
2) That the view of colorblindness created a lens though which the existence of race could be denied and the privileges of Whiteness maintained without any personal accountability.
3) That it was important to give voice to people of color honoring their unique experience.
4) That the White power structure tolerated or encouraged racial advances for Blacks only when they also promoted White self-interest.
5) That the experiences of people of color be reflected in the recording of history.
6) That race was recognized as a social construct, understanding that racism was a means by which society allocated privilege and status.
7) That mainstream cultural claims of meritocracy that sustain White supremacy in its belief that colorblindness would eliminate racism must be rebuffed, that racism was a
matter of individual versus systems and that all isms must be challenged (Thompson Christman, 2013, Harper & Wooden, 2009).
White Privilege
Cheryl Harris, 1993 developed the concept of Whiteness as property. She hypothesized that privilege or Whiteness was a resource of considerable value and investment receiving massive legal protections (Ladson-Billings & Tate, 1995). The greatest importance of those inequalities and privileges were that they were cumulative and intergenerational. When DuBois spoke of the duality of being Black in America, he gave voice to what African Americans and other ethnic groups have intuitively known both past and present. That rewards followed being White in America. This fact had been punctuated throughout American history with African Americans as well as other immigrants “passing” for White and assimilating to White culture by truncating or changing their names to more European names, as well as skin “Whitening” procedures marketed to melanin rich peoples.
As early as 1920, W.E.B. DuBois addressed the issue of Whiteness calling it a privileged color against which all other colors were measured and that it was a matter of White ownership of the earth forever and ever, Amen (Thompson Christman, 2013). Couching his definition in biblical language punctuated that DuBois saw this ownership as deliberate, purposeful, something that was maintained. The systematic pattern of inequality by ethnicity suggested a society organized along caste, not class lines and that those inequalities always seemed to favor Whites (Belfield & Levin, 2007). Kozol, 1991 stated that though there was a deep-seated reverence for fair play in the United States and a genuine distaste for loaded dice that was not the case in the areas of education, health care or inheritance of wealth. In those elemental areas, the
privileged wanted the game to be unfair and have made it so; and it would likely remain. As it was with public education, the American government perpetuated inequality. The schools operated in a system that preached fairness yet practiced injustice, as proofed by the stunning consistency in which the state underfunded poor schools (Kozol, 1991).
Aligning closely with Bell’s Critical Race Theory, Allport’s research identified the
Integrated Threat Theory of Prejudice. Meaning, individuals who identified with high Right-Wing authoritarianism values were especially sensitive to threats to traditional values. This group would display negative attitudes and behaviors toward those seen as holding different values than their own (Dovidio, Glick & Budman, 2005) In a stratified society demarcated by ethnicity, the thinking was often characterized as not wanting other children to have more of an advantage than their own children (Tyack & Cuban, 1995). Poor children have never been a well-represented constituency in education because they were overwhelmingly represented in the ranks of ‘other’ in America (McDermott, 2006). Historian, George Fredrickson realized that with White privilege the majority accepted as normal the cruel and unjust treatment and conditions placed on the ethno-racial other that would be unacceptable if forced upon them (Marger, 2009).
White Privilege vs. Equity Agenda in the Federal Government
Public policy has been an apparatus in the maintenance or temperance of White privilege. Fueled by public opinion, the United States government had the authority and power to determine the direction of many aspects of economic, social and governmental policies. However, those policies were subject to administrative changes and did not always lead to sustainable progress (Harper, Patton & Wooden, 2009). Public policymakers relied on their core values to form judgments concerning proposed courses of action (Marshall, Mitchell, & Wirt,
1989; Peterson, 2006). In the political landscape, terms like equality or traditional values were the rhetoric of liberals and conservatives. President Lyndon Johnson implemented Great Society social programs to equalize opportunity to uplift the poor and disenfranchised during the 1960’s. In the 1980’s, President Reagan, who believed that government should be small, supported traditional values and a reduction of spending on social programs in order to limit control of the nation’s resources to those who had always held it (Bennett, 1988; Hacsi, 2002).
The presidencies of those two men were important to this research in that they reflected a cyclical view of the ebb and flow of public opinion infusing public policy. Those two philosophical giants came to power at pivotal periods in America with one diminishing and the other perpetuating White privilege interest. There was a twelve-year difference between the end of Johnson and Reagan’s terms. This was consistent with Cyclical Theory in that value shifts occurred in roughly fifteen-year increments. Both men served two terms. They both raised awareness for public education. They both implemented reforms. However, their beliefs as to the role of the federal government to eradicate social ills had very different educational and life outcomes for those affected by their policies.
The tenor of the country that Johnson inherited was wrought with social tensions. He assumed the presidency after the assassination of President Kennedy. The country was engaged in the Vietnam War. President Harry Truman had desegregated the armed forces and many agitated for greater racial-social integration concurrent with the fight for civil and voting rights. With a highly politicized generation of baby boomers challenging traditional ideas on marriage, sex, and women’s roles at home and in the workforce, public opinion aligned with equity issues, showing a decrease in preserving White privilege interest.
President Johnson set out to build a great society through the implementation of social policies that he believed would change the economic, social and class status of the poor. He believed his Environmental, Civil, Educational and Social legislation would dismantle the caste-like social systems of opportunity that differentiated Black and White achievement (Bennett, 1988; Harper et. al. 2009; Lawrence III, 1987; Rothstein, 2004). Many of the children of this generation, or already in the educational pipeline, would have experienced Johnson’s educational reform policies – in particular, the Higher Education Facilities Act, 1963 establishing grant programs and making community colleges more accessible; the Elementary and Secondary Education Act, 1965 establishing Head Start as a permanent program; and the Higher Education Act, 1965 increasing university budgets and resources, and creating TRiO initiatives – Upward Bound, Talent Search, and Student Support Services program, collectively known as TRiO. Johnson’s initiatives broke the logjam that had prevented the use of federal funds in education for fear of race, religion and federal control issues and increased federal spending on education by 1400 percent during the 1960’s and 1970’s (Hacsi, 2002).
The viable solution to address concerns of access to higher education offered by the Johnson administration came in the form of federal and state spending equaling around $50 billion (Peterson, 2006). As in the Elementary and Secondary Education Act – which stipulated for the first time that programs receiving government funding provide data driven evidence of their effectiveness through annual reports – so to with this new legislation, known as the Higher Education Act of 1965, (Hacsi, 2002). In addition, the law strengthened the educational resources of colleges and universities and made resources available to individuals. The purpose of those programs was to help historically underrepresented low-income students gain access to
post secondary institutions and help with their acclamation process once there. Through this Act, students were eligible to receive financial resources through the creation of the Pell Grant program and the availability of low interest loans (Belfield & Levin, 2007; Tinto, 2004).
By the time Ronald Reagan took the oath of office, public opinion had shifted from Johnson’s America. Many Americans believed that Affirmative Action initiatives had run amuck. The handling of the Iran hostage crisis raised perceptions that America needed stronger leadership. His solution, coined Reaganomics or trickledown theory, was touted as a cure to raise the American economy from a massive economic recession by investing in the wealthy, believed to create jobs, the masses and the economy would lift. However, this period, considered a backlash to liberal policies, saw the closing of mental hospitals with residents released to the streets, a loss in federal funding for social programs aimed at supporting subsistence levels for the poor and the rise of a new class of people known as homeless. The conservative value structure did little to eliminate the inherent racial aspect to disparity in economic, social and educational achievement. Therefore, educational reform during this period only illuminated the differences in achievement rather than reduced those differences.
The significance of the dialogue shift from Johnson to Reagan’s educational reform was that it took the focus off the systemic cause of inequality, that Johnson’s policies addressed – ethnic stratification, by equity in education solutions, and placed the focus on an outcome of the inequality (Johanngmeier, 2010). This inequality, being a lesser-prepared high school graduate resulting in a lesser-prepared worker, signaled the end of the social reform legislation formulated by President Johnson and ushered in a conservative agenda relying more on standardized assessment scores less friendly toward the poor (Harper, Patton & Wooden, 2009; Rothstein,
2004). The conservative educational reform legislation had its genesis in the Reagan administration with a Nation at Risk report, the Charter school movement and No Child Left Behind where conservatism was redefined. This transition caused public schools to serve many masters with many of their task contradictory and whose implications defined educational goals and reform (McDermott, 2006). The programs that Johnson had implemented were now in opposition with the newer policies.
Many policies embedded within mainstream, racist and hegemonic framework consistently questioned the worthiness of African Americans as educated citizens and the legitimacy of their presence in higher education. In larger society, treating minorities poorly was justified through the use of statistics showing ethnic minorities as lesser than – less civic minded, less employable, less educated. Those facts, believed pointed to a genetic deficit that African Americans did not possess the mental capacity to learn, nor did they have any real need for formal postsecondary education. Therefore, better schools or social change would do little to affect those lives. The idea that African Americans were intellectually inferior was engrained in the fabric of education. Racism went beyond education, the United States, founded on racist principles, impregnated with systems that perpetuated this ideology infused education. The reality of poverty or inadequate public schools or racial segregation did little to sway public opinion (Kozol, 1991).
The role of government to educate its citizenry had been very different for people of African descent compared to those of European descent, particularly as it related to economic investment. Those of African descent in the United States had to go through legislative processes to force the government, industry, and other Americans to treat them with equal protection under
the law. Public education was no exception. Concerns about the re-segregation of the schools or the rationale behind desegregation did not raise the ire of the public and hence public officials and courts (Kozol, 2005).
deMarrias & LeCompte, 1999 incorporated John Ogbu’s analysis of minority. Ogbu surmised that there were different types of minorities and depending on the type determined how that person would be treated in America. He identified the Autonomous Minority, as the ethno-other by religion such as being Jewish, Mormon, or Muslim, distinct primarily through their religious practices. Next, Ogbu defined the Voluntary Minority, those seeking freedom from persecution, such as the mass exodus of the Syrian, Kurdish and Croatian peoples. Finally, the Involuntary Minority, whom Ogbu defined as forced assimilation – Native Americans, Mexicans and Africans. This group, physically identifiable, was less able to assimilate into traditional American life and primarily existed in the shadows within American culture. As Congressman Augustus Hawkins once asked, “What do you do with a former slave when you no longer need his labor?” the same can be asked of the Native American when you no longer need his land, or the Mexicans that have been displaced.
Cornell West added to this scholarship questioning why discussions on race in America conclave around the Involuntary Minority. Those discussions of the problems in America were bracketed by ethnicity. The academic achievement gap was the difference between White and Black performance. West questioned why issues were defined as the problems Black people posed for Whites occurred in the first place, rather than discussion on how viewing ethnic minorities that way revealed about our nation (Thompson Christman, 2013). Alternatively, as Kozol stated, what can be done about the values of the people who segregated those
communities? There was no academic study of the pathological detachment of the rich, although it would be useful to society to have some understanding of those matters. Fine (2004) addressed the crisis of Whiteness, “I worry that by keeping our eyes on those who gather disadvantage, we have failed to notice the micro practices by which White youth, varied by class and gender, stuff their academic and social pickup trucks with goodies not otherwise available to people of color.”
Kendall Thomas, a Critical Race theorist, attempted to deconstruct assumptions that the race problem was a Black problem. He argued that people did not have a race, that in fact, they were “race-d.” Meaning they were assigned and invested with races. That scholars needed to disassociate race with being human and view race as a product of social practices (Harvard Review). This aligned with Ogbu, people were sorted and accepted based on how different they were from the standard of Whiteness.
An article title, Teacher apologizes for slavery references in math homework, published
in the Detroit News January 2012 illustrated this point. The Atlanta teacher assigned math homework that included a 20-question assignment that used tales of slave beatings and field labor. One problem read, “If Frederick [Douglass] got two beatings per day, how many beatings did he get in one week?” Another asked, “Each tree had 56 oranges. If eight slaves pick them equally, then how much would each slave pick?” The guise of the assignment was the teaching of math concepts. The reality of the assignment was that it reinforced historical subjugation of African Americans, legitimizing it through the teaching of math concepts, while heightening ethnic divisiveness and rank. Those practices were symbols of racist ideology met to impart feelings of inferiority to ethnic minorities and superiority for the ethnic majority about who they were and whom they would be.
From a regional perspective, the African American students matriculating to Wayne State University in the 1990s grew up in the post Johnson era. Those students would have been more likely to have experienced some of Johnson’s reforms in the form of Head Start or received free or reduced lunch that aided in their academic preparedness, as opposed to Reagan era students. The reality was that students attending WSU in the 1990s did better than those matriculating in
2010. As noted in the Journal of Negro Education, Four Decades of Progress and Decline: An
Assessment of African American Educational Attainment, those students were attending and graduating in numbers comparable to African American students enrolled at HBCU institutions. The success of African American students at WSU could be attributed to the fact that Wayne State University had a lenient enrollment policy with a social environment conducive to their success.
During the 1980s and 1990s, WSU relied less on college admission exams such as the ACT or SAT. The college had successfully competed for and received the TRiO Student Support Services’ grant funded through the Higher Education Act of 1965. This grant aimed to provide support, both financially and socially, to facilitate the transition of low-income first generation students to college. The city of Detroit was under the leadership of its first African American mayor, Coleman Young, who was bold in his pro Black posturing and advocacy for African Americans. Students were able to secure Pell grants that often fully funded their education, allowing them to graduate without securing debt or dependence on family financial contributions, which in many cases were nonexistent. Finally, many of the students were local coming from neighborhoods adjacent to the university. They were not geographically displaced and therefore did not to have to navigate another barrier.
The polarized educational environment in Michigan with challenges to affirmative action juxtaposed with a large African American community and White flight changed the trajectory of the 2010 Wayne State University African American students as compared to their 1990
predecessors. The Chronicle of Higher Education article, Wayne State's Black-White Graduation
Gap Reflects Detroit's Struggles referenced something had changed.
Wayne State University adopted stringent new policies in 2000 aligning with the culture
instituted with a Nation at Risk and with the assessment movement. Admission standards were
raised requiring minimum SAT/ACT scores. In addition, requirements for graduation changed. Students needed to pass minimum mathematic and English proficiency. In addition, remediation courses at the university level were assigned self-paced computer-based instruction rather than taught by seasoned subject certified instructors. Pell grant restrictions were implemented, forcing low-income students to rely on parent income status rather than their own resources thus incurring debt. The ability to file as independent was changed from living separate from one’s parent(s) or orphaned, to the students’ now either being a parent themselves, a military service person, age twenty-six or older, in addition to poverty level requirements. Skyrocketing college tuitions beginning in the 1990s outpaced the flat Pell grants. While financial aid also increased, students with the largest family incomes received the largest increases in aid. For public institutions, the cost to attend college represented roughly 6 percent of income for students from high-income families and 71 percent for students from low-income families. Those changes had the effect of stalling low-income students in the educational process or worse yet, stopping them from ever enrolling due to their inability to finance their first semester (Tinto, 2004).
As the university closed it ranks, the city of Detroit changed. The city was particularly hard hit by the factors contributing to poverty stemming from a lack of education and the circular affects this had on employability, incarceration and the inability to maintain permanent housing. The Detroit News April 2, 2009 reported that according to U.S. Census Bureau and Internal Revenue Service data, “every day, Michigan got less populated, less educated, and poorer because of outmigration.” Michigan was in the midst of an economic and educational transformation. The state was experiencing record multi-year budget deficits; the decline of the automobile industry had been termed “carmageddon” by auto insiders; and the Detroit Public Schools system was leaking students by the tens of thousands. In the past decade, Detroit Public Schools lost nearly 80,000 students (Detroit News April 2, 2009). Increased competition from charter and private schools, as well as families moving out of the state due to displacement from the work force contributed to the decline.
In addition to reasons given by the State, additional problems plagued the Detroit Public Schools. The graduation rate of ninth graders from high school was 25 percent, the national average for the class of 2004-2005 was 74.7 percent [Source: National Center for Education Statistics, 2008]. The illiteracy rate for Detroit residents was nearly 50 percent, with 60.1 percent lacking a high school diploma. Crime and corruption uncovered in the school district further contributed to the hemorrhaging of students [Source: U.S. Census Bureau, 2000]. This convolution of events attracted national attention. In the summer of 2009, Time magazine commissioned a yearlong project titled, “Assignment Detroit.” Time purchased a home and stationed journalists, photographers and bloggers with the charge of bringing attention to this crisis and the hope of documenting the city’s recovery (Time, September 24, 2009).