Knowledge of the Concept Light Rail Transit
:
Determinants of the Cognitive Mismatch
between Actual and Perceived Knowledge
Lieve Creemers, Hasselt University, Belgium
Mario Cools, Hogeschool-Universiteit Brussel, Belgium
Hasselt University, Belgium
Research Foundation Flanders (FWO), Belgium
Hans Tormans, Hasselt University, Belgium
Davy Janssens, Hasselt University, Belgium
Geert Wets, Hasselt University, Belgium
Travel Behaviour Research: Current
Foundations, Future Prospects
13th International Conference on Travel Behaviour Research
Toronto 15-20, July 2012
Knowledge of the Concept Light Rail Transit:
Determinants of the Cognitive Mismatch between Actual
and Perceived Knowledge
Lieve Creemers, PhD Candidate
Transportation Research Institute (IMOB), Hasselt University, Wetenschapspark 5 bus 6, BE-3590 Diepenbeek, Belgium
Phone: +32(0)11 26 91 34
E-mail: [email protected]
Mario Cools, Assistant Professor
1
Centre for Modelling, Information and Simulation (CIMS), Hogeschool-Universiteit Brussel, Warmoesberg 26, BE-1000 Brussels, Belgium
2
Transportation Research Institute (IMOB), Hasselt University, Wetenschapspark 5 bus 6, BE-3590 Diepenbeek, Belgium
3Research Foundations Flanders (FWO), Egmontstraat 5, BE-1000 Brussels, Belgium
Phone: +32(0)2 210 12 41
E-mail: [email protected]
Hans Tormans, PhD Candidate
Transportation Research Institute (IMOB), Hasselt University, Wetenschapspark 5 bus 6, BE-3590 Diepenbeek, Belgium
Phone: +32(0)11 26 91 37
E-mail: [email protected]
Davy Janssens, Assistant Professor
Transportation Research Institute (IMOB), Hasselt University, Wetenschapspark 5 bus 6, BE-3590 Diepenbeek, Belgium
Phone: +32(0)11 26 91 28
E-mail: [email protected]
Geert Wets, Full Professor
Transportation Research Institute (IMOB), Hasselt University, Wetenschapspark 5 bus 6, BE-3590 Diepenbeek, Belgium
Phone: +32(0)11 26 91 58 E-mail: [email protected]
Abstract
The Flemish public transport company “De Lijn” is planning the development of a new Light Rail network for medium range distance trips (10 to 40km). A challenge exists in the fact that the concept of Light Rail Transit (LRT) is relatively unknown in Flanders. Therefore this paper explores the knowledge of the concept ‘Light Rail Transit’ among the Flemish population. To investigate the knowledge, two separate
binary logit models are estimated to explore the determinants of the overall actual knowledge and the determinants of a cognitive mismatch. The results show that age, sex, public transit use, household size, bicycle ownership and weekly number of shopping activities contribute significantly to the overall actual knowledge of the LRT-concept. Besides, cognitive mismatch is only significantly affected by age and gender. Moreover, the results reveal a serious lack of knowledge of the concept of LRT. Consequently, a successful implementation of the LRT-system in Flanders may be jeopardized and thus it is of crucial importance to raise the level of knowledge. A first option is knowledge acquisition based on experience of the transit network. In this view, it can be a good idea to develop “travel-one-day-for-free” marketing actions. Second, it is important to provide information to the travelers by contriving information campaigns based on the determinants identified by the models. How the campaigns should be constructed from an intrinsic and psychological point of view and deliberating between the methods of communication to reach the various target groups are some important considerations for further research.
Keywords
Light Rail Transit, Determinants, Cognitive mismatch, Stated Knowledge, Perceived Knowledge, Actual Knowledge, Binary logit model
Preferred Citation
Creemers L., M. Cools, H. Tormans, D. Janssens, G. Wets (2012). Knowledge of the Concept Light Rail Transit: Determinants of the Cognitive Mismatch between Actual and Perceived Knowledge. Paper presented at the 13th International Conference on Travel Behaviour Research, Toronto, July 2012.
1. Introduction
Urban sprawl in Flanders (the Dutch speaking, northern part of Belgium) has lead to a strong spatial fragmentation of social and economic activities. As a result, medium distance trips (10 to 40km) increasingly gain importance. However, there are no adequate public transport options available for this kind of trips that can act as a complete competitive alternative for the car. As a result, traffic congestion on the main roads is hard to combat and even increasingly affects the underlying secondary road network. To bridge the gap between demand and supply of public transport options for these medium distance trips, large infrastructure investments are planned by the (monopolistic) Flemish public transport company “De Lijn” (De Lijn, 2002; Varinia, 2008), with a clear emphasis on the construction of different Light Rail systems. Note that these investments are generally proposed in the context of broader defined objectives such as achieving a more environmentally friendly and sustainable travel behavior.
Until now, only one Light Rail system is implemented in Flanders, namely the 19th century developed coastal tram, which interconnects the coastal municipalities over a total distance of 67km. In spite of the relative success of this system, the concept of Light Rail Transit (LRT) is relatively unknown in Flanders, because nowhere else in the region Light Rail systems were implemented and the coastal tram was never marketed as a Light Rail system.
This paper explores the knowledge of the concept ‘Light Rail Transit’ among the Flemish population. If a lack of knowledge can be detected, it is important to provide information about this particular mode and dispel misperceptions so travelers might base their travel decisions on a more accurate and complete view of the situation. One way to achieve this is to provide information through professional marketing and information campaigns. However, knowledge of the concept LRT may vary from person to person. To be most efficient, campaigns should take into account these inter-personal differences. Therefore, this paper investigates the inter-personal determinants of the actual knowledge of LRT and the ones influencing a cognitive mismatch between the actual and perceived knowledge of LRT. By identifying these determinants, customized campaigns can be developed for Flanders.
The remainder of the paper is structured as follows. First, a literature review is given in Section 2. Consequently, Section 3 describes the data that was collected as part of this study. Section 4 explains the theoretical background of the applied statistical methodology. Thereupon, the results of the descriptive statistics of the level of knowledge of the concept LRT and the results of the statistical analysis are discussed in Section 5. Finally, Section 6 provides the most important conclusions and formulates policy recommendations and avenues for further research.
2. Literature Review
2.1. Knowledge Gap and Misperceptions
As for instance reported by Creemers et al. (2012), the success of a Light Rail system depends on a multitude of features, which can be broadly categorized into 4 classes: system-specific, socio-economic, policy-related and regional characteristics. In addition, it is reasonable to expect that there is an inter-personal cognitive aspect playing: the level of success of a new Light Rail system might depend on people’s knowledge of the system. This is confirmed by various studies which state that a lack of system knowledge can be considered as an important barrier of public transport use (Dziekan and Dicke-Ogenia, 2010; Bonsall et al., 2004; Brög, 2002). In addition, Dziekan (2008) states that travelers can only choose between travel options of which they are sufficiently aware. Especially habitual travelers are not aware of the complete set of travel options, even when the alternative options have more benefits in terms of travel time, travel costs and environmental costs. As a result, the traveler is not always taking the optimal choice (Dziekan and Dicke-Ogenia, 2010).
Several studies state that sub-optimal travel decisions might arise when they are based on a distorted view of the actual situation (Guo, 2011; Bonsall et al., 2004; Chorus et al., 2007). In particular, Guo (2011) notices that scale distortions on a transit map have a profound impact on passengers’ travel decisions, path choices in particular. Furthermore, Bonsall et al. (2004) indicate that people with little experience of bus use generally overestimate bus journey attributes (e.g. fares, access/egress, waiting and in-vehicle travel time) and generally underestimate car journey attributes. One reason for these misperceptions is the lack of system knowledge. Notwithstanding, these kind of distortions have far-reaching consequences which in general encourage car use and adversely affect more sustainable modes of transport.
2.2. Increasing Knowledge and addressing Misperceptions
Providing information to the travelers plays a crucial role in knowledge acquisition (Chorus et al., 2007; Rose and Ampt, 2001) and therefore contributes to dismissing distortions in human perceptions. This is confirmed by Dziekan (2008), who stated that knowledge of the public transport system will increase through professional marketing and information campaigns. Moreover, Cronin and Hightower (2004) argued that informing travelers about the public transit service is one of the most important objectives of marketing campaigns.
Dziekan (2007) investigated the learning process associated with the use of an unfamiliar public transport system in Stockholm and concluded that a certain cognitive effort is required to learn the system. Dziekan illustrated that knowledge was acquired very quickly in the first days of using the public transport system and concluded that it is vital to provide information to the traveler in the very beginning
to support this learning process. Brög (2002) and Dziekan (2008) state that using the system and gaining experience will correct distorted perceptions in people’s thinking and will raise the level of knowledge.
Beale et al. (2007) explored whether public transit’s information enriching campaigns could correct misperceptions (e.g. overestimating in-vehicle travel time, waiting time, fares…) that are negatively affecting bus use. A first trial, a general campaign, focused on mitigating common misperceptions by incorporating “facts” in the marketing material. The results of the marketing campaign were mixed. Some groups increased their bus use while others, particularly young males and travelers with little experience of buses, embedded their negative opinions even more. To prevent such unwanted effects of a general campaign, Beale et al. (2007) adopted a more targeted approach. The second trial was tailored at mitigating misperceptions of travelers who did not use public transit often but were willing to consider doing so. The results of the tailored approached indicated an increase in bus use, especially by males, pointing out that some misperceptions were discarded.
2.3. Market Segmentation
As reported above, travelers are very diverse and respond in a different way to marketing campaigns (Beale et al., 2007). As a result, marketing and information campaigns that are fine-tuned on specific target groups lead to more efficient and effective results, as they will better match backgrounds of the traveler. General socio-economic characteristics (age, gender, income and automobile ownership), trip characteristics (trip purpose, time, trip destinations…) and frequency of use of the transport mode (car, transit) are the most common base for segmentation in the field of transportation (Cronin and Hightower, 2004; Shiftan et al., 2008).
Various studies highlight the importance of market segmentation in the global field of transportation. Recent examples include Cools et al. (2009), Diana and Mokhtarian (2009) and Diana and Pronello (2010). With regard to public transit, Cronin and Hightower (2004) pinpointed market segmentation as one of the most valuable and useful marketing strategies in public transit organizations. Guiliano and Hayden (2005) described market segmentation as a profitable marketing strategy in order to increase transit ridership. In line with this, Beale et al. (2007) indicated that market segmentation is an effective approach to increase transit use without providing unwanted effects in other segments. In addition, Shiftan et al. (2008) applied market segmentation in order to design more efficient transit services.
A particular application of market segmentation in the field of public transit marketing is the Individualized Marketing approach reported by Brög et al. (2002). Individualized Marketing has the purpose to correct misperceptions in public transit and to decrease car use. For this, households are contacted in a personal way and subsequently segmented in several categories. Each segment receives a “treatment”
that is determined by their specific needs, ranging from no further contact to mailing a generic brochure or a reward gift to encourage more frequent use of public transit. This individualized approach is proven to be highly successful, but is on the other hand very expensive and time consuming.
3. Data Collection
To investigate the knowledge of the concept Light Rail Transit, data were collected by means of a self-reported questionnaire. Because of the numerous advantages of web-based surveys, which have been well documented (Sperry et al., 2012; Wright, 2005; Pan, 2010), the questionnaire was mainly distributed on the internet. To overcome the potential sample bias caused by the underrepresentation of unemployed and lower income groups and the overrepresentation of young adults in web-based surveys, additionally traditional paper and pencil questionnaires were distributed. After all, literature (see e.g. Hart et al. (2012); Arentze et al. (2005); Fan and Yan (2010); Smith and Spitz (2010)) attributes this sample bias mainly to differences in internet access.
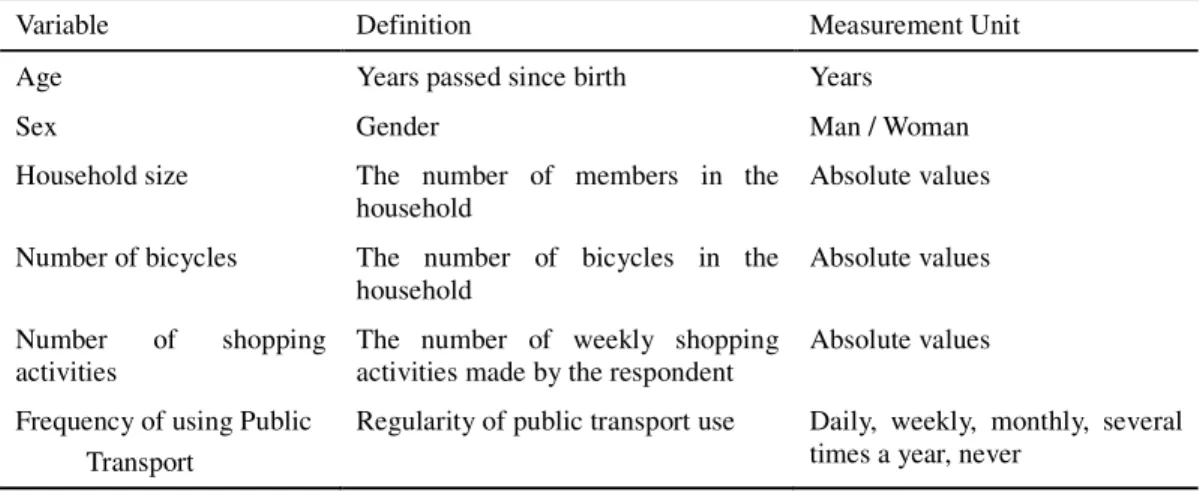
The survey was conducted on a person-based level and complete information of 492 respondents (aged 18 or older) was collected. The survey consisted of two main parts. The first part encompassed a personal questionnaire were various socio-economic indicators of the respondents were queried (e.g. age, gender, income, household size) as well as the public transit use expressed in terms of the frequency of using the diverse public transport modes. Moreover, the survey asked how often the respondents perform a work trip, a shopping trip and a leisure trip. These three types of trips were specifically queried since these are the most frequently performed trips according to the Flemish national travel survey. Cools et al. (2010) reported that they account for 50.5% of the trips made by the Flemish people. To limit response burden, other trip purposes like business trips and bring/get activities, were not considered. Table 1 displays an overview of the variables collected in the personal questionnaire, together with their descriptions and the corresponding measurements units. Due to the large amount of variables in the survey, the table is confined to the variables that are included in the final models which are reported in the results section of this paper (Table 6 and Table 7).
The second part of the survey queried information about the perceived and revealed knowledge of LRT. Perceived knowledge was measured by the question “Do you exactly know the meaning of Light Rail Transit? (Yes/No)”. Revealed knowledge was tested in two ways. First, respondents were confronted with a list of public transit pictures which contained a Light Rail system, a subway, a tram, a train and a trolley-bus. From this list, the respondents were asked to indicate the correct Light Rail system. Second, the respondents were asked to give their own worded definition of LRT. These definitions were compared to the definition as was established by the International Association of Public Transport (UITP) and were classified as correct or
incorrect. The UITP defines Light Rail Transit as “an electric rail-borne form of transport which can be developed in stages from a tramway to a rapid transit system operated partially on its own right-of-way. It stand midway between conventional urban tram systems at one extreme and heavy rail or underground metropolitan railway at the other.”
Table 1: Overview of Variables included in the Final Models
Variable Definition Measurement Unit
Age Years passed since birth Years
Sex Gender Man / Woman
Household size The number of members in the household
Absolute values Number of bicycles The number of bicycles in the
household
Absolute values Number of shopping
activities
The number of weekly shopping activities made by the respondent
Absolute values Frequency of using Public
Transport
Regularity of public transport use Daily, weekly, monthly, several times a year, never
The final part of the questionnaire contained a stated adaptation experiment in which the respondents had to indicate their preferred mode based on various system-specific attributes like cost and travel time. A detailed discussion of the results of this experiment is provided by Creemers et al. (2012).
The observations in the sample were weighted to achieve an optimal correspondence between the survey sample composition and the Flemish population. These weights are calculated by matching the marginal distributions of the sample and the population, based on the personal attributes age and gender of which perfect knowledge for Flanders is available (NIS, 2010). The weighted frequencies of the respondents’ characteristics can be found in Table 2.
Table 2: Weighted Frequencies of Respondent Characteristics
Age class Man Woman Total 18-24 5.1% 5.0% 10.1% 25-34 7.8% 7.7% 15.5% 35-44 9.4% 9.1% 18.5% 45-54 9.4% 9.1% 18.5% 55-64 7.6% 7.6% 15.2% 65+ 9.6% 12.6% 22.2% Total 48.9% 51.1% 100%
4. Modelling Methodology
Recall that the main objective of this paper is to investigate the Flemish level of knowledge of the LRT-concept and to identify the determinants of the actual knowledge and cognitive mismatch between actual and perceived knowledge of the concept. To obtain primer understanding of the level of knowledge, simple descriptive analyses are used. To gain a more refined insight into the determinants, a suitable modeling technique is required. Since both actual knowledge and cognitive mismatch have a binary outcome (Yes/No), the most appropriate model to estimate is a binary logit model.
Let Yi denote the binary outcome indicating the acquisition of actual
knowledge/cognitive mismatch (Yes/No) for the i-th observation. This outcome is Bernoulli distributed with success probability P(Y=1) = π. Formally, the density of this distribution can be written as (Molenberghs and Verbeke, 2005)
. ) 1 ln( 1 ln exp ) ( − + − =
π
π
π
y y fThe natural link function for a binary model is the logit link, leading to the classical logistic regression model. The mean response is modeled as (Molenberghs and Verbeke, 2005) logit[π(x)] = x kxk x x
β
β
α
π
π
+ + + = − ( ) ... 1 ) ( log 1 . (2) Here, ) ( 1 ) ( x x π π− denotes the odds, α the intercept, β
T the vector of model
parameters to be estimated and XT the vector of explanatory variables. At times, the probit link is used instead of the logit link but both functions behave very similarly and provide approximately the same parameter estimates (Molenberghs and Verbeke, 2005). The unknown parameters are attained by maximizing the log likelihood using a ridge-stabilized Newton-Raphson algorithm. The log-likelihood function is of the form (SAS Institute Inc. 2011)
)). , , y ( log( ) , , (
µ
φ
iµ
iφ
i f y L =∑
(3)Where yi represents the response for the i-th observation, µi the mean, and φ the
dispersion parameter. Equation (2) can be rewritten to the equivalent form
[
1 exp( ... )]
. ) ... exp( ) ( 1 1 k k k k x x x x xβ
β
α
β
β
α
π
+ + + + + + + =According to Equation (2), the estimated parameters should be interpreted as the change in the predicted log odds for a one unit change in the corresponding explanatory variable. In this paper, the odds is delineated as the probability of knowledge acquisition divided by the probability of no knowledge acquisition (Model 1), and as the probability of a cognitive mismatch divided by the probability of no cognitive mismatch (Model 2). A common way to interpret the results, is by calculating the Odds Ratio (OR), which can be attained by taking the exponent of the parameter estimate (eβ). If the outcome of the OR is smaller (resp. greater) than 1, than it corresponds to a decrease (resp. increase) in the odds for a one unit increase in the explanatory variable. This implies a decrease (resp. increase) in the probability of having (overall) actual knowledge (Model 1) or having a cognitive mismatch (Model 2) for every unit raise in the corresponding explanatory variable. A second way to interpret the parameters is by focusing on the sign of the estimated parameter, which determines whether π(x) - respectively the probability of actual knowledge and the probability of a cognitive mismatch - is increasing or decreasing as x increases (Agresti, 2002).
Two separate models are estimated to explore the determinants of the actual knowledge (Model 1) and the determinants of a cognitive mismatch (Model 2). An elaborate description of the considered variables is already provided in the previous section. The models were constructed by applying forward selection to find the most relevant variables in the model. The final models are then checked for multicollinearity to ensure the reliability of the parameter estimates. Multicollinearity is assessed using Variance Inflation Factors (VIF). The results of the analysis do not indicate problems of multicollinearity. The outcome of the model estimations are presented in the next sections.
5. Results and Discussion
5.1. Descriptive Analysis
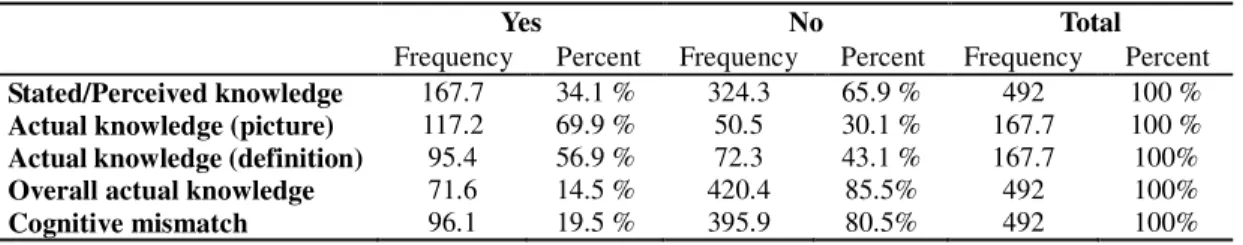
The results of the descriptive analysis of the survey are displayed in Table 3. From this table one can see that only a minority of the respondents (34%) stated they understand the meaning of the concept Light Rail Transit (perceived knowledge). For those respondents who claimed they had knowledge about the LRT-concept, also actual knowledge was tested. The results indicate that about 69.9% of the respondents were able to mark the correct picture with a Light Rail system. The remaining 30.1% who were unable to mark the correct picture, could be further subdivided into 6.7% who had absolutely no idea, 10.3% who indicated subway, 7.0% tram, 4.3% train and finally 1.9% trolley-bus. The second way of testing actual knowledge of the LRT-concept was by asking the respondent to provide a definition of LRT. Only 57% (4)
was able to give a (quasi-)correct definition of the concept LRT. Note that the definition was considered ‘quasi-correct’ if (some of) the following key-words (or their synonyms) were part of the respondent’s definition: separate railway bedding, express tram, between tramway and train, regional transit system. Actual knowledge was not investigated for respondents who claimed they had no knowledge of LRT. This was a conscious choice, since the survey also contained a stated adaptation experiment as indicated in Section 3. Thus, it was necessary to acquaint the respondents travelers with a correct definition of LRT such that they based their answers in the stated adaptation experiment on correct information.
Furthermore, Table 3 displays the share of respondents having overall actual knowledge, which is defined as respondents who marked the correct LRT-picture and provided a quasi-correct definition. Note that given the logic structure incorporated in the questionnaire, by definition these respondents also stated that they had knowledge about the LRT-concept. It is also noteworthy to indicate that respondents who indicated they had no knowledge are assumed to have no overall actual knowledge because of the definition acquaintance reported before. It is striking that only 15% of the respondents had overall actual knowledge of the concept LRT, implying that as many as 85% does not know the true denotation of LRT. Finally, the cognitive mismatch, defined as the difference between the stated (perceived) knowledge and the overall actual knowledge, is quantified. The results indicate that 2 out of 10 respondents were subject to a cognitive mismatch. When the cognitive mismatch is assessed for respondents who stated they had knowledge of the LRT-concept, cognitive mismatch accumulated to 57% (=96.1/167.7). It can be concluded from above results that Flemish people have a major lack of knowledge of the concept LRT, which can lead to above mentioned sub-optimal travel decisions and to an unsuccessful implementation of the system.
Table 3: Descriptive Results of the Various Knowledge Levels
5.2. Model Estimation Results
5.2.1. Overall Results
Table 4 displays the results of the overall significance tests for the final models. The most marked finding from this table are the socio-economic variables age and sex, which were significantly contributing to both (overall) actual knowledge and a cognitive mismatch (p-values <0.05). Age turns out to be the most important determinant when modeling the cognitive mismatch (smallest p-value), while sex is
Yes No Total
Frequency Percent Frequency Percent Frequency Percent Stated/Perceived knowledge 167.7 34.1 % 324.3 65.9 % 492 100 % Actual knowledge (picture)
Actual knowledge (definition)
117.2 69.9 % 50.5 30.1 % 167.7 100 % 95.4 56.9 % 72.3 43.1 % 167.7 100% Overall actual knowledge 71.6 14.5 % 420.4 85.5% 492 100% Cognitive mismatch 96.1 19.5 % 395.9 80.5% 492 100%
the most influencing determinant of actual knowledge. Since age and sex are the only significant variables influencing a cognitive mismatch, these are two important determinants that need to be considered when developing marketing campaigns to raise the state of knowledge among the Flemish population. This finding is confirmed by literature, which shows that age and gender are common characteristics for market segmentation in the field of transportation (Cronin and Hightower, 2004; Shiftan et al., 2008). The results from the model predicting actual knowledge show that, next to age and gender, also other variables significantly affect the actual understanding of the concept LRT, namely the respondent’s current public transit use and the number of weekly shopping activities made by the respondent. Also this finding is in line with literature (Cronin and Hightower, 2004; Shiftan et al., 2008) indicating that trip purpose and frequency of use are important determinants for travel market segmentation. In addition, literature shows that automobile ownership is an additional base for market segmentation. However, in this study, the effect of automobile ownership could not be confirmed. Notwithstanding, the number of bicycles in the household, which is also an indicator for the range of travel options, does have a significant effect on the actual knowledge of the LRT-concept. The significance of bicycle ownership can be accounted for by the fact that bicycle ownership is to some extent an expression of environmental awareness, just like public transit use. Finally, it was found that household size was a significant determinant of actual knowledge as well.
Table 4: Results of the Overall Significance Type III-
Parameter DF Overall actual knowledge Chi² P-value Sgn.
Cognitive mismatch Chi² P-value Sgn.
Age 2 8.13 0.0172 * 37.93 <0.0001 ***
Sex 1 8.77 0.0031 ** 7.58 0.0059 **
Frequency of public transport use 4 13.13 0.0107 * / / /
Household size 1 7.64 0.0057 ** / / /
Number of bicycles 1 8.71 0.0032 ** / / / Number of shopping activities 1 6.42 0.0113 * / / /
* P-value <.05, ** P-value < .01, *** P-value < 0.001
5.2.2. Overall Results
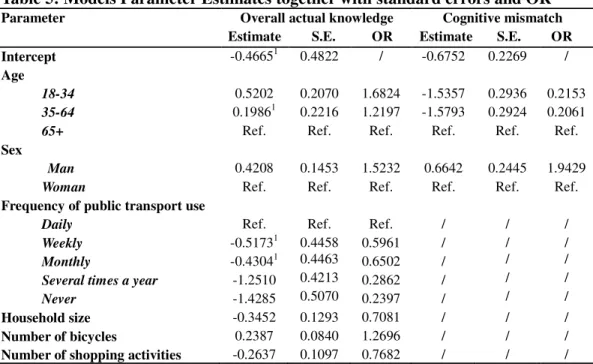
The parameter estimates and their standard deviations are shown in Table 5. As expounded in Section 4, the estimated parameters should be interpreted in terms of odds ratios (ORs), or according to the sign of the parameter.
The results point out that the odds of actual knowledge in the age category 18-34 equals 1.68 times the odds of actual knowledge in the age category 65+. This implies that the probability of actual knowledge of LRT is significantly higher in the youngest age group compared to the oldest category. Although not significant, there is an indication that the 35-64 year olds are more likely to have actual knowledge than people over 65 years. For the cognitive mismatch model, it is striking that people above 65 have significant higher probability on a cognitive mismatch than both
younger categories. This is in line with the results of the actual knowledge model. Consequently, a general conclusion can be drawn that people above 65 years of age are more likely to have less understanding of the concept LRT and have a higher probability of a cognitive mismatch compared to the younger age categories. Several explanations can be formulated to explain the role of age. First, the degree of habitual behavior among older persons is higher, which forms a threshold for new transport options (see Section 2). Older people are more conservative and reserved for new technology. Second, young persons are more familiar with new and modern media like smart-phones, facilitating the wide-spread access to real-time information sources such as news bulletins. Consequently, young persons are more acquainted with the planned LRT-projects. Third, the use of the English term “Light Rail Transit” can also be a barrier in the acquisition of knowledge for elderly, since they are less confident with this language.
Next to age, gender also contributed significantly to both models. With regard to the actual knowledge model, males are more likely to have knowledge of the concept LRT than women. This can be explained by their greater interest in technology. However, as can be derived from the parameter estimates of the cognitive mismatch model, men have a higher probability on a cognitive mismatch compared to woman.
As mentioned in the previous subsection, current frequency of public transport use appears to be a significant determinant in the actual knowledge model. In particular, daily public transport users have higher probability of having actual knowledge when compared to persons who occasionally use public transport. One possible reason is that public transit users make more conscious choices of their travel options. As a result, they are more susceptible to innovations and more open to other forms of public transport than the habitual car users. Consequently, they will quickly become acquainted with this new form of public transit.
Household size contributed significantly to the actual knowledge of the concept LRT. The OR for this variable shows that an additional family member will decrease the odds of actual knowledge with 29.2%. Thus, every increase in the household size significantly lowers the likelihood of actual knowledge. A similar conclusion can be drawn for the number of shopping activities, where a larger number of weekly shopping activities decreases the probability of having actual knowledge. These results are in line with expectations, since larger households and a high number of shopping activities enhance car use and consequently diminish the interest in more sustainable forms of transport, like LRT. The opposite is true for the number of bicycles in the household. Every increase in number of bicycles will increase the odds of actual knowledge with 27.0%. As noted before, bicycle ownership could be seen as a proxy for environmental awareness which increases the interest in (innovative) sustainable transport modes such as LRT.
Table 5: Models Parameter Estimates together with standard errors and OR
Parameter Overall actual knowledge Estimate S.E. OR Cognitive mismatch Estimate S.E. OR Intercept -0.46651 0.4822 / -0.6752 0.2269 / Age 18-34 35-64 65+ 0.5202 0.19861 Ref. 0.2070 0.2216 Ref. 1.6824 1.2197 Ref. -1.5357 -1.5793 Ref. 0.2936 0.2924 Ref. 0.2153 0.2061 Ref. Sex Man Woman 0.4208 Ref. 0.1453 Ref. 1.5232 Ref. 0.6642 Ref. 0.2445 Ref. 1.9429 Ref. Frequency of public transport use
Daily Weekly Monthly
Several times a year Never Ref. -0.51731 -0.43041 -1.2510 -1.4285 Ref. 0.4458 0.4463 0.4213 0.5070 Ref. 0.5961 0.6502 0.2862 0.2397 / / / / / / / / / / / / / / / Household size -0.3452 0.1293 0.7081 / / / Number of bicycles 0.2387 0.0840 1.2696 / / / Number of shopping activities -0.2637 0.1097 0.7682 / / / 1
Not significant at the 0.05 level
6. Conclusions and Policy Recommendations
In this paper, various levels of knowledge of the concept LRT in Flanders were explored. The results revealed a serious lack of knowledge of Flemish people regarding the concept of LRT. Literature (e.g. Dziekan and Dicke-Ogenia, 2010) describes that such lack of knowledge can lead to sub-optimal travel decisions which in general hamper the use of sustainable transport modes. Consequently, a successful implementation of the LRT-system in Flanders might be jeopardized and thus it is of crucial importance to raise the level of knowledge. According to literature (e.g. Beale et al., 2007; Dziekan, 2008), this can be achieved in two ways.
A first option is knowledge acquisition based on experience of the transit network. It was shown that knowledge of an unfamiliar transit system was acquired very quickly in the first days of using the system and that gaining experience will correct misperceptions. In this view, it can be a good idea to develop “travel-one-day-for-free” marketing actions when implementing the new Light Rail system in Flanders. In this way, knowledge of the Light Rail system can be enhanced.
Second, it is important to provide information to the traveler by contriving information campaigns. These campaigns are most efficient if they are fine-tuned according to the principles of market segmentation. In this view, the paper explored the socio-economic determinants of the (overall) actual knowledge and the determinants influencing a cognitive mismatch. From the models it was concluded that campaigns should target older people, larger households and households making frequent shopping trips. The latter group can for example be reached in supermarkets.
The results also showed that campaigns should focus on non-public transit users. E.g. information campaigns can be posted along the road network. Finally, information and marketing campaigns should be tailored both on males and females, since it was shown that both sexes have problems in understanding the concept LRT. How the campaigns should be constructed from an intrinsic and psychological point of view and deliberating between the methods of communication to reach the various target groups are some important considerations for further research.
References
Agresti, A. (2002). Categorical Data Analysis (sec. Ed.). John Wiley & Sons, United States.
Arentze, T., I. Bos, E. Molin and H. Timmermans (2005). Internet-based Travel Surveys: Selected Evidence on Response Rates, Sampling Bias and Reliability.
Transportmetrica, 1, 193-207.
Beale, J.R. and P.W. Bonsall (2007). Marketing in the Bus Industry: A Psychological Interpretation of some Attitudinal and Behavioral Outcomes. Transportation Research Part F, 10, 271-287.
Bonsall, P., P. Firmin and J. Beale (2004). Perceptions of Modal Attributes: How Accurate and How Susceptible to Change? Presented at the 83rd Annual Meeting of the Transportation Research Board, Washington, D.C..
Brög, W., E. Erl, and N. Mense (2002). Individualized Marketing: Changing Travel Behavior for a better Environment. Paper presented at the OECD Workshop: Environmentally Sustainable Transport, Berlin.
Chorus, C.G., T.A. Arentze and H.J.P. Timmermans (2007). Information Impact on Quality of Multimodal Travel Choices: Conceptualizations and Empirical Analyses.
Transportation, 34, 625-645.
Cools, M., E. Moons, D. Janssens and G. Wets (2009). Shifting towards Enivronment-Friendly Modes: Profiling Travelers Using Q-methodology.
Transportation, 36, 437-453.
Cools, M., K. Declercq, D. Janssens and G. Wets (2010). Onderzoek Verplaatsingsgedrag Vlaanderen 4.2 (2009-2010): Tabellenrapport (Travel Behavior Research Flanders 4.2 (2009-2010): Table report). Hasselt University, Diepenbeek, Belgium.
Couper, M.P., A. Kapteyn, M. Schonlau and J. Winter (2007). Noncoverage and Nonresponse in an Internet Survey. Social Science Research, 36, 131-148.
Creemers, L., M. Cools, H. Tormans, P.J. Lateur, D. Janssens and G. Wets (2012). Identifying the Determinants of Light Rail Mode Choice for Medium/Long Distance Trips: Results from a Stated Preference Study. Forthcoming in Transportation Research Record: Journal of the Transportation Research Board, Washington, D.C..
Cronin, J.J and R. Hightower (2004). An Evaluation of the Role of Marketing in Public Transit Organizations. Journal of Public Transportation, 7, 17-36.
De Lijn (2002). Regionet Limburg. Regionaal Openbaar Vervoer in de Provincie Limburg. Conceptstreefbeeld. Vervoersmaatschappij De Lijn, Mechelen, Belgium.
Diana, M. and P.L. Mokhtarian (2009). Grouping Travelers on the Basis of their Different Car and Transit Levels of Use. Transportation, 36, 455-467.
Diana, M. and C. Pronello (2010). Traveler Segmentation Strategy with Nominal Variables through Correspondence Analysis. Transport Policy, 17, 183-190.
Dziekan, K. (2007). Learning an Unfamiliar Public Transport System: an In-depth Study from the User Perspective in Stockholm. Royal Institute of Technology, Stockholm, Sweden.
Dziekan, K (2008). What do People Know about their Public Transport Options? Investigating the Memory Representations of Public Transport through Telephone Interviews in a Residential Area of Stockholm, Sweden. Transportation, 35, 519-538.
Dziekan, K. and M. Dicke-Ogenia (2010). Reducing Uncertainty and Supporting Cognitive Maps in Travel Information for Public Transport. World Review of Intermodal Transportation Research, 3, 73-90.
Fan, W. and Z. Yan (2010). Factors Affecting Response Rates of the Web Survey: A Systematic Review. Computers in Human Behavior, 26, 132-139.
Guiliano, G. and S. Hayden (2005). Marketing Public Transport. In: Hensher, D., Button, K.J., Handbooks in Transport, Pergamon Press, Oxford.
Guo, Z. (2011). Mind the Map! The Impact of Transit Maps on Path Choice in Public Transit. Transportation Research Part A, 45, 625-639.
Hart, N., N. E. Lownes and E. Jackson (2012). Analysis of a Method for Bias Reduction in Electronic Travel Surveys. Presented at the 91th Annual meeting of the Transportation Research Board, Washington, D.C..
Molenberghs, G and G. Verbeke (2005). Models for Discrete Longitudinal Data.
Springer, United States.
NIS. Structure of the Population by Age and Gender (2010). Available at: http://statbel.fgov.be/nl/modules/publications/statistiques/bevolking.
Rose, G. and E. Ampt (2001). Travel Blending: an Australian Travel Awareness Initiative. Transportation Research Part D, 6, 95-110.
SAS Institute Inc (2011). SAS/STAT 9.3 User’s Guide – The GENMOD Procedure.
Cary, NC: SAS Institute Inc, USA.
Shiftan, Y., M.L. Outwater and Y.S. Zhou (2008). Transit Market Research Using Structural Equation Modeling and Attitudinal Market Segmentation. Transport Policy, 15, 186-195.
Sperry, B.R., S. Larson, D. Leucinger, S. Janowiak, and C. A. Morgan (2012). Design and Implementation of an Internet-Based Traveler Intercept Survey. Presented at the 91th Annual meeting of the Transportation Research Board, Washington, D.C..
Smith, C. and G. Spitz (2010). Internet Access: Is Everyone Online Yet and Can We Survey Them There? Transportation Research Record: Journal of the Transportation Research Board, Transportation Research Board of the National Academies, Washington, D.C., 2176, 12-20.
Varinia (2008). Ontwerpstreefbeeld Spartacus Sneltramlijn 1. Vervoersmaatschappij De Lijn, Hasselt, Belgium.
Wright, K.B. (2005). Researching Internet-Based Populations: Advantages and Disadvantages of Online Research, Online Questionnaire Authoring Software Packages, and Web Survey Services. Journal of Computer-Mediated Communication,