Content-Based Retrieval of Technical Drawings
Manuel J. Fonseca
Alfredo Ferreira
Joaquim A. Jorge
Department of Information Systems and Computer Science
INESC-ID/IST/Technical University of Lisbon
R. Alves Redol, 9, 1000-029 Lisboa, Portugal
mjf@inesc-id.pt, afj@immi.inesc-id.pt, jorgej@acm.org
Abstract
This paper presents a new approach to classify, index and retrieve technical
draw-ings by content. Our work uses spatial relationships, shape geometry and
high-dimensional indexing mechanisms to retrieve complex drawings from CAD
databa-ses. This contrasts with conventional approaches which use mostly textual metadata
for the same purpose.
Creative designers and draftspeople often re-use data from previous projects,
publications and libraries of ready-to-use components. Usually, retrieving these
drawings is a slow, complex and error-prone endeavor, requiring either exhaustive
visual examination, a solid memory, or both. Unfortunately, the widespread use of
CAD systems, while making it easier to create and edit drawings, exacerbates this
problem, insofar as the number of projects and drawings grows enormously, without
providing adequate searching mechanisms to support retrieving these documents.
We describe an approach that supports automatic indexation of technical drawing
databases through drawing simplification, feature extraction and efficient algorithms
process to content-based retrieval of technical drawings (CAD) and present results
from usability tests on our prototype.
keywords: Content-Based Retrieval, High-Dimensional Indexing, Graph Spectra, Po-lygon Detection, Feature Extraction
1
Introduction
Present–day CAD applications provide powerful tools to create and edit vector drawings in several domains, such as architecture, mechanics, automobile industry or mould indus-try. Even though reusing past drawings is common practice in such domains, there are almost no developed mechanisms to support this activity in an automated manner. Thus, it becomes important to develop new systems to support automatic classification and re-trieval of technical drawings based on their contents, rather than relying solely on textual annotations or metadata for such purposes.
Some studies [1] refer that project libraries with old case studies are crucial to help designers identify relevant features to include or problems to avoid in new designs. Addi-tionally, in some design firms, designers often work by making or copying diagrams from colleagues in their design team for further development [2]. Furthermore, during task analysis performed in the context of ongoing research projects [3] in informal conver-sations with draftspeople, we found out that industrial designers often include elements from libraries of ready-to-use components. Moreover, they also re-use old drawings dur-ing the creation phase of a new project, to get at ideas or review insights from previous problems and their solutions.
Even though reusing drawings often saves time, manually searching for them is usu-ally slow and problematic, requiring designers to browse through large and deep file directories or navigate a complex maze of menus and dialogs for component libraries.
Moreover, CAD systems while making the creation of new drawings easier, exacerbate the retrieval problems, because they do not provide adequate search mechanisms. Indeed, present-day CAD systems rely on conventional database queries and direct-manipulation to retrieve information. Some solutions to this problem use textual databases to organize the information [4, 5]. These classify drawings by keywords and additional informa-tion, such as designer name, style, date of creation/modification and a textual description. However, solutions based on textual queries are not satisfactory, because they force the designers to know in detail the meta-information used to characterize drawings. Worse, these approaches also require humans to produce such information when cataloging data. Moreover, textual description is not adequate to describe layout, shape and topology [6], suffers from low term agreement across indexers [7] and also between indexers and user queries [8, 9].
In contrast to the textual organization, we propose a visual classification scheme based on shape geometry and spatial relationships, which are better suited to this problem, be-cause they take advantage of designers visual memory and explore their ability to sketch as a query mechanism. These are combined with an indexing method that efficiently sup-ports large sets of CAD data, new schemes that allow us to hierarchically describe figures by level of detail and graph-based techniques to compute descriptors for such drawings in a form suitable for machine processing.
The rest of this paper is organized as follows: Section 2 provides an overview of re-lated work in based retrieval. In Section 3 we describe our approach for content-based retrieval of visual information. Section 4 explains in some detail, our automatic classification process. In Section 5 we present experimental results from preliminary tests with users. While at the time of this writing we are still conducting tests, the results ob-tained so far are very encouraging and establish the validity of our method. We conclude the paper by discussing our conclusions and present directions for further research.
2
Related Work
Recently there has been considerable interest in querying Multimedia databases by con-tent. However, most such work has focused on image databases as surveyed by Shi-Kuo Chang [10]. Moreover, in [11], the author analyzes several image retrieval systems that use color and texture as main features to describe image content. On the other hand, draw-ings in electronic format are represented in structured form (vector graphics) that requires different approaches from image-based methods, which resort to color and texture as the main features to describe image content. Some initial work [4, 5] attempted to index technical drawings through textual databases. However, these fail to use the rich visual association mechanisms and designer’s use of sketches to recover information.
Gross’s Electronic Cocktail Napkin [12, 2, 13] addressed a visual retrieval scheme based on diagrams, to indexing databases of architectural drawings. Users draw sketches of buildings, which are compared with annotations (diagrams), stored in a database and manually produced by users. Even though this system works well for small sets of draw-ings, the lack of automatic indexation and classification makes it difficult to scale the approach to large collections of drawings.
The S3 system [14] supports managing and retrieving industrial CAD parts, described using polygons and thematic attributes. It retrieves parts using bi-dimensional contours drawn using a graphical editor or sample parts stored in a database. S3 relies exclu-sively on matching contours, ignoring spatial relations and shape information, making this method unsuitable for retrieving complex multi-shape drawings.
Park describes an approach [15] to retrieve mechanical parts based on the dominant shape. Objects are described by recursively decomposing its shape into a dominant shape, auxiliary components and their spatial relationships. The small set of geometric primitives and the not so efficient matching algorithm makes it hard to use with large databases of drawings.
M¨uller and Rigoll presented a novel approach [16] to the retrieval of engineering drawings based on the use of stochastic models. Engineering drawing DBs can be searched using sketches or shapes which represent details in drawings of mechanical parts. They represent drawings and queries using a pseudo 2-D Hidden Markov Model with filler models. Their approach aims to retrieve images containing certain details and locate these details in the retrieved images. Their method only allows specifying simple queries, rep-resenting a single element. More complex queries including several elements with spatial relationships between them are not contemplated. Moreover, the search mechanism is not appropriated for large collections of drawings, since they perform a sequential scan through the database comparing the query with all indexed drawings.
Leung and Chen proposed a sketch retrieval method [17] for general unstructured free-form hand-drawings stored in the form of multiple strokes. They use shape infor-mation from each stroke exploiting the geometric relationship between multiple strokes for matching. Their approach then computes a matching score between the query and each sketch in the database. More recently, the authors improved their system by also considering spatial relationships between strokes [18]. However, this approach has two drawbacks. First, they use a small number of basic shapes (circle, line and polygon) to classify strokes. Second, their approach can not deal with large databases of drawings, since they compare the query with all the drawings in the database.
Nabil et al. [19] presented a set of techniques for similarity retrieval based on the 2D Projection Interval Relationships representation (2D-PIR), including methods for dealing with rotated and reflected images. 2D-PIR is a symbolic representation of directional as well as topological relationships among spatial objects. It adapts three existing represen-tation formalisms and combines them in a novel way to produce a unified represenrepresen-tation of pictures. Authors claim that their method offers more information about spatial re-lationships between objects in a picture than traditional methods. However, during the matching process the symbolic representation of the query gets compared to all the
sym-bolic representations stored in the database, making this work difficult to scale up for large collections of images.
Funkhouser et. al. [20] describe a method for retrieving 3D shapes using sketched contours. However, their approach relies on silhouettes and their fitting to projections of 3D images, unlike our method which is based on structural matching of graphical constituents using both shape and spatial relations.
Brucale et al [21] describe the use of size functions to describe and search simple image datasets using hand-sketches as queries. Size functions are a relatively new class of shape descriptors, based on geometric-topological theory of critical points.
Shock trees [22] are another method to describe and compare shapes. Pelillo pre-sented a solution to matching two shock trees by constructing the association graph [23]. Authors illustrate the power of this approach by matching articulated and deformed shapes described by shock trees. Shokoufandeh et al developed another approach to perform shock tree matching based on graph spectrum and Voronoi diagrams [24]. While these approaches use trees (graphs) to describe the contour of simple shapes, we use graphs to represent the spatial structure of complex drawings.
More recently Shokoufandeh et al presented a framework for shape matching through scale-space decomposition of 3D models [25]. Their algorithm is based on efficient hier-archical decomposition of metric data using its spectral properties. 3D objects are mapped into rooted trees, thus recasting the problem of finding a match between 3D models as the much simpler technique of comparing rooted trees.
Looking at the majority of the existing content-based retrieval systems for drawings or technical drawings, we can observe two things. First, most published works use databases with few elements (less than 100). Second, drawings stored in the database are simple elements not representing sets of real technical drawings.
since we aim to retrieve technical CAD drawings and privilege the use of spatial relation-ships and dominant shapes. Indeed, our method is more ambitious in the sense that we do automatic simplification, classification and indexation of existing drawings, to make the retrieval process both more effective and accurate. These activities imply specifying a de-scription mechanism to describe technical drawings and sketched queries. Additionally, fast and efficient algorithms to perform similarity matching between sketched queries and a large database of technical drawings are required, which we will describe in the follow-ing sections.
3
Our Approach to Content-Based Retrieval
Our approach solves these problems by developing a mechanism for retrieving techni-cal drawings, in electronic format, through hand-sketched queries, taking advantage of designer’s natural ability at sketching and drawing. Moreover, our approach, unlike the majority of systems cited in the previous section, was developed to support large sets of drawings. To that end, we developed a multidimensional indexing structure that scales well with growing data set size.
Figure 1 presents a very detailed diagram of our system architecture, identifying its main components, which we describe in the next subsections.
3.1
Classification
Content-based retrieval of pictorial data, such as digital images, drawings or graphics, uses features extracted from the corresponding picture. Typically, two kinds of features are used; visual features (such as color, texture and shape) and relationship features (topo-logical and spatial relationships among objects in a picture). However, in the context of our work, vectorial drawings, color and texture are irrelevant features and only topological
Classification Simplification Drawings Database Query Simplification Topology Graph Topology
Extraction ComputationDescriptor DescriptorTopology TopologicalQuery
Geometry Descriptor Geometry
Extraction GeometricQuery
Geometry Descriptors Geometry Extraction Insertion Topology Graph Topology Extraction Descriptors Computation Topology Descriptors Insertion Matching NB-Tree Geometry Drawing IDs Mapping IDs to Drawings NB-Tree Topology Similars by Topology Refine Query Candidate Drawings Sketched Query Interface Drawings
Figure 1: Detailed architecture for our approach.
relationships are considered to make our approach less restrictive.
Our classification process starts by applying a simplification step, where most useless shapes are eliminated. Most technical drawings contain detailed descriptions of objects, which are not necessary for a visual search and increase the cost of searching. We try to remove visual details (i.e. small-scale features) while retaining the perceptually dominant elements and shapes in a drawing. The main goal of this step is to reduce the number of entities to analyze in subsequent steps of the classification process.
After simplification we divide the drawing into dominant blocks (polygons) that may also be divided recursively into smaller blocks. This hierarchy of blocks will be later used to extract shape and topological information from the drawing. We only use two topo-logical relationships, Inclusion and Adjacency. While these relationships are weakly discriminating, they do not change with rotation and translation. After this recursive decomposition we combine shape information and topological relationships into a topol-ogy graph for later use in computing topological descriptors. Figure 2 illustrates the two
1 3 2 4 5 6 7 8 9 0 7 1 2 3 4 5 6 8 9 Adjacency Inclusion
Figure 2: Polygon isolation (left) and correspondent topology graph (right).
steps mentioned before, polygon isolation and topological relationship extraction (topol-ogy graph).
We do not store graphs in a database for the purpose of searching similar drawings, since graph matching is a NP-complete problem, we use graph spectra instead. For each topology graph to be indexed in a database we compute descriptors based on its spectrum [26]. To support subgraph matching, we also compute descriptors for subgraphs of the main graph. Moreover, we use a new multilevel description scheme that divides drawings into different levels of detail and then computes descriptors at each level. Combining descriptors from subgraphs and at different levels of detail, provides a powerful way to describe and search both for complete drawings or subparts of these, a desirable feature.
To compute the graph spectrum we start by determining the eigenvalues of its adja-cency matrix. The resulting descriptors are multidimensional vectors, whose dimension depends on graph (and its corresponding drawing) complexity. Very complex drawings will yield descriptors with high dimensions, while simple drawings will result in descrip-tors with low dimensions.
To acquire geometric information about drawings we use a general shape recognition library able to identify a set of geometric shapes and gestural commands called CALI [27]. This enables us to use either drawing data or sketches as input, which is a desirable feature of our system, as we shall see later on. In our approach instead of using CALI to recognize a shape or a gestural command from polygons, we compute a set of geometric features
such as area and perimeter ratios from special polygons such as the convex hull, the largest area triangle inscribed in the convex hull or the smallest area enclosing rectangle among others. Using geometric features instead of polygon classifications, allows us to index and store potentially unlimited families of shapes. We obtain a complete description of geometry in a drawing, by applying this method to each polygon of the drawing and as a result we get a multidimensional feature vector that describes its geometry. The geometry and topology descriptors thus computed are inserted in two different indexing structures, one for topological information and another for geometric information, respectively.
3.2
Query
Our system includes a Calligraphic Interface [28] to support the specification of hand-sketched queries, to supplement and overcoming the limitations of conventional textual methods. The query component performs the same steps as the classification process, namely simplification, polygon isolation, topological and geometric feature extraction, topology graph creation and descriptor computation. However, for topological informa-tion, we only generate a descriptor for the whole sketch, using it to query the topology indexing structure. The geometry descriptors are used to refine the query and select the more similar drawings from a list of candidates returned by the topological query.
3.3
Indexing
Since we need to index most subgraphs of a given graph to allow for subgraph matching, indexing hundreds to thousands of technical drawings yields a large database comprising tens of thousands or potentially hundreds of thousands of descriptors. Thus, at the core of our approach, we need to develop efficient indexing structures for storing descriptors. Such indexing mechanisms should minimize the number of false positives that have to be tested by a similarity search. However, indexing should not discard any relevant
draw-ings. Good indexing methods should also be dynamic, allowing on-line insertion and removal of descriptors and should scale well with growing data set sizes. Furthermore, the indexing structure should support data points of variable dimension, since descriptors have different dimensions and we do not know in advance the maximum dimension that they can achieve. To support approximate matches, the indexing structure needs to sup-port a fast and reliable K nearest-neighbors scheme, since most interesting candidates will probably yield approximate matches to the query. However, nearest neighbor search in high-dimensional data spaces is a difficult problem.
We developed a new multidimensional indexing structure, the NB-Tree [29, 30], that satisfies the requirements enumerated before, providing us with an efficient index-ing mechanism for high–dimensional data points of variable dimension. The NB-Tree is a simple, yet efficient indexing structure for high–dimensional data points of variable dimension, using dimension reduction. It maps multidimensional points to a 1D line by computing their Euclidean Norm. In a second step we sort these points using a B+-Tree on
which we perform all subsequent operations. Moreover, we exploit B+-Tree efficient
se-quential search to develop simple, yet performant methods to implement point, range and nearest-neighbor queries.
3.4
Matching
Computing the similarity between a hand-sketched query and all drawings in a database can entail prohibitive costs especially when we consider large sets of drawings. To speed up searching, we divide our matching scheme in a three-step procedure as shown in Fig-ure 3. The first step searches for topologically similar drawings, working as a first filter to avoid unnecessary geometric matches between false candidates. In the second step we use geometric information to further refine the set of candidates. Finally, we apply a com-parison method to get a measure of similarity between the sketched query and drawings retrieved from the database.
Search by
Topology Refine usingGeometry AlgorithmSimilarity
Query CandidateDrawings
Figure 3: Block diagram for the matching process.
Our matching procedure first ranks drawings in the database according to topological similarity to the sketched query. This is accomplished performing a KNN query to the topology indexing structure, using the descriptor computed from the sketched query. Re-sults returned by the indexing structure represent a set of descriptors similar (near in the space) to the query descriptor. Each returned descriptor correspond to a specific graph or subgraph stored in the topology database, which will be used in the geometry matching. This first filter based on topology reduces drastically the number of drawings to compare, selecting only drawings with a high probability of being similar to the sketched query.
4
From Drawings to Descriptors
We will now describe with more detail the steps of the classification component. Draw-ings get processed through a set of stages until they are mapped into two feature vectors, one topological and one geometric. First, we simplify drawings by eliminating useless polygons and lines. Then we extract polygons and compute geometry and topology rela-tionships among them. After, these data are combined into a topology graph, from which we compute a set of descriptors using spectral information, to insert them into the main indexing structure (see Figure 4).
Drawing Descriptor
Line Segment Intersections
Removal
Line Set
Simplification DetectionPolygon SimplificationPolygon Set
Topological and Geometric
Feature Extraction
Topology
Graph Creation ComputationDescriptor
4.1
Line and Polygon Simplification
Our approach includes two drawing simplification steps. First we simplify vector infor-mation. Then we extract and simplify a set of polygons from these lines.
To simplify the initial set of lines we first apply a snap rounding algorithm. This is a well known method that creates fixed-precision sets of line segments from arbitrary-precision vectors. In our approach we use this method not only to ensure a finite-arbitrary-precision approximation to the original drawing, but also to produce a simplified version, where small segments are discarded.
The algorithm described herein uses the method recently proposed by Haperin and Pecker in [31], which is based on the method presented by Goodrich, Guibas, Hershberger and Paul Tanenbaum in [32]. Either approach preserve the topological properties of the original line segments, which is important for our content-based retrieval approach. After snap rounding and intersection removal our algorithm identifies line segments that are not part of any polygon. These are line segments whose endpoints do not coincide with any other segment extremities. These segments are then discarded.
Polygon simplification aims to discard small polygons, which are usually irrelevant to the description of the drawing. A polygon is considered small if either its area or bounding box fall below given thresholds. Such polygons which are not adjacent to any others get removed.
When small polygons are adjacent to other polygons it is necessary to analyze the context where they lie. If a small polygon is inside and adjacent to other polygon it can be simply discarded. If it is both outside and adjacent, then both polygons are merged. This avoids discarding sets of adjacent small polygons. When several polygons are adjacent to a small one, we merge the two that cause the least change in geometric properties.
4.2
Polygon Identification
Our algorithm for polygon detection is divided in five major steps. First, we convert the initial drawing or sketch in a set of line segments and simplify those. Second, we detect line segment intersections and remove them by replacing intersected segments by their subsegments that contain no intersections. The third step creates a graph induced by the non-intersecting line segments, where nodes represent endpoints or proper intersection points of original line segments and edges represent its subsegments. The fourth step computes the Minimum Cycle Basis (MCB) of the induced graph. Finally, we construct a set of polygons from cycles in the MCB and discard small polygons.
In the remainder of this section we describe in-depth all these steps and discuss how they convert line segments into polygons, while a detailed description of used algorithms can be found in [33].
4.2.1 Conversion to lines
A technical drawing or a sketch is usually stored in vector format, using primitives such as lines, polylines, arcs and others. However, this plethora of entities is not supported by simpler algorithms, designed to work polylines. In our approach we convert all such entities to sets of lines. In this way, any drawing or sketch is transformed into a set of line segments.
4.2.2 Intersection Removal and Graph Construction
In a vectorial drawing composed by line segments there may exist many intersections be-tween these segments (see Figure 5.a). To detect polygonal shapes we have to remove proper segment intersections, thus creating a new set of lines in which any pair of seg-ments share at most one endpoint. To that end, we start by detecting all intersections between line segments in a plane. The solution devised by Bentley and Ottmann to this
Figure 5: a) SetΦof line segments. b) GraphGinduced byΦ.
problem in 1979 [34] is still widely used after more than 20 years in many practical im-plementations because it is both easy to understand and implement [35, 36].
To find and remove intersections, we use a robust and efficient implementation of the Bentley-Ottmann algorithm, described by Bartuschka, Mehlhorn and Naher [37]. This computes the planar graphGinduced by a set of line segmentsΦ(see Figure 5.b). In this implementation, vertices ofG represent endpoints and proper intersection points of line segments in Φ. The edges ofG constitute the maximal relatively open subsegments of lines inΦthat do not contain any vertices ofG. The major drawback of this method lies in that parallel edges are generated in the graph for overlapping segments. However, Φ
contains no such segments, since they were already removed during line set simplification.
4.2.3 MCB Finding and Polygon Detection
Detecting polygons is similar to finding cycles on the induced graphG. Unfortunately, the total number of cycles in a planar graph can grow exponentially with the number of vertices [38]. Therefore, it is not feasible to detect all polygons that can be constructed from a set of lines. Our method, detects the minimal polygons. These have a minimal number of edges and cannot be constructed by joining any other minimal polygons.
Figure 6: a) Minimum Cycle BasisΓof graphG. b) SetΘof polygons detected fromΦ.
presented the first known polynomial-time algorithm to find the MCB of a graph in 1987 [39, 40]. While asymptotically better solutions have been published, we decide to use it, since Horton’s algorithm is both simple and usable for our needs. Figure 6.a shows an example of cycle basisΓ, resulting from applying Horton’s algorithm to graphGas shown in Figure 5.b. From the MCB previously computed and using the geometric information stored on each node of the graph, we construct a setΘof polygons. Figure 6.b presents the resulting polygons thus identified.
Applying these algorithms leads to a set of polygons with the smallest number of edges. However, for our approach we do not need such minimal polygons. We rather prefer to have predictably consistent results by applying the method to similar inputs as shown in Figure 7, where the two examples presented illustrate two different results for apparently similar situations. In one case (top) we have adjacency between polygons while on the other case (bottom) we have inclusion. To overcome this we developed an heuristic that privileges adjacency between polygons, by avoiding inclusion of adjacent
shapes (Figure 7 bottom right).
After isolating polygon, we extract a set of topological relationships among identi-fied polygons into a topology graph (see Figure 2 right), where each node represents a polygon, while links represent topological relationships.
4.3
Topology Graph
Content-Based Retrieval systems use information extracted from objects and spatial rela-tions between them. Thus spatial information presented in drawings should be preserved during the classification process so that users can easily retrieve those from the database.
Spatial relationships may be classified into directional and topological relations. The most frequently used directional relationships arenorth,south,east,west, north-east,northwest,southeastandsouthwest. For topological relationships Egen-hofer [41, 42] presented a set of eight relations between two planar regions, namely
disjoint,contain,inside,meet,equal,cover,covered-byandoverlap, as illustrated in Figure 8.
Disjoint Meet Contain
Inside
Overlap Cover
Covered By Equal
Figure 8: Topological relationships.
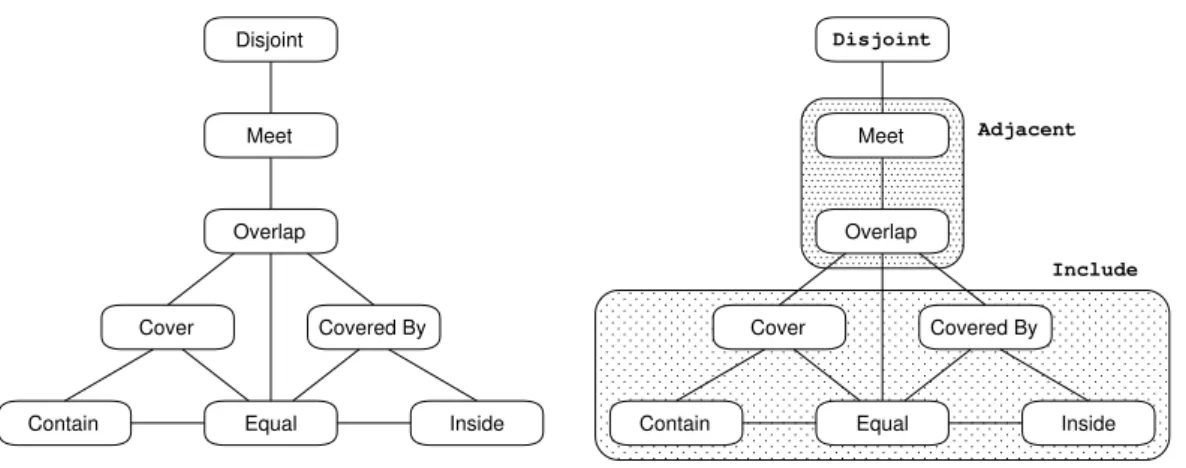
We decided to restrict topological relationships to those that are independent of trans-lations and rotations of drawings, and directional retrans-lationships do not guarantee that. Moreover, to both make our approach less restrictive and the topology graph simpler, we simplified the topological relationships defined by Egenhofer. Starting from his neighbor-hood graph for topological relationships, depicted in Figure 9 (left) as described in [42].
Contain Disjoint Overlap Meet Covered By Inside Cover Equal Contain Disjoint Overlap Meet Covered By Inside Cover Equal Adjacent Include
Figure 9: Topological relationships originally defined by Egenhofer (left) and our simpli-fied version (right).
Our set of topological relationships groups neighbor relations, yielding three topological relationships between two polygons -disjoint,includeandadjacent(see Fig-ure 9 (right)). Topological relationships extracted from drawings are then compiled in a Topology Graph, where ”vertical” edges mean include and ”horizontal” connections meanadjacent(see Figure 2).
4.4
Descriptor Computation
Graph isomorphism is a well-known NP-complete problem. In order to avoid computing the isomorphism between topology graphs, we reduce this problem to the computation of distances between descriptors. Topology graphs get mapped into a multidimensional vector. It is in this n-space that we perform nearest neighbor queries to find associated similar graphs. In this manner, topology alone is used as a discriminating index to reduce the number of candidate results.
In the remainder of this subsection, we present a new approach to describe drawings using topology graphs, graph spectra (eigenvalues) and levels of detail.
0 1 2 3 4 5 0 7 1 2 3 4 5 6 8 0 7 1 2 3 4 5 6 8 9 1 3 2 4 5 6 7 8 9 1 3 2 4 5 6 7 8 1 3 2 4 5
Figure 10: Different levels of detail and the correspondent graphs.
4.4.1 Multilevel Description
Our multilevel approach is based on topology graphs. These get divided into different levels, where each level corresponds to a specific degree of detail. Figure 2 shows a sample drawing and its topology graph. Using multilevel descriptions, we can identify three different graphs, as illustrated in Figure 10. As we can see, each graph corresponds to a specific degree of detail from the drawing. If we compute a descriptor for each of the three graphs, we end up with three different ways to search for the current drawing, using more or less detailed information about the drawing. This approach has the merit to allow classifying subparts of drawings by computing descriptors for the corresponding
3 6 7 8 7 3 6 8 3 6 7 8 9 7 3 6 8 9
subgraphs of the main graph. Figure 11 illustrates the subgraphs thus extracted and their corresponding part of the drawing. We recursively apply the description by levels of detail to these subgraphs. The result of this process is a set of graphs and subgraphs that describe both the topology at different levels of detail and the different subparts of a drawing.
4.4.2 Graph Spectrum
Spectra [26] are used to convert graphs into vector descriptors that can be manipulated using a multidimensional indexing structure. The spectrum of a graph is calculated from the eigenvalues of its adjacency matrix.
According to [26, 24] the use of eigenvalues (spectrum) of a graph as an indexing method is valid since (1) it captures local topology, (2) is invariant to subgraph re-order and (3) is stable, since small changes in the graph produce little changes in its spectrum. However, resulting descriptors are not unique. More than one graph can have the same spectrum, which gives rise to collisions similar to these in hashing schemes. In [24] authors argue that these collisions occur rather infrequently, a claim seemingly verified by our experiments.
Topology Graph Adjacency Matrix Eigenvalues Topology Descriptor A B C D E 0.25 0.68 -0.51 0.95 -0.74 [0.95, 0.74, 0.68, 0.51, 0.25] E A B C D A B C D E 0 1 1 1 0 1 0 1 0 0 1 1 0 0 0 1 0 0 0 1 0 0 0 1 0
Figure 12: Block diagram for topology descriptor computation.
Figure 12 presents the block diagram for computing the topology descriptor. First we compute the adjacency matrix of the graph, second we compute its eigenvalues and finally we sort the absolute values to obtain the topology descriptor. Adjacency matrices are symmetric, assuring that eigenvalues are always real.
Experimental Comparison
While previous work by Shokoufandeh et al. [24] is also based on eigenvalues, they sums these to reduce the dimension of data rather than using eigenvalues by themselves. This is because efficient indexing structures for high dimensional data points were not used, which make neighbor queries rather expensive, degenerating into sequential search for high-dimensional data.
We performed experimental tests to compare our approach to Shokoufandeh’s. To that end we first create a small set of similar topology graphs with little differences from each other. In a second step, we randomly generated 100,000 topology graphs and then computed descriptors for each using both methods (this time we did not compute descrip-tors either by levels of detail or for each subgraph). We inserted the resulting descripdescrip-tors into two different indexing structures (one for each method). From the set of original graphs we selected one at random to be used as query and computed the corresponding descriptor. Then, we used this descriptor to perform a KNN query (K = 10) to both indexing structures (using the Euclidean distance) and analyzed results. Experimental ev-idence reveals that using the sum of eigenvalues yields higher collision frequency than when we use the eigenvalues themselves. Further, precision performance is higher for our method. In our approach nine out of ten neighbors retrieved from the set of 100,000+ graphs belong to the original set, whereas in the case of the sum of eigenvalues only seven ”correct” descriptors were recovered.
Still, it is important to note that the use of all eigenvalues do not assure the unity of descriptors, i.e. we can have different graphs with the same descriptor. However there seem to be less collisions than using Shokoufandeh’s approach.
5
Evaluation and Experimental Results
As previously discussed, content-based retrieval of drawings comprises two phases. We have described Classification, which analyzes and converts drawings into logical descrip-tors. In Matching we try to find similar drawings within a set of such descripdescrip-tors. Whereas the critical step in classification (using our approach) is polygon detection from a set of lines, in matching nearest neighbor search dominates the resources consumption.
In the next subsections we present experimental results for our polygon detection algorithm, shape representation, indexing structure and query processes.
5.1
Polygon Detection
Our polygon detection algorithm was tested on a Intel Pentium III @ 1GHz running Win-dows XP and with 512MB of RAM. We tested the algorithm using sets of line segments from simple test drawings, technical drawings of mechanical parts and hand sketches. Ta-ble 1 summarizes the results from these tests. The complexity of a drawing is defined by the number of lines that compose it, after converting arcs, circles and polylines into line segments.
Number of Lines 6 36 167 286 518 872 2507 Time (Sec) 0.01 0.05 4 9 37 129 1333 Table 1: Time needed to identify polygons as a function of number of lines.
From these results we can conclude that performance is acceptable for on-line pro-cessing in sets with less than three hundred lines, which is the case of hand-sketched queries or small-size technical drawings. For drawings with a number of lines around 2500, the algorithm will take more than twenty minutes to detect all polygons. How-ever, this approach remains a viable solution if we consider batch processing for indexing medium to large-size technical drawings.
5.2
Indexing Structure
In this section we shortly describe experimental comparison of our indexing structure (NB-Tree) to the most popular approaches available, such as the SR-Tree [43], the A-Tree [44] and the Pyramid Technique [45]. All experiments were performed on a Intel Pentium II @ 233 MHz running Linux 2.4.8 and with 384 MB of RAM. More detailed reports can be found in [29, 30].
Figure 13.a depicts the performance of nearest neighbor searches for synthetic data sets of uniformly distributed data points, when data dimension increases. We can see that the NB-Tree outperforms all the structures evaluated, for any characteristic dimension of the data set. Moreover, we can notice that the NB-Tree shows linear behavior with the dimension (with a low multiplicative factor) while the SR-tree and the A-Tree seems to exhibit at least quadratic growth or worse. Figure 13.b shows that the NB-Tree also outperforms all the surveyed structures for K-NN queries when the size of the data set increases.
We also evaluated our indexing structure in two more experiments where we tried to simulate our domain of application. To that end, instead of generating descriptors, we generated topology graphs and we computed the corresponding descriptors. First, we
0 5 10 15 20 25 0 50 100 150 200 250 300 Time (sec) Dimension NB-Tree SR-Tree Pyramid A-Tree 0 5 10 15 20 25 30 250000 500000 750000 1e+06 Time (sec) Dataset Size NB-Tree SR-Tree Pyramid
a) Data set size of 100,000 points b) Data points of dimension 20
randomly generated 100,000 topology graphs. Then, we computed descriptors for those graphs using our multilevel scheme (i.e. we compute descriptors for subgraphs and for different levels of detail) and not using it (i.e. one descriptor for each topology graph). Table 2 summarizes the results for a KNN query with K = 10. The times presented in the table are average figures obtained from performing 100 KNN queries.
Descriptor Type No of Descriptors Max. Descriptor Dimension Time
Without levels 100,000 333 0.05 Sec With levels 1,524,000 333 1.25 Sec
Table 2: Search times for descriptors generated from topology graphs.
Table 2 shows that our indexing scheme outperforms current approaches for many data distributions. Our indexing structure seems to scale better both with growing dimen-sionality and data set size, while exhibiting low insertion and search times, making it a good choice for interactive applications where timely feedback is required.
5.3
Shape Representation
In order to evaluate the retrieval capability (i.e. accuracy) of our method, we measured recall and precision performance figures using calibrated test data. Information Retrieval defines recall as the percentage of similar drawings retrieved with respect to the total number of similar drawings in the database. Conversely, precision is the percentage of similar drawings retrieved with respect to the total number of retrieved drawings.
We compared our method to describe shapes (CALI) with four other approaches, namely Fourier descriptors (FD), grid-based (GB), Delaunay triangulation (DT) and Touch-point-vertex-angle-sequence (TPVAS). To that end we used results of an experiment pre-viously performed by Safar [46], where he compared his method (TPVAS) with the FD, GB and DT methods. In that experiment, authors used a database containing 100 contours
0 10 20 30 40 50 60 70 80 90 100 0 10 20 30 40 50 60 70 80 90 100 Precision Recall CALI GB DT FD TPVAS
Figure 14: Recall-Precision comparison.
of fish shapes2. From the set of 100 shapes in the database, five were selected randomly as queries. Before measuring the effectiveness of all methods, Safar performed a per-ception experiment where users had to select (from the database) the ten most similar to each query. This yielded the ten most perceptually similar results that each query should produce.
We repeated this experiment, using the same database and the same queries, using our method. First, we computed descriptors for each of the 100 shapes in the data set and inserted them in our indexing structure (NB-Tree). Then for each query, we computed the correspondent descriptor and used it to perform a nearest-neighbor search in the NB-Tree. Returned results are in decreasing order of similarity to the query. For each of the five queries, we determined the positions for the 10 similar shapes in the ordered response set. Using results from our method and the values presented in Table 2 from [46] we derived the precision-recall plot shown in Figure 14.
Looking at Figure 14 we can see that our technique outperforms all the other methods, yielding good precision figures for recall values up to 50%.
Figure 15: Sketch-Based Retrieval prototype.
5.4
Drawing Retrieval
Using the techniques described in this paper, we have developed a prototype to retrieve technical drawings. Our system allows retrieving sets of drawings similar to a hand-sketched query. Figure 15 depicts a screen-shot of our application. On the left we can see the sketch of a plate and on the right the results returned by the implied query. These results are ordered from top to bottom and from left to right, with the most similar on top.
In order to assess acceptance and recognition-level performance, we conducted pre-liminary usability tests involving three draftspeople working in the mould industry. Sub-jects performed different sketching tasks to search for a set of drawings using our pro-totype. For this tests, we used a database of 32 sample technical drawings from mould plates plus 40 simple drawings, yielding a total of 72 figures. These drawings were clas-sified using our multilevel scheme to produce descriptors for each level of detail and for each subpart. Resulting descriptors were then inserted in a database using our NB-Tree.
Notwithstanding the low number of users involved, preliminary results are very en-couraging. Indeed, for the majority of the queries, drawings sought were found among the topmost five results and could almost always be found within the top ten results. These
results gave some confidence to users. Even though we used a small database in our tests, our approach has the potential to deal with large sets of drawings. The indexing structure, that could prove the main bottle neck during retrieval, has shown good performance for datasets around one million elements, as illustrated in Figure 13 (right) and in Table 2.
Another measure used to evaluate our prototype was the number of sketches necessary to retrieve the desired drawing. In the majority of the cases users obtained a successful result after the first sketch. However, there were situations where users had to repeat the initial sketch. Only once a user needed to attempt a query three times.
To be useful, a SBR system must provide good results on short notice. We measured the total time including sketching and query execution on a Tablet PC (Pentium III @ 800 MHz, running Windows XP with 256 MB of RAM). Query execution proper took from two to ten seconds, while the total time for users to draw the sketch and obtain results was less than one minute, in most cases.
One of the things that we observed during the execution of tasks was that users did not care about where in the order of retrieval the intended drawing appears, the important fact being that it was there. One of the users produced this comment ”It [the SBR system] found it [the drawing]! That is what counts!”
In summary, users liked the interaction paradigm very much (sketches as queries), were satisfied with returned results and pleased with the short time they had to spend to get what they wanted in contrast to more traditional approaches.
From users’ comments and suggestions, and from our observations, we are improving our prototype and algorithms. We plan to test the new version of the prototype with a larger number of users and with a larger database of drawings, to get more supported results and conclusions.
6
Conclusions and Future Work
We have presented a generic approach suitable for content-based retrieval of structured graphics and drawings. Our method hinges on recasting the general picture matching problem as an instance of graph matching using vector descriptors. To this end we index drawings using a topology graph which describes adjacency and containment relations for parts and subparts. We then transform these graphs into descriptor vectors in a way similar to hashing to obviate the need to perform costly graph-isomorphism computations over large databases, using spectral information from graphs. Finally, a novel approach to multidimensional indexing provides the means to efficiently retrieve sub-drawings that match a given query in terms of its topology.
We described in detail the overall process to compute descriptors from drawings, us-ing an algorithm to detect all minimal polygons from a set of lines in polynomial time and space, through a combination of well-known and simple to implement algorithms to perform line segment intersection detection and to find a MCB of a graph. Additionally, we presented a new multilevel method to describe drawings, using level of detail and par-tial matching. This scheme computes several descriptors for the same drawing, allowing retrieval either by partial matching or by coarse specification of queries. This method is also applicable to query-by-example, without modifications.
We have also used our approach to develop a Sketch-Based Retrieval system for Cli-pArt drawings [47]. Although this is another domain of application, where the geometric information is more relevant than topology, experimental evaluation yielded good results with a larger database (1,000 drawings and query times under 10 seconds), which shows good promise and atests to the scalability of our approach.
Acknowledgements
This work was funded in part by the Portuguese Foundation for Science and Technology grant 34672/99 and the European Commission project SmartSketches grant# IST-2000-28169. The authors would like to thank Maytham Safar for providing the information about his human perception experiment.
References
[1] Ellen Y. Do. The right tool at the right time. PhD thesis, Georgia Institute of Technology, September 1998.
[2] Ellen Y. Do. What’s in a Diagram that a Computer Should Understand? In
Proceed-ings of The Sixth International Conference on Computer Aided Architectural Design Futures (CAADF 1995), pages 103–114. The Global Design Studio, 1995.
[3] SmartSketches Project (IST-2000-28169).http://sketch.inesc.pt/, 2000. [4] D. V. Bakergem. Image Collections in The Design Studio. In The Electronic Design
Studio: Architectural Knowledge and Media in the Computer Age, pages 261–272.
MIT Press, 1990.
[5] M. Clayton and H. Wiesenthal. Enhancing the Sketchbook. In Proceedings of the
Association for Computer Aided Design in Architecture (ACADIA 1991), Los
Ange-les, CA, 1991.
[6] Abby A. Goodrum. Image Information Retrieval: An Overview of Current Re-search. Informing Science, Special Issue on Information Science Research, 3(2):63– 67, 2000.
[7] K. Markey. Access to Iconographical Research Collections. Library Trends,
37(2):154–174, 1988.
[8] P. Enser and C. McGregor. Analysis of Visual Information Retrieval Queries. British Library Research and Development Report, 6104, 1993.
[9] G. A. Seloff. Automated Access to the NASA-JSC Image Archive. Library Trends, 38(4):682–696, 1990.
[10] S. K. Chang, B. Perry, and A. Rosenfeld. Content-Based Multimedia Information
Access. Kluwer Press, 1999.
[11] Yong Rui, Thomas S. Huang, and Shih-Fu Chang. Image Retrieval: Current Tech-niques, Promising Directions, and Open Issues. Journal of Visual Communication
[12] Mark D. Gross. Indexing Visual Databases of Designs with Diagrams. In A. Kouta-manis, H. Timmermans, and I. Vermeulen, editors, Visual Databases in Architecture, pages 1–14, Avebury: Aldershot, UK, 1995.
[13] Mark Gross and Ellen Do. Demonstrating the Electronic Cocktail Napkin: a paper-like interface for early design. In Proceedings of the Conference on Human Factors
in Computing Systems (CHI 1996), pages 5–6, 1996.
[14] Stefan Berchtold and Hans-Peter Kriegel. S3: Similarity search in cad database systems. In Proceedings of the International Conference on Management of Data
(SIGMOD 1997), pages 564–567, Tucson, Arizona, USA, 1997. ACM Press.
[15] Jong Park and Bong Um. A New Approach to Similarity Retrieval of 2D Graphic Objects Based on Dominant Shapes. Pattern Recognition Letters, 20:591–616, 1999. [16] Stefan M¨uller and Gerhard Rigoll. Searching an Engineering Drawing Database for User-specified Shapes. In Proceedings of the International Conference on Document
Analysis and Recognition (ICDAR 1999), pages 697–700, Bangalore, India, 1999.
[17] Wing Ho Leung and Tsuhan Chen. User-Independent Retrieval of Free-Form Hand-Drawn Sketches. In Proceedings of the IEEE International Conference on
Acous-tics Speech and Signal Processing (ICASSP 2002), volume 2, pages 2029–2032,
Orlando, Florida, USA, May 2002. IEEE Press.
[18] Wing Ho Leung and Tsuhan Chen. Retrieval of Sketches Based on Spatial Relation Between Strokes. In Proceedings of the IEEE International Conference on Image
Processing (ICIP 2002), volume 1, pages 908–911, Rochester, New York, USA,
September 2002. IEEE Press.
[19] Mohammad Nabil, Anne H.H. Ngu, and John Shepherd. Picture Similarity Retrieval Using the 2D Projection Interval Representation. IEEE Transactions on Knowledge
and Data Engineering, 8(4):533–539, August 1996.
[20] Thomas Funkhouser, Patrick Min, Michael Kazhdan, Joyce Chen, Alex Halderman, David Dobkin, and David Jacobs. A search engine for 3d models. ACM Transactions
on Graphics, 22(1), January 2003.
[21] A. Brucale, M. d’Amico, M. Ferri, L. Gualandri, and A. Lovato. Size functions for image retrieval: A demonstrator on randomly generated curves. In J.P. Eakins M.S. Lew, N. Sebe, editor, Proceedings of the International Conference on Image
and Video Retrieval (CIVR 2002), volume 2383 of Lecture Notes in Computer Sci-ence, pages 235–244. Springer-Verlag, 2002.
[22] B. B. Kimia, A. Tannenbaum, and S. W. Zucker. Shapes, shocks, and deformations, i: The components of two-dimensional shape and the reaction-diffusion space.
In-ternational Journal of Computer Vision, 15(3):189–224, 1995.
[23] M. Pelillo, K. Siddiqi, and S. W. Zucker. Matching hierarchical structures using association graphs. IEEE Pattern Analysis and Machine Intelligence, 21(11):1105– 1120, November 1999.
[24] A. Shokoufandeh, S. Dickson, K. Siddiqi, and S. Zucker. Indexing Using a Spec-tral Encoding of Topological Structure. In Proceedings of the IEEE Conference on
Computer Vision and Pattern Recognition, pages 491–497, June 1999.
[25] Dmitry Bespalov, Ali Shokoufandeh, William C. Regi, and Wei Sun. Scale-space representation of 3d models and topological matching. In ACM Symposium on Solid
Modeling and Applications, pages 208–215. ACM, June 2003.
[26] Dragos Cvetkovic, Peter Rowlinson, and Slobodan Simic. Eigenspaces of Graphs. Cambridge University Press, United Kingdom, 1997.
[27] Manuel J. Fonseca and Joaquim A. Jorge. Experimental Evaluation of an on-line Scribble Recognizer. Pattern Recognition Letters, 22(12):1311–1319, 2001.
[28] Joaquim A. Jorge. Parsing Adjacency Grammars for Calligraphic Interfaces. PhD thesis, Rensselaer Polytechnic Institute, Troy, New York - USA, December 1994. [29] Manuel J. Fonseca and Joaquim A. Jorge. Indexing High-Dimensional Data for
Content-Based Retrieval in Large Databases. In Proceedings of the 8th International
Conference on Database Systems for Advanced Applications (DASFAA 2003), pages
267–274, Kyoto, Japan, March 2003. IEEE Computer Society Press.
[30] Manuel J. Fonseca and Joaquim A. Jorge. NB-Tree: An Indexing Struc-ture for Content-Based Retrieval in Large Databases. Technical re-port, INESC-ID, http://immi.inesc.pt/∼mjf/publications/
mjf-jaj-TR-01-03.pdf, 2003.
[31] Dan Haperin and Eli Packer. Iterated snap rounding. Computational Geometry:
Theory and Applications, 23(2):209–225, 2002.
[32] John Hershberger Michael Goodrich, Leonidas Guibas and Paul Tanenbaum. Snap rounding line segments efficiently in two and three dimensions. In Proceedings of
13th Annual Symposium on Computational Geometry, pages 284–293. ACM, June
1997.
[33] Alfredo Ferreira, Manuel J. Fonseca, and Joaquim A. Jorge. Polygon Detection from a Set of Lines. In Proceedings of 12oEncontro Portuguˆes de Computac¸˜ao Gr´afica (12th EPCG), pages 159–162, Porto, Portugal, October 2003.
[34] J.L.Bentley and T.Ottmann. Algorithms for reporting and counting geometric inter-sections. IEEE Transactions on Computers, pages 643–647, 1979.
[35] Joseph O’Rourke. Computational Geometry in C, chapter Section 7.7 ”Intersection of Segments”, pages 264–266. Cambridge University Press, 2nd edition, 1998. [36] John Hobby. Practical segment intersection with finite precision output.
[37] Ulrike Bartuschka, Kurt Mehlhorn, and Stefan Naher. A robust and efficient imple-mentation of a sweep line algorithm for the straight line segment intersection. In
Proceedings of Workshop on Algorithm Engineering, pages 124–135, Venice, Italy,
September 1997.
[38] Prabhaker Mateti and Narsingh Deo. On algorithms for enumerating all circuits of a graph. SIAM Journal on Computing, 5(1):90–99, March 1976.
[39] J.D.Horton. A polynomial-time algorithm to find the shortest cycle basis of a graph.
SIAM Journal on Computing, 16(2):358–366, April 1987.
[40] David Hartvigsen and Russel Mardon. The all-pairs minimum cut problem and the minimum cycle basis problem on planar graphs. SIAM Journal on Computing, 7(3):403–418, August 1994.
[41] Max J. Egenhofer. A Formal Definition of Binary Topological Relationships. In W. Litwin and H. Schek, editors, Third International Conference on Foundations of
Data Organization and Algorithms (FODO 1989), volume 367 of Lecture Notes in Computer Science, pages 457–472. Springer-Verlag, Paris, France, June 1989.
[42] Max J. Egenhofer and Khaled K. Al-Taha. Reasoning about Gradual Changes of Topological Relationships. In A. Frank, I. Campari, and U. Formentini, editors,
Theory and Methods of Spatio-Temporal Reasoning in Geographic Space, volume
639 of Lecture Notes in Computer Science, pages 196–219. Springer-Verlag, Pisa, Italy, September 1992.
[43] N. Katayama and S. Satoh. The SR-tree: An Index Structure for High-Dimensional Nearest Neighbor Queries. In Proceedings of the International Conference on
Man-agement of Data (SIGMOD 1997), pages 369–380. ACM Press, 1997.
[44] Yasushi Sakurai, Masatoshi Yoshikawa, Shunsuke Uemura, and Haruhiko Kojima. The A-tree: An Index Structure for High-Dimensional Spaces Using Relative Ap-proximation. In Proceedings of the 26th International Conference on Very Large
Data Bases (VLDB 2000), pages 516–526, Cairo, Egypt, 2000.
[45] Stefan Berchtold, Christian B¨ohm, and Hans-Peter Kriegel. The Pyramid-Technique: Towards Breaking the Curse of Dimensionality. In Proceedings of the
International Conference on Management of Data (SIGMOD 1998). ACM Press,
1998.
[46] Maytham Safar, Cyrus Shahabi, and Chung hao Tan. Resiliency and Robustness of Alternative Shape-Based Image Retrieval Techniques. In Proceedings of IEEE
International Database Engineering and Applications Symposium, 2000.
[47] Manuel J. Fonseca, Bruno Barroso, Pedro Ribeiro, and Joaquim A. Jorge. Retrieving Vector Graphics Using Sketches. In Proceedings of the Smart Graphics Symposium
Notes
1A cycle basis is defined as a basis for the cycle space ofGwhich consists entirely of
elementary cycles. A cycle is called elementary if it contains no vertex more than once.