CloudPD: Problem Determination and Diagnosis in
Shared Dynamic Clouds
⋆
Bikash Sharma
†, Praveen Jayachandran
§, Akshat Verma
§, Chita R. Das
††Department of Computer Science and Engineering, Pennsylvania State University, University Park, PA
{bikash, das}@cse.psu.edu
§IBM Research - India
{prjayach, akshatverma}@in.ibm.com
Abstract— In this work, we address problem determination in virtualized clouds. We show that high dynamism, resource shar-ing, frequent reconfiguration, high propensity to faults and auto-mated management introduce significant new challenges towards
fault diagnosis in clouds. Towards this, we propose CloudPD,
a fault management framework for clouds. CloudPD leverages
(i) a canonical representation of the operating environment to quantify the impact of sharing; (ii) an online learning process to tackle dynamism; (iii) a correlation-based performance models for higher detection accuracy; and (iv) an integrated end-to-end feedback loop to synergize with a cloud management ecosystem. Using a prototype implementation with cloud representative batch and transactional workloads like Hadoop, Olio and RUBiS, it is
shown thatCloudPDdetects and diagnoses faults with low false
positives (< 16%) and high accuracy of 88%, 83% and 83%,
respectively. In an enterprise trace-based case study, CloudPD
diagnosed anomalies within30seconds and with an accuracy of
77%, demonstrating its effectiveness in real-life operations.
Keywords—Cloud, Problem Determination, Fault Diagnosis, Vir-tualization, Performance, Hadoop MapReduce
I. INTRODUCTION
Large data centers and utility clouds experience frequent faults, which are top contributors to their total management costs, and lead to Service Level Agreement (SLA) violations of the hosted services [1]–[4]. A recent survey shows that IT downtime on an average leads to 14 hours of downtime per year, costing $26.5 billion in lost revenue [5]. Another survey [6] shows growing reluctance in customers to move to clouds due to the incurred unpredictable performance. A related study [7] on3years worth forum messages concerning the problems faced by end users of utility clouds shows that virtualization related issues contribute to around20%of the to-tal problems experienced. The existence of public repository of failure traces [8] across diverse distributed systems like Skype, Microsoft and Planetlab, further demonstrates the prevalence and need for taming the faults for successful operation.
Traditional problem determination in distributed systems is geared towards building a model of an application running without errors [1]. When an application’s current performance does not match the model of its normal execution, an anomaly is detected, thereafter system administrators are alerted, who usually fix the anomaly manually. Clouds present an automated and dynamic model, which conflicts with the manual/semi-automatic process of problem determination. An application running inside a cloud often appears opaque to the cloud provider, which makes it non-trivial to access fine-grained sys-tem and application measurements for problem detection [9].
⋆During this work, the author was an intern at IBM Research - India.
A. Problem Determination in Clouds: What is New?
In this paper, we address the issue of problem determination in a dynamic multi-tenant Infrastructure as a Service (IaaS) cloud environment. We focus only on problems that lead to the performance degradation of an application, but do not cause it to fully abort (e.g., fail-stop failures like power outage). Besides being large scale virtualized systems, clouds present the following new challenges that traditional problem determination techniques fall short of to address:
•Sharing of Resources: Clouds are multi-tenant, and multiple
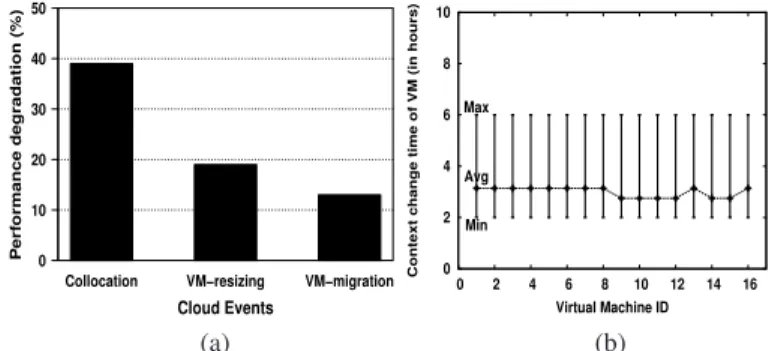
virtual machines (VMs) are collocated on the same physical server. Since resources like cache, disk and network band-width are not virtualized, the performance of an application may depend on other collocated applications. We conducted a preliminary study to understand the impact of colloca-tion (i.e., multiple applications sharing a common set of resources), VM migration and VM resizing. We observed that multi-tenancy can lead up to 40% performance degradation for a sample file system benchmark Iozone (Figure 1(a)). This makes it important for problem determination tech-niques to understand the operating context under which a workload operates and distinguish a collocation fault from an application error. Operating context quantifies the impact of collocated applications by augmenting the metrics that are affected by the environment (e.g., host server metrics like cache miss) in the application performance model. We elaborate on the notion of operating context in Section III-A.
•Dynamism: Clouds are elastic and allow workloads to
au-tomatically request/release resources on-demand. Elasticity in a cloud is enabled through techniques like VM resizing, VM migration, and VM cloning. Hence, the operating context under which a workload operates changes more frequently, compared to traditional distributed systems. In a24-hour case study (Section V-F), we observed that the operating context of all VMs changes within3.5 hours (Figure 1(b)), and the maximum duration without a change in operating context for any VM was 6 hours. This makes it imperative for a problem determination system to dynamically learn the application behavior in the specific operating context, rendering static model-based approaches ineffective for clouds [10]–[12].
•High Frequency of Faults: Sharing of resources combined
with high dynamism invariably leads to a large number of cloud anomalies [7], [9], [12], [13]. We observed that a faulty VM resizing can impact performance by up to 20% and a faulty VM migration can impact performance by more than 10%(Figure 1(a)). Further, we found that up to10%of cloud reconfiguration actions can be faulty (Section V-F). Thus, problem determination in clouds needs to deal with a much higher frequency of faults than traditional distributed systems.
Collocation VM−resizing VM−migration Cloud Events P erf ormance degradation (%) 0 10 20 30 40 50 0 2 4 6 8 10 0 2 4 6 8 10 12 14 16
Context change time of VM (in hours)
Virtual Machine ID Min
Avg Max
(a) (b)
Figure 1: (a) We ran a file system benchmark, Iozone, on
one virtual machine, hosted on an IBM blade server (details in Section V-A), and observed degradation in its execution time due to various cloud events; (b) Operating context of workloads changes frequently due to high dynamism in clouds.
•Autonomic Systems: Cloud is an autonomic end-to-end
sys-tem, which reacts automatically to changes in workload requirements. A problem determination system that manually flags a cloud anomaly like VM sizing error does not suit the cloud model [9], [10], [13]. Problem determination in a cloud needs to take a completely automated end-to-end approach for anomaly detection, diagnosis, classification and remediation by integrating with the cloud management stack [9]. To the best of our knowledge, no such framework exists today for an automated end-to-end handling of virtualized cloud related faults. Thus, in this paper, we present the design and implementation of a comprehensive end-to-end fault manage-ment framework for clouds, calledCloudPD.
The design of CloudPD includes the operating context of a workload in its resource model to quantify the performance im-pact of collocated applications in a scalable manner.CloudPD
consists of online model generation techniques for building performance models for applications by considering them as black boxes. It combines simple and correlation-based models in a two-phase methodology, where a light-weight resource model is first used to predictably trigger events, followed by a correlation-based analysis only for a sub-set of these events.
B. Contributions
To summarize, we make the following contributions: •We demonstrate that high dynamism and sharing of
re-sources in the cloud often lead to frequent changes in an application’s resource model, obviating the applicability of problem determination techniques that create a stationary model for a system, and identify deviations from the model to flag errors. Further, cloud introduces new anomalies due to sharing and cloud reconfiguration, which are difficult to differentiate from application errors. We identify the need for an end-to-end problem detection, diagnosis and remediation framework, consistent with the autonomic cloud management system. Unlike prior works, where the thrust was primarily on application level anomalies, we specifically focus on faults that arise due to cloud activities, and virtualization artifacts such as VM migration, VM resizing, and VM collocation. •We present the design and implementation of CloudPD,
a fault management system, which addresses the chal-lenges identified with a problem determination framework for clouds.CloudPD introduces three novel ideas and combines them with known techniques to design an effective method-ology for problem determination. Our first idea attacks the problem of a non-stationary context by introducingoperating
context of an application in its resource model. The second
idea is in using host metrics as a canonical representation of the operating context for drastically reducing the number of resource models to be learned. Moreover, we use an online learning approach to further reduce the number of resource models learned by the system. The third idea is a three-level framework (i.e., a light-weight event generation stage, an inexpensive problem determination stage and a robust diagnosis stage) which combines resource models with correlation models as an invariant of application behavior. Since pair-wise correlation behaviors are expensive to learn, we restrict ourselves to learning (i) only linear correlations; and (ii) correlations between metrics that exhibit affinity, allowing the system to scale well.
•We have implemented a working prototype of CloudPD, and performed comprehensive evaluations on 28 VMs with cloud representative benchmarks – Hadoop, Olio, and RUBiS, whereCloudPDdiagnosed faults with low false positives (< 16% on average) and high accuracy of88%,83% and83%, respectively. In another enterprise trace-driven case study on an IaaS cloud testbed, CloudPD achieved an accuracy of 77%, with high recall and precision, and fewer false alarms. Furthermore, CloudPDcan suggest the required remediation actions to the cloud resource manager within30seconds.
II. BACKGROUND
In this section, we present an overview of related work in the context of problem determination and diagnosis, then discuss howCloudPD interfaces with a cloud ecosystem, and addresses the new challenges posed by cloud environments.
A. Related Work
We categorize the prior works according to the techniques used and existing frameworks for problem determination.
Core problem determination techniques:Problem
determi-nation techniques can essentially be classified into:
(a)Threshold-based schemes:Thresholds are set on system and
application performance metrics based on historical observa-tions of an application behavior and an alarm is raised if any threshold is violated. This approach forms the basis of many commercial (like IBMTivoli, HPOpenview) and open source (like Ganglia, Nagios) monitoring tools. However, it is unsuit-able for environment with dynamic changes, is susceptible to high false alarm rates, and is expected to perform poorly in the context of large scale utility clouds [10].
(b) Statistical machine learning techniques: A popular
ap-proach in problem determination is to use statistical techniques to build a performance model of the system under normal behavior and flag deviations as anomalies [11], [14]–[16]. Performance models can be built reliably in a scalable fashion. Recently, application-based correlation [4], [17] as well as peer-based correlation [12] methods have been proposed as effective ways to capture the performance invariants, and variations from the modeled correlation are being treated as anomalies. Correlation invariants are effective, but are expen-sive to learn, and require large training data, especially for non-linear correlations. Peerwatch [12] uses canonical correla-tion analysis for identifying underlying correlacorrela-tions. However, this technique only works for positive correlations. Zhang et al. [18] leverage an ensemble of models to address variations in an underlying model (performance or correlation-based) that may change with time due to fluctuation in workload intensity or mix, software or hardware updates. Similarly, Cherkasova
et al. [15] identify an application change using two different models for a given time period, leading to higher accuracy.
Problem determination frameworks: EbAT [10] is a
sys-tem for anomaly identification in data centers, which ana-lyzes system metric distributions rather than individual metric thresholds. Vigilant [19] is an out-of-band, hypervisor-based failure monitoring scheme for VMs that uses machine learning to identify faults in the VMs and guest operating system (OS). DAPA [13] is an initial prototype of an application performance diagnostic framework for virtualized environ-ments. PREPARE [9] is a recently proposed framework for performance anomaly prevention in virtualized clouds, which integrates online anomaly detection and predictive prevention measures to minimize the performance impact of anomalies. All the above prior works, in the context of virtualized environ-ments, address detecting application or OS related anomalies, but do not focus on detecting anomalies that arise due to cloud activities and virtualization artifacts such as VM migration, VM resizing, and VM collocation, which is a key contribution and focus of this work. Moreover, the above frameworks have only addressed in isolation either one or two of the components of a cloud ecosystem (see Figure 2), whereas
CloudPDintegrates them together in an efficient infrastructure.
B. End-to-end Problem Determination in a Cloud Ecosystem
IaaS cloud management systems are autonomic and contin-ually optimize the cloud infrastructure to adapt to different workload variations. Since future management actions in a cloud are dependent on the outcome of previous actions, the cloud management stack should be made aware of any faults that happen as a result of these events. Hence, a problem determination system in a cloud needs to be autonomic and provide fault remediation actions for cloud related faults.
VM1
VIRTUALIZATION LAYER
SERVER STORAGE NETWORK
VM2 VM3 VM i VM n
MONITORING DATABASE
CloudPD
CLOUDRM
App App App App App
MONITORING ENGINE SYSTEM ADMIN Trigger, Guidance Usage Data Application Errors System Errors WORKLOAD PROFILES Workload Change
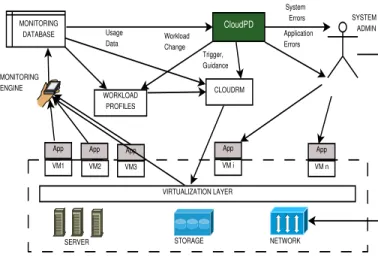
Figure 2: System Context forCloudPD.
Figure 2 captures the system context in which a cloud prob-lem determination system needs to operate. A Cloud Resource Manager (CloudRM) periodically reconfigures the cloud using the monitored system, application data, and workload pro-files. The monitored data is used to estimate the resource requirements and the workload profiles are used to identify the workloads that are conflicting. The reconfiguration events are passed to the virtualization layer for further actions.
There are two aspects of a cloud ecosystem that merit attention. First, IaaS clouds use multi-tenancy to ensure that compute resources are efficiently utilized. Multi-tenancy is supported by reserving CPU and memory for individual VMs.
However, virtualization does not allow reservation of resources that are not traditionally managed by operating systems, such as cache, network and I/O bandwidth. Due to the shared nature of these resources, an application may witness a change in performance if VMs are dynamically configured (i.e.,added or removed) on a physical server hosting the workload. Hence, clouds introduce collocation faults, where an application ex-periences a performance anomaly due to collocated VMs.
The second aspect of interest is the continual reconfigurations happening in a cloud. Two particular reconfiguration actions are relevant in terms of performance anomalies: (i) CloudRM uses prediction to estimate VM sizes [20] and resizes a VM based on the estimate. An error in prediction may lead to a VM being allocated fewer resources than it requires, leading to a VM resizing fault; and (ii) CloudRM uses VM live migration for effective workload consolidation to achieve better power and network efficiency. VM live migration can similarly lead to performance degradation [21]. During VM live migration, all memory pages are marked as ready-only and writes result in faults. Hence, the performance of write-intensive workloads can suffer during live migration. Further, a live migration requires significant amount of CPU, and this can have an impact on performance or lead to failed live migrations.
Clouds introduce new fault types that need to be distinguished from traditional application faults. However, they pose more fundamental challenges for problem determination. Problem determination in traditional distributed systems has always fo-cused onone application at a time[8]. Collocation faults imply that the model for normal behavior of an application needs to be learned in the context of other collocated applications. Com-bined with VM live migration, it implies that this model needs to be learned in the context ofallpossible sets of applications that can be collocated with a target application. In a cloud with thousands of applications, creating such a large ensemble of models is clearly infeasible. Similarly, since resources allocated to a VM can change (by dynamic VM resizing), none of the thresholding techniques [11] can be applied. Correlation based models are typically more stable and can be effectively applied. However, the number of relevant pair-wise correlations are exponential in a cloud, where any application can be impacted by any other collocated application. Finally, a cloud problem determination system (like CloudPD) needs to integrate with the cloud management infrastructure and update any collocation errors as changes in workload profile. If any VM has been wrongly sized,CloudPDneeds to trigger CloudRM to estimate the new sizes for the VM. Similarly, any faulty live migrations should be communicated as guidance to CloudRM for future configuration actions. Application and system errors are handled by notifying system administrators. The cloud ecosystem imposes a need for not just fault detection but diagnosis and automated remediation.
III. CloudPDARCHITECTURE
A. Design Decisions
This section describes the architecture ofCloudPD, which is based on the following three key design choices:
•Include Operating Context in the Performance Model:
One of the key ideas inCloudPD is to include theoperating
context of a workload in its performance model to capture
the impact of other collocated applications in a scalable fashion. The most natural choice for an operating context is the set of collocated applications for each VM. However, the number of possible operating contexts for just one application
is exponential in the number of other VMs in the cloud (e.g., 10005
for VM density of 6 with 1000 VMs). The
hypothesis which we made here is that including only the host metrics in the operating context may reasonably approximate the impact of collocated VMs. If multiple VMs have the same collocation impact on our target application, this idea merges all VMs into a common operating context, drastically reducing the number of operating contexts. We define an operating context for a VM to include the (i) host metrics; and
(ii) impactedmetrics. Impacted metrics are defined as those
which are affected by the environment and include L1/L2 cache misses, context switches, page faults, etc. Host metrics include the resource metrics (CPU, memory) and impacted metrics for the physical server hosting the VM. Figure 3 illustrates an example of the effectiveness of this canonical representation. For both an anomalous VM migration interval and a normal interval, the CPU and memory usage of a VM are nearly the same. However, the distinction that allows
CloudPDto identify a migration fault is primarily in the cache
misses experienced at the server, hosting the VM.
0.0 0.2 0.4 0.6 0.8 1.0 Time (minutes) Normaliz ed Usa g e 0 3 6 9 12 15
VM−CPU VM−Memory Host−cache−miss
0.0 0.2 0.4 0.6 0.8 1.0 Time (minutes) Normaliz ed Usa g e 0 3 6 9 12 15
VM−CPU VM−Memory Host−cache−miss
(a) Normal interval (b) Anomalous interval
Figure 3: Importance of operating context; (a) shows the CPU and memory usage of a VM, and the host’s cache miss for a normal interval; (b) for an anomalous VM migration interval, the CPU and memory usage of the VM almost remain same, but represents higher host’s cache miss. We observed on an average
95% difference in the host’s cache-miss between (a) and (b).
•Online Model Generation: A traditional problem
determi-nation approach learns an application model a priori based on historical data. Even with our transformation, the number of canonical operating contexts may be large and difficult to be knowna priori. Hence,CloudPDadopts an online model generation approach for building performance models. This also allows CloudPD to consider an application as a black box and extend to new ones on the fly.
•Combining Simple and Correlation-based Models: We
observed that pair-wise correlations are stable (Section V-D), but computing all pairwise correlations is fairly expensive. We combine the strengths of both simple and correlation-based techniques in a two-phase approach, where a light-weight resource model generates events in the first phase and a moderately expensive correlation-based analysis is per-formed to accurately identify faults for only a small number of intervals, where the first phase generated events. To further reduce the time spent in the second phase, we (i) use only linear correlations, which are present for 50% metrics [17], and can be learned quickly with small amount of data; and (ii) compute correlations only for those metric pairs, which are likely to be correlated (i.e.,metrics of the same VM or the same metric across VMs that are part of a cluster). Computing correlations for only a subset of intervals helps CloudPD
scale to large clouds. We also considered the use of canonical
correlation analysis (CCA) to identify correlated metrics [12]. However, CCA cannot extract negative correlations, which we observed in practice (e.g.,CPU and disk usage are negatively correlated), precluding its use inCloudPD.
B. Architecture
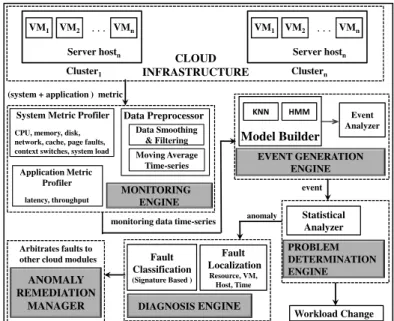
Figure 4 shows the architecture ofCloudPD. It comprises of five key components: (a) a Monitoring Engine that monitors each virtual machine and physical server for the metrics of interest; (b) anEvent Generation Enginethat quickly identifies a potential symptom of a fault and generates an event; (c)
a Problem Determination Engine that further analyzes the
event to determine deviations from normal behavior; (d) a
Problem Diagnosis Engine that classifies the anomaly based
on expert knowledge; and (e) anAnomaly Remediation Engine
that executes remedial actions on the diagnosed anomalies. We describe each of them in detail below:
CLOUD INFRASTRUCTURE
(system + application ) metric
Data Preprocessor
monitoring data time-series anomaly
MONITORING ENGINE EVENT GENERATION ENGINE PROBLEM DETERMINATION ENGINE DIAGNOSIS ENGINE Clustern event KNN HMM Server hostn VM1 VM2 . . . VMn Model Builder Data Smoothing & Filtering Moving Average Time-series CPU, memory, disk,
network, cache, page faults, context switches, system load
System Metric Profiler Event Analyzer Fault Localization Resource, VM, Host, Time Statistical Analyzer Workload Change latency, throughput Application Metric Profiler Fault Classification (Signature Based ) ANOMALY REMEDIATION MANAGER Arbitrates faults to other cloud modules
Cluster1
Server hostn
VM1 VM2 . . . VMn
Figure 4: Architecture ofCloudPD.
1) Monitoring Engine: This component collects and
pro-cesses various system metrics pertaining to CPU, memory, cache, network, and disk resources, and application metrics such as latency and throughput for every virtual machine and physical server (see Table I). It is designed to capture (i) system resource metrics; (ii) operating context; and (iii) application performance metrics. The System Metric Profiler
collects system resource metrics as well as the operating context, while the Application Metric Profiler collects all the application performance metrics. All metrics are collected at periodic intervals with a configurable monitoring interval parameter. CloudPD has a Data Preprocessor module that removes outliers and noise. The Data Preprocessortakes the raw time-series data and generates data-points. Adata-point
is defined as a sequence of moving average values over a fixed interval of time and forms the basic input unit for the various anomaly detection algorithms used in CloudPD.
2) Event Generation Engine: This module implements the
first phase of the multi-layered CloudPD framework. It is designed to identify the potential symptoms of anomalous be-havior without performing a lot of computation. The generation of an event may not immediately denote the presence of a fault, but merely suggests the possibility of one. It indicates that one
or more metrics of a VM deviates from its performance model (the model for normal behavior is continuously generated online to cope with dynamic changes in the workload and operating environment). Further analysis is needed to confirm if a fault is present, and if so, diagnose and classify it.
In order for theEvent Generation Engineto be light-weight, events are generated by looking at each monitored metric for each VM in isolation. A broader correlation between metrics across VMs can be very expensive as the number of such comparisons grows exponentially inN×M space, whereN is the number of VMs andM is the number of monitored metrics for each VM. Note that the Event Generation Enginecan be parallelized with a separate thread performing the analysis for each (metric,VM) pair. Further, in order to build the perfor-mance model in an online fashion that is tolerant to workload variations, we use the nearest-neighbor algorithm as it (i) is simpler to implement; (ii) is computationally less expensive when compared to other techniques such as clustering; and (iii) can be updated online at little cost [22]. Note that these online models are trained only with the historical data portions free of anomalies. We leverage existing techniques [1], [9], [18] for the methodology used in this phase (see Section IV-B).
3) Problem Determination Engine: This component utilizes
statistical correlation across VMs and resource metrics to identify anomalies and localize them. For every event gener-ated by the Event Generation Engine, this stage analyzes the data further to identify anomalies (theProblem Determination
Engine is not invoked unless an event is generated). Let us
suppose that an event is generated for a metric Mj on a VM, V Mi. This stage computes correlations between data for Mj and data for every other metric of V Mi, as well as correlations between data forMj onV Miand data forMj on every other VM running the same application (wherever the information is available). The first set of correlations capture the relation between metrics for the VM (e.g.,the correlation between resource metrics and their operating context), whereas the second set of correlations is based on the idea of using peer VMs to flag faults that occur in only one VM. Based on the knowledge of typical correlation values under normal behavior, any significant deviations from normal correlation values (with range [−1, 1]) are noted. If the deviations are larger than an empirically determined threshold, a fault event is generated and forwarded to theProblem Diagnosis Enginefor problem diagnosis (as per Algorithm 1). Note that although our approach is similar to the idea of peer based correlation [12], we only perform correlations on events generated in the
Event Generation Engine stage, and only for the VM(s) and
resource(s) tagged in this phase. This improves the scalability significantly as demonstrated in Section V-E2.
0 20 40 60 80 0 20 40 60 80 100
Time (1 minute interval)
CPU Utilization (%) of VM1 CPU Utilization Correlation (a) 0 20 40 60 80 0 20 40 60 80 100
Time (1 minute interval)
CPU Utilization (%) of VM2 (b) 0 20 40 60 80 0.0 0.2 0.4 0.6 0.8 1.0
Time (1 minute interval)
Correlation
Threshold = 0.5
(c)
Figure 5: Correlation-based problem determination in CloudPD.
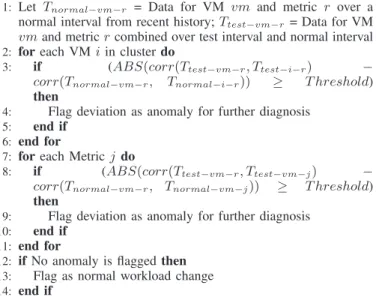
Algorithm 1 Correlation-based problem determination.
1: Let Tnormal−vm−r = Data for VM vm and metric r over a normal interval from recent history;Ttest−vm−r = Data for VM vmand metricrcombined over test interval and normal interval
2: foreach VMiin clusterdo
3: if (ABS(corr(Ttest−vm−r, Ttest−i−r) − corr(Tnormal−vm−r, Tnormal−i−r)) ≥ T hreshold) then
4: Flag deviation as anomaly for further diagnosis
5: end if
6: end for
7: foreach Metricjdo
8: if (ABS(corr(Ttest−vm−r, Ttest−vm−j) − corr(Tnormal−vm−r, Tnormal−vm−j)) ≥ T hreshold) then
9: Flag deviation as anomaly for further diagnosis
10: end if
11: end for
12: ifNo anomaly is flaggedthen
13: Flag as normal workload change
14: end if
In order to cope with dynamism, theProblem Determination
Engine phase computes the models and the deviations in
correlations (described above) in an online manner as shown in Algorithm 1. Correlations on data from an interval classified as normal from the recent history, is used to obtain a model of normal application behavior. For the interval being analyzed, we compute similar correlations and check if these correlations deviate from the model of normal behavior. The total number of correlations computed in this algorithm is of the order of the number of metrics plus the number of VMs running the application. Note that we do not analyze the parts of the system that are not affected, and only analyze theneighborhoodof the location, where an event is generated. This helpsCloudPD to scale to large size systems and monitor several metrics.
We illustrate how correlation-based monitoring helps to local-ize faults using a CPU hog anomaly example. In Figure 5, we plot the CPU utilization of two VMs, running Hadoop Sort on 5GB data (Figure 5(a), (b)). We introduce the CPU hog anomaly during(60−70)thtime interval on VM2. Figure 5(c) plots the pairwise correlations between the CPU utilization of VM1 and VM2. We observe the correlations drop significantly during this interval, and when the difference between this observed and normal correlation exceeds a given threshold (say 0.5), one can effectively detect an anomalous behavior.
4) Problem Diagnosis Engine: This component uses
pre-defined expert knowledge to categorize the potentially anoma-lous scenarios detected by the Problem Determination Engine
into one of the several fault classes. The expert knowledge is made available to the system in the form of standardized
fault signatures. Characterization of system anomalies in terms
of representative signatures is a critical part of diagnosis process [23]. The fault signature captures the set of devia-tions from normal behavior, both in the correlation values computed by the Problem Determination Engine as well as in the operating environment, that are characteristics of the faults they describe. When an anomalous behavior is detected, the deviations from normal behavior are matched with the known fault signatures. If a match is found, this module will successfully categorize the fault, else flag it as an anomaly.
5) Anomaly Remediation Manager: This component of
CloudPD receives input from the Problem Diagnosis Engine
with all the cloud related faults identified so far. In case of a collocation fault, CloudPD sends an exclusion rule to CloudRM that prevents collocation of the impacted VMs on a common physical server. In case of a faulty live migration, it provides new server utilization thresholds beyond which live migration should not be performed. In case of a VM sizing fault, it triggers resource estimation and resizing via CloudRM. For all other cases, a notification is sent to an application or a system administrator. Note that, although it is true that automated remediation is often unacceptable to system administrators, especially for traditional distributed systems like grids and data centers, clouds are forcing a paradigm shift. Clouds represent a much more versatile system, which employ a dynamic consolidation manager like VMware
DRS or Amazon Auto Scaling to automatically deal with
unexpected performance changes. In comparison, CloudPD
actions are safer (triggers cloud manager to re-consolidate or add exclusion constraints between conflicting VMs only).
CloudPD can also address the problem of SLA violations
both at the application and infrastructure (in terms of VMs) level. CloudPD associates VMs with their system and appli-cations performance data. Since performance anomalies do not lead to hard failures, we need performance definition for normal and faulty situations. This definition can come from SLAs, SLOs, or administrator-defined goals. As long as the baseline performance can be defined, CloudPDcan efficiently respond to SLA infringement scenarios.
IV. IMPLEMENTATIONDETAILS
We have implementedCloudPDto perform fault diagnosis for a VMware ESX-based cloud cluster (details in Section V-A). We provide specific details of our implementation below:
A. Monitoring Engine
CloudPD’s Monitoring Engine collects measurements from
individual VMs as well as physical servers. The measurement data (reported in Table I) include basic resource metrics (CPU, memory), impacted operating context parameters (context switches, cache misses), host operating context parameters, and application performance metrics (latency, throughput). We use Linux sar utility to collect the VM level system metrics and VMware vmkperf [24] performance monitoring tool for obtaining a server’s cache misses. To collect CPU and memory usage of the server, we use VMware powercli cmdlets [25]. The monitored data across all VMs and servers are collected and stored at a central VM for further processing by subsequent stages. The Data Preprocessor module generates data-points from the raw time-series data. Data-points pertaining to every interval are analyzed by CloudPD for anomalies. We use a window-size of10, sampling interval of2seconds, and interval length of 15 minutes. The number of data points in the 15 minutes interval are, thus, (15*60)/(10*2) =45.
B. Performance Models for Event Generation
We implemented three modeling techniques as part of the
Event Generation Engine – Hidden Markov Models (HMM),
k-nearest-neighbor (kNN), and k-means clustering [26]. All these three techniques attempt to qualitatively or quantitatively measure the extent of deviation of the current interval test data from models of normal behavior. The CloudPD architecture allows plug and play of any modeling technique as part of the
Event Generation Engine. In the interest of space, we only
discuss the kNN technique used in our evaluation, and refer the readers to [27] for details of the other two techniques.
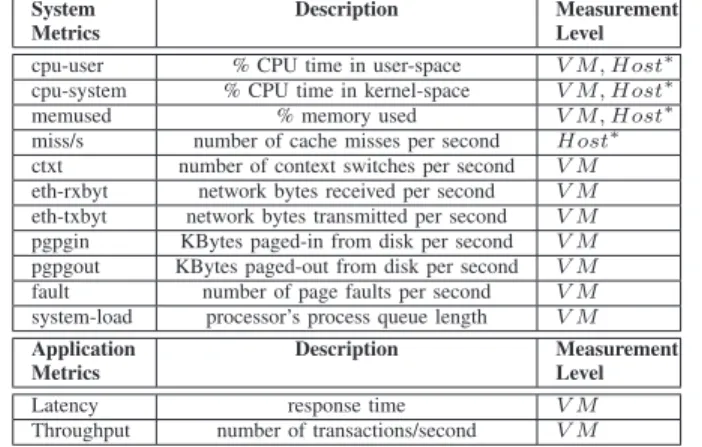
The kNN technique works by computing a distance measure between the data point under consideration and the nearest k neighbors in a given set of model data points known to be normal from recent history. In our implementation, the distance between two data points is defined as the sum of the differences between corresponding samples in the two data points (other reasonable definitions of the distance metric worked equally well). Larger the distance, the larger is the deviation from the normal behavior. If the distance measure for the test interval’s data points is higher by a threshold compared to the distances of the model data points, an event (alarm) is generated (for further analysis by the Problem Determination Engine). Note that, unlike HMM, kNN does not require any training and can learn the model of normal behavior in an online fashion, which allows it to adapt to changes in workload mix or intensity. TABLE I: System and application metrics monitored by
CloudPD; Operating context metrics are marked with *.
System Metrics
Description Measurement
Level
cpu-user % CPU time in user-space V M, Host∗ cpu-system % CPU time in kernel-space V M, Host∗
memused % memory used V M, Host∗
miss/s number of cache misses per second Host∗ ctxt number of context switches per second V M eth-rxbyt network bytes received per second V M eth-txbyt network bytes transmitted per second V M pgpgin KBytes paged-in from disk per second V M pgpgout KBytes paged-out from disk per second V M fault number of page faults per second V M system-load processor’s process queue length V M
Application Metrics
Description Measurement
Level
Latency response time V M
Throughput number of transactions/second V M
C. Problem Diagnosis Engine
We adopt an XML format for describing the fault signatures, so as to allow the CloudPD system to learn to classify new kinds of faults with expert assistance. We assume that each fault has a characteristic signature, which can be expressed in terms of the metrics monitored. We have observed this to be true in our extensive evaluations. We adopt a software
wrapper based on Matlab xmlwrite utility to implement
the diagnosis engine. Essentially, this wrapper provides two functionalities: (a) create an XML based signature of a new fault; and (b) compare a newly created signature with existing fault signatures (stored in a database).
Figure 6 provides an example of an expert-created signature for a VM resizing fault. The signatures are described using different contexts expressed as tags, namely, VM environment, operating environment, hypervisor (includes special log mes-sages from the hypervisor), and application environment. Only the metrics that deviate from normal behavior are captured in the signature, and are expressed as thresholds denoting the minimum deviation in the correlation values required for a signature match. For example, the CPU correlation value computed between a pair of VMs hosting an application should deviate from the correlation value under normal behavior by at least as large as the defined threshold (CPU-corr.-diff) in order to match the signature for a wrong VM sizing (likewise, other tags correlation differences also need to match). These signatures are built automatically, without manual intervention.
D. Complexity Analysis
Let the number of VMs in a cluster executing the same application be N, the number of metrics monitored be M,
<fault>
<name=“VM under-sizing”></name>
<category=“Invalid VM resource sizing”></category>
<description> VM is sized to very low CPU & memory </description> <signature> <VM-environment> <CPU-corr.-diff> 0.13 <CPU-corr.-diff> <memory-corr.-diff> 0.11 </memory-corr.-diff> <system-load-corr.-diff> 0.09 </system-load-corr.-diff> </VM-environment> <Operating-environment> <Avg.CPU-diff (%)> 15.6 </Avg.CPU-diff (%)> <Avg.memory-diff (%)> 9.2 </Avg.memory-diff (%)> <context-switches-corr.-diff> 0.08 </context-switches-corr.-diff> </Operating-environment> <Application-environment> <latency-diff (%)> 14.5 </latency-diff (%)> </Application-environment> </signature> </fault>
Figure 6: Example signature of an invalid VM resizing fault. and the number of fault types be F. Let T be the number of data points in each interval being analyzed. We analyze the complexity of each of the stages ofCloudPDas below: •Finding the nearest neighbor for each data point takesO(T2
) time. The computation performed by the Event Generation
Engine using kN N for each VM and each metric takes
O(N M T2
) time. This can be parallelized across p ≤ N threads, which would takeO(N M T2/p)time.
•For each event generated, theProblem Determination Engine
performs 2(M + N) correlations (one each for the test interval data and the normal interval data obtained from recent history). Thus, net time complexity isO((M +N)T2
). •LetM′be the maximum number of deviations in correlations
that are part of the unique fault signature. This is typically a small number (< 10). For each anomaly identified, the
Problem Diagnosis EnginetakesO(F M′)time.
Thus, the above analysis clearly suggests that the layered approach to fault diagnosis combined with the low complexity of each stage, allowsCloudPDto effectively learn fault models in an online manner for large-scale systems.
E. Types of Faults Handled by CloudPD
Table II lists the various kinds of faults which we focus on in the design, implementation and evaluation of CloudPD.
TABLE II: List of faults covered byCloudPD.
Cloud anomalies Invalid VM resource sizing Impact due to sharing Invalid VM live migration VM faulty reconfigu-ration Non-cloud anomalies Misconfigured application Workload mix change Workload intensity change Software anomaly
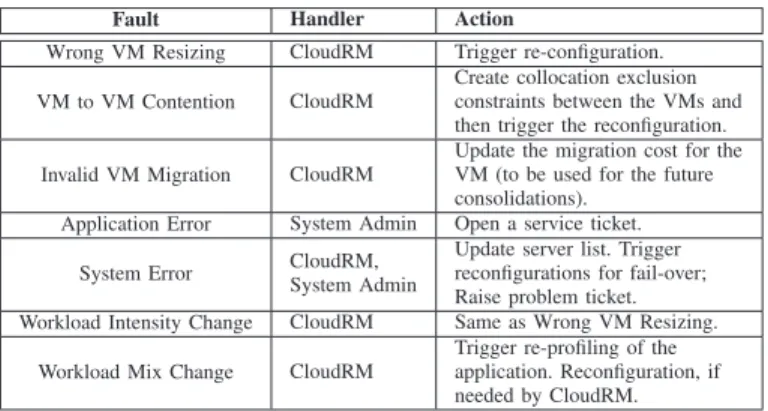
F. Anomaly Remediation Manager
The set of preventive or remedial actions taken byCloudPD
steady state management system are summarized in Table III.
V. EXPERIMENTALEVALUATION
A. Experimental Setup
We used a virtualized server cluster to evaluate CloudPD. The server cluster consists of 1 IBM x3850 M2 server with
16 Xeon 2.1 GHz cores and 132 GB RAM, 3 HS21
blade-servers with 4 Xeon 2.33 GHz cores and 8 GB RAM each, and1HS 21 blade-server with4Xeon3GHz cores and10GB RAM. The HS21 blades are hosted on an IBM Bladecenter-H chassis. The servers have a 2 Gbps fiber channel port,
TABLE III: Remedial actions taken by CloudPD on detecting
various kinds of faults.
Fault Handler Action
Wrong VM Resizing CloudRM Trigger re-configuration. VM to VM Contention CloudRM
Create collocation exclusion constraints between the VMs and then trigger the reconfiguration. Invalid VM Migration CloudRM
Update the migration cost for the VM (to be used for the future consolidations).
Application Error System Admin Open a service ticket. System Error CloudRM,
System Admin
Update server list. Trigger reconfigurations for fail-over; Raise problem ticket. Workload Intensity Change CloudRM Same as Wrong VM Resizing.
Workload Mix Change CloudRM
Trigger re-profiling of the application. Reconfiguration, if needed by CloudRM.
which is connected to an IBM DS4800 storage controller via a Cisco MDS fiber channel switch. All servers run the VMWare ESXi 4Enterprise Plus hypervisor and are managed by a VMWare vSphere 4.0 server. The cloud setup supports enterprise virtualization features including live VM migration, live VM resizing, VM cloning and VM snapshot.
We host total 28 VMs on our cloud setup, which run
Ubuntu v10.04 64-bit operating system. Unless otherwise stated, all VMs are configured with 1.2 GB RAM and 1.6 GHz CPU. Our VMs can be classified into three groups. The first group (Hadoop cluster) consists of 16 VMs that run Hadoop MapReduce [28]. The second (Olio cluster) consists of 6 VMs (4 VMs for web server and2 VMs for database) and runs CloudStone [29], a multi-platform benchmark for Web 2.0. CloudStone consists of a load injection framework called Faban, and a social online calendar web application called Olio [29]. Faban is configured on a separate VM to drive the workload. The third (RUBiS cluster) runs the RUBiS E-commerce benchmark [30], and comprises of6 VMs (2 VMs each across web, application and database tier).
B. Evaluation Metrics
We utilize the following four statistical measures to eval-uate the effectiveness of anomaly detection and diagnosis
by CloudPD. We define a successful anomaly detection as
diagnosing the anomaly correctly using pre-defined fault sig-natures, along with localizing the affected VMs and metrics.
Recall= Number of successful detections
Total number of anomalies (1)
P recision= Number of successful detections
Total number of alarms (2)
Accuracy=2×Recall×Precision
Recall+Precision (3)
False Alarm Rate (FAR)=Number of false alarms
Total number of alarms= 1−Precision (4) C. Competitive Methodologies
To the best of our knowledge, there is no prior work that performs an end-to-end detection, diagnosis and classification of faults in virtualized clouds. Hence, for the purpose of evaluation, we extend existing approaches to perform end-to-end problem determination in clouds. These schemes also implement a subset of our key design decisions, helping us understand the importance of each as employed byCloudPD. Hence, we evaluate the following four such baseline schemes:
Baseline B1:This method is based on existing problem
context. Hence, B1uses only a VM’s CPU and memory met-rics for problem determination. This scheme employs all other
CloudPDtechniques including the three-layered approach, use
of peers, and characterization of anomalies.
Baseline B2: It does not use the multi-layer approach and
analyzes every interval in detail for anomalies. Hence,B2also acts as anoracleand defines the boundaries for any correlation based technique for problem determination.
Baseline B3:It does not include the idea of correlation across
peers. Hence, any gap between B3 and CloudPD can be
attributed to the technique of correlating metrics across peers.
Baseline B4:It uses static thresholds to trigger the execution of
the Problem Diagnosis Engine, similar to monitoring systems
like Ganglia and Nagios, and contrary to CloudPD’s online model-based dynamic thresholds. Hence, comparison of this method withCloudPDcan highlight the importance of using an online learning approach for problem determination in clouds.
D. Analysis of Correlation Stability Across Workload and VM
We have used correlation across system metrics for a VM as well as correlation for a metric across VMs to identify anomalies. Further, our problem signatures are also based on change in correlation between specific set of parameters. These problem signatures are defined independent of workload inten-sity, workload mix as well as VM configurations. Hence, our first set of experiments study if our assumption of correlation values being independent of these parameters is correct.
25% 50% 75% 100% Resource Fraction Correlation 0.0 0.1 0.2 0.3 0.4 0.5
0.6 CPU Memory Disk
Figure 7: Stability of correlation across variations in VM config-urations on heterogeneous platforms.
1) Stability of Correlation with Change in VM Configuration:
In this experiment, we vary the resource configurations of VMs running the workloads. We configure a cluster of 8 Hadoop VMs (V M1−V M8). The CPU and RAM reservations of V M1−V M4 are set to the default values of 1.2 GHz and 1.6 GB, respectively. Four experiments are conducted with different resource configurations forV M5−V M8(25%,50%, 75% and 100% of the CPU and memory of V M1−V M4). HadoopSortbenchmark is run on5GB of data. We correlate CPU, memory and disk utilization across the VMs and report their average values in Figure 7. Although, the raw utilization may vary depending on the resource allocation of VMs, the correlation values remain nearly the same even for heteroge-neous environments, demonstrating the stability of correlation values across changes in VM configurations.
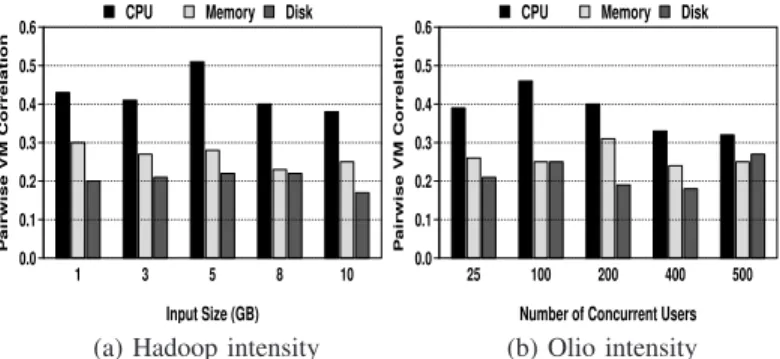
2) Stability of Correlation with Change in Workload Intensity:
We next demonstrate the stability of CloudPD with changes in workload intensity. Figure 8(a) shows the variation in the average pairwise VM correlations (across CPU, memory and disk) with changes in workload intensity for Hadoop. The workload intensity change refers to runningSortwith different input sizes, from1 to10GB. We note that CloudPDwill not
1 3 5 8 10 Input Size (GB) P airwise VM Correlation 0.0 0.1 0.2 0.3 0.4 0.5
0.6 CPU Memory Disk
25 100 200 400 500
Number of Concurrent Users
P airwise VM Correlation 0.0 0.1 0.2 0.3 0.4 0.5
0.6 CPU Memory Disk
(a) Hadoop intensity (b) Olio intensity
Figure 8: Stability of VM correlation across workload intensities. trigger a fault for normal workload changes, since the pairwise VM correlations have very low variations across different workload intensities. As mentioned in Section III-B3, a faulty VM will result in its correlation with other VMs (for one or more metrics) to deviate from other VMs pairwise correlations. Similar observation follows for the Olio benchmark (see Fig-ure 8(b)). For Olio, change in workload intensity is achieved by changing the number of concurrent users from 25to500.
Mx1 Mx2 Mx3 Mx4 Mx5 Workload Mix P airwise VM Correlation 0.0 0.1 0.2 0.3 0.4 0.5
0.6 CPU Memory Disk
Mx1 Mx2 Mx3 Mx4 Mx5 Workload Mix P airwise VM Correlation 0.0 0.1 0.2 0.3 0.4 0.5
0.6 CPU Memory Disk
(a) Hadoop mix (b) Olio mix
Figure 9: Stability of VM correlation across workload mixes.
Mx1 Mx2 Mx3 Mx4 Mx5
Workload Mix
P
airwise Metric Correlation
0.0 0.1 0.2 0.3 0.4 0.5
0.6 CPU <=> ctxt cache miss <=> page fault
Mx1 Mx2 Mx3 Mx4 Mx5
Workload Mix
P
airwise Metric Correlation
0.0 0.1 0.2 0.3 0.4 0.5
0.6 CPU <=> ctxt cache miss <=> page fault
(a) Hadoop mix (b) Olio mix
Figure 10: Stability of metric correlation across workload mixes.
CP U ⇐⇒ctxt refers to correlation between CPU and context
switches on the same VM; cache miss⇐⇒page f ault implies
correlation between cache misses and page faults.
3) Stability of Correlation with Change in Workload Mix:
Changes in the workload mix result in the resource usage behavior of the application to alter, but correlations across all the VMs remain stable. The results of this experiment for Hadoop and Olio are shown in Figure 9, where we observe that the change in pairwise VM correlations is very low across different workload transaction mixes. The transaction mixes used are shown in Table IV. For Olio,bm1−bm5corresponds to different operation mixes in terms of browsing transactions. Furthermore, the correlations across metric pairs on the same VM, although weaker, also remain stable across changes in
the workload mixes (see Figure 10). A similar trend follows for cross-metric correlations of the same VM across workload intensity changes (plots not shown due to space constraints).
Note that, if all correlations are low, it is highly likely that many faults may be missed. However, from our analysis,
CloudPDonly requires critical mass of correlations to identify
faults. For example, from the figures (Figure 7 – Figure 9), we observe correlations are greater than 0.17, and less than0.52. Although, the metric-pairs in Figure 10 have low correlation values, we observed other resource pairs (not shown due to space brevity) with higher correlations. We found many stable moderate correlations in the value range of (0.2−0.5), and failures cause their value to be dropped to either zero or negative. This leads to high precision/accuracy as shown in Table VI and Table IX. However, few errors like disk-hog, which impact metrics like shared disk bandwidth are missed because of low correlation values.
TABLE IV: Workload transaction mixes for Hadoop and Olio;
bm: browsing mix,rw-bd: read-write bidding mix.
Mix-type Hadoop Olio
Mx1 (streamSort,javaSort)-(s) bm1+80%rw-bd Mx2 (streamSort,combiner)-(l) bm2 +85%rw-bd Mx3 (webdataScan,combiner)-(m) bm3 +90%rw-bd Mx4 (combiner,monsterQuery)-(l) bm4 +95%rw-bd Mx5 (webdataScan,webdataSort)-(s) bm5 +99%rw-bd
TABLE V: Number of injected faults (synthetic and trace-driven).
Fault Type Synthetic Trace-driven
invalid VM migration 3 4(cloud induced) invalid VM sizing 3 7(cloud induced) application misconfig. 4 0 CPU-hog 4 3 memory-hog 4 3 disk-hog 2 2 cache-hog 2 2 network-hog 2 2
Total number of faults 24 23
E. Synthetic Fault Injection Results
We compare the performance ofCloudPDand other baselines in terms of their effectiveness in detecting faults, diagnosis time, and scalability. In these experiments, we ran each appli-cation (Hadoop, Olio and RUBiS) independently for24hours. For Hadoop, we continuously ran the HadoopSortbenchmark on5GB data. We ran Olio with100 concurrent users and the default browsing transaction mix (M x1in Table IV). We used the default workload mix for RUBiS (read-only browsing mix and bidding mix with15%read-write interactions). We divided each experiment into96intervals of15minutes each.CloudPD
collects data from the Monitoring Engine and performs a di-agnosis for each interval using all the competing methods. We injected faults randomly in24of these96intervals, the details of which are presented in Table V. The resource-hog faults are custom-written pieces of code that continuously access a particular resource, mimicking a software anomaly. Invalid VM sizing implies faults, when the resource allocations do not meet application demands. Invalid VM migration captures failed migrations due to resource congestion at source/destination host. Further details on these faults can be found in [27].
An interval is categorized as anomalous (for ground truth), if the application latency or throughput is deviant by a cer-tain threshold (obcer-tained through empirical analysis) from the latency/throughput observed for normal behavior. For Hadoop, the latency is the end-to-end job completion time; for RUBiS,
latency is the end-to-end transaction response time. The latency threshold chosen was 11%. For Olio, we used throughput, defined as the number of transactions per second, as the application performance metric, and its threshold was set to 9%. Due to space constraints, we only present results for Hadoop and Olio, but similar results were observed for RUBiS.
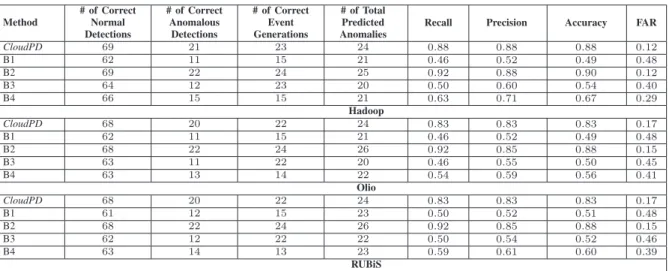
1) End-to-end Diagnosis Comparison: Table VI shows the
end-to-end diagnosis results for CloudPDand the other com-peting methods. For Hadoop, CloudPD was able to correctly detect and diagnose21out of the24faults and69out of the72 normal intervals. It compares very favorably with OracleB2, which is able to identify only one more additional anomaly compared to CloudPD with exhaustive analysis.B1 has low recall and precision as it monitors only a VM’s CPU and memory, and ignores other system metrics (both at VM and server level). Further, it also has a high false alarm rate, where a normal change in operating context is classified as an anomaly. CloudPDis able to avoid these false alarms as it correlates data across multiple metrics (eg.,CPU with context switches and memory with page faults) and does not report an anomaly if the correlations are consistent with the learning models.B3also recorded a low recall and precision and a high false alarm rate, as it does not correlate across peers (VMs run-ning the same application). However, its performance is better than B1.B4, that uses static thresholds, again does not have satisfactory performance. Similar results are observed for Olio and RUBiS, although the performance ofCloudPD is slightly worse compared to Hadoop. We conjecture that this is because Hadoop is a symmetric batch application (map/reduce tasks are similar in type and intensity across all VMs with time), whereas Olio is a more generic distributed application with greater burstiness. There exists intra- and inter-tier correlations among VMs for Olio. However, the magnitude of intra-tier VM correlations is higher than inter-tier VMs correlations, which results in some error in detecting anomalies. We emphasize the fact thatCloudPD is effective in accurately distinguishing cloud anomalies from workload changes and application faults even for shared resources such as cache.
We further analyze the specific faults that were undetected
by CloudPD and the other four baselines. These are listed
in Tables VII and VIII, for Hadoop and Olio, respectively.
CloudPD failed to identify 1 disk hog and 2 application
misconfiguration faults. The disk hog eluded detection since the VMs share their local disks across a Storage Area Network (SAN). The deviation of disk utilization from normal values was not sufficient for theEvent Generation Engineto raise an alarm, preventing CloudPD from detecting it. However, B2 was able to detect this as correlations across metrics and VMs calculated by the Problem Determination Engine showed a significant deviation from normal behavior.CloudPDcould not identify 2 application misconfiguration faults as well, as the difference in cross-resource and cross-VM correlations from normal was not high enough to mark them as anomalies. B2 missed the same 2 application misconfiguration faults
as CloudPD. As B1 only monitors CPU and memory, it
missed a total of 13 faults (it was effective in identifying only CPU and memory hog faults). B3 failed to detect most application related faults as it only performs correlations across resource metrics within a VM and does not perform cross-VM correlations. A faulty cross-VM considered by itself appears as though it is servicing a very large workload, and hence, was not tagged as anomalous. B4 is sensitive to the specific thresholds used, and is ineffective in identifying the different manifestations of the same type of fault.
TABLE VI: Comparing end-to-end diagnosis effectiveness for Hadoop, Olio and RUBiS benchmarks. Method # of Correct Normal Detections # of Correct Anomalous Detections # of Correct Event Generations # of Total Predicted Anomalies
Recall Precision Accuracy FAR
CloudPD 69 21 23 24 0.88 0.88 0.88 0.12 B1 62 11 15 21 0.46 0.52 0.49 0.48 B2 69 22 24 25 0.92 0.88 0.90 0.12 B3 64 12 23 20 0.50 0.60 0.54 0.40 B4 66 15 15 21 0.63 0.71 0.67 0.29 Hadoop CloudPD 68 20 22 24 0.83 0.83 0.83 0.17 B1 62 11 15 21 0.46 0.52 0.49 0.48 B2 68 22 24 26 0.92 0.85 0.88 0.15 B3 63 11 22 20 0.46 0.55 0.50 0.45 B4 63 13 14 22 0.54 0.59 0.56 0.41 Olio CloudPD 68 20 22 24 0.83 0.83 0.83 0.17 B1 61 12 15 23 0.50 0.52 0.51 0.48 B2 68 22 24 26 0.92 0.85 0.88 0.15 B3 62 12 22 22 0.50 0.54 0.52 0.46 B4 63 14 13 23 0.59 0.61 0.60 0.39 RUBiS
TABLE VII: Undetected anomalies for Hadoop.
Method Undetected anomalies
CloudPD 1disk hog +2application misconfig. (total3)
B1 2network hog +2disk hog +2cache hog +2application misconfig. +2invalid VM sizing +3invalid VM migration (total13) B2 2application misconfig. (total2)
B3 2disk hog +2cache hog +2application misconfig. +2memory hog +1CPU hog +3invalid VM migration (total12)
B4 2disk hog +1cache hog +1memory hog +2application misconfig. +3invalid VM migration (total9)
TABLE VIII: Undetected anomalies for Olio.
Method Undetected anomalies
CloudPD 2disk hog +2application misconfig. (total4)
B1 2network hog +2disk hog +2cache hog +2application misconfig. +2invalid VM sizing +3invalid VM migration (total13) B2 2application misconfig. (total2)
B3 2disk hog +2cache hog +3application misconfig. +2memory hog +1CPU hog +3invalid VM migration (total13)
B4 2disk hog +1cache hog +2memory hog +3application misconfig. +3invalid VM migration (total11)
2) Diagnosis Time and Scalability: Effective diagnosis is
just one of the goals for problem determination in cloud. A dynamic and autonomic system like cloud requires diagnosis to be performed quickly for efficient dispatch of remediation actions. Figure 11 shows the analysis time of each stage
of CloudPD and other base schemes with Hadoop and Olio
benchmarks. The numbers are averaged across the96intervals in the 24-hour experiment. Note that the system state can change every 15 minutes, and hence, remediation is relevant only if performed in time much less than 15 minutes. The
Event Generation EngineofCloudPDtakes on an average17.8
seconds for Hadoop and is executed for every interval, and for every monitored VM and metric. The Problem Determination
Engine is triggered only if an alarm is raised by the Event
Generation Engine. For other intervals, the time taken by
Problem Determination Engineis zero. Hence, although
Prob-lem Determination Enginetakes longer thanEvent Generation
Engine (about 40 seconds for Hadoop), since the latter is
invoked only selectively, the analysis time is lower. The same is true for Problem Diagnosis Engineas it is invoked only if an anomaly is detected, allowing CloudPD to quickly detect faults (time taken only marginally higher than B1 and B3, which detect very few anomalies). In comparison, Oracle B2 has noEvent Generation, and hence, the time spent inProblem
Determination Engine is10X larger than CloudPD. The time
spent analyzing the Olio cluster is lesser compared to Hadoop as the cluster size is smaller. Note that the Event Generation
Engine can be parallelized across multiple VMs, thereby,
reducing the total time spent by CloudPD in this phase. Figure 12 shows the effect of the increase in the number of VMs on the analysis time of CloudPD. The analysis time is shown as histograms with breakup of time taken by each stage across different number of VMs in the Hadoop and Olio
CloudPD B1 B2 B3 B4
Method
Anal
ysis Time (seconds)
0 20 40 60 80 100 120 140 Event Generation Problem Determination Problem Diagnosis CloudPD B1 B2 B3 B4 Method Anal
ysis Time (seconds)
0 20 40 60 80 100 Event Generation Problem Determination Problem Diagnosis
(a) Hadoop analysis time (b) Olio analysis time
Figure 11: Analysis time of each stage ofCloudPD.
clusters. We notice that the analysis time grows sub-linearly with the number of VMs, with the increase in analysis time being mainly in theEvent Generationphase. Further, as noted before, event generation time can be reduced by parallelizing it across different VMs. This experiment establishes the ef-fectiveness of CloudPD’s multi-layer approach, allowing it to scale to larger systems with more VMs and servers.
F. Trace-driven Fault Generation Results: Case Study
Our next set of experiments are conducted to study the effectiveness of CloudPDin a real cloud setting, where cloud configuration actions spontaneously generate faults. Real cloud setting refers to a virtualized platform running production applications, where cloud manager controls activities like VM provisioning/reconfiguration. It emulates real trace (CPU and memory utilization time-series) variations. Our cloud testbed is managed by a cloud management stack that can provision virtual machines and perform dynamic consolidation to reduce power. We used the pM apper consolidation manager [20], which has been studied by multiple researchers and
pro-TABLE IX: Comparing end-to-end diagnosis effectiveness for trace-driven case study. Method # of Correct Normal Detections # of Correct Anomalous Detections # of Correct Event Generations # of Total Predicted Anomalies
Recall Precision Accuracy FAR
CloudPD 67 18 21 24 0.78 0.75 0.77 0.25 B1 58 10 14 25 0.43 0.40 0.42 0.60 B2 67 21 23 27 0.91 0.78 0.84 0.22 B3 60 11 21 24 0.48 0.46 0.47 0.54 B4 60 13 15 26 0.57 0.50 0.53 0.50 3 6 9 15 Number of VMs Anal
ysis Time (seconds)
0 5 10 15 20 25 30 35 Event Generation Problem Determination Problem Diagnosis 1 3 6 Number of VMs Anal
ysis Time (seconds)
0 5 10 15 20 25 30 35 Event Generation Problem Determination Problem Diagnosis
(a) Hadoop VM scaling (b) Olio VM scaling
Figure 12: Effect of VM scaling on the analysis time ofCloudPD.
ductized. The consolidation involves reconfiguration of VM resource allocations as well as changing the placement of VMs on physical servers every 2 hours. The cloud testbed hosts a Hadoop cluster consisting of 10 VMs and an Olio cluster consisting of6 VMs, with4VMs for the web server tier, and 2 VMs for the database tier.
We used two real traces from a production data center of a Fortune 500company running enterprise applications to drive the workload for Hadoop and Olio. The two traces contain a time-series of CPU and memory utilization across the servers, with a data point every 15minutes for a total duration of 24 hours, which is also the duration of our experiment. We built a profile of Hadoop that captured the relationship of workload size with CPU and memory utilization. We similarly created a profile of Olio to capture the relationship of the number of concurrent users with CPU and memory utilization of the Web and database tier. In a given interval, we ran Hadoop with a data size that generates the CPU utilization provided by the trace for that interval. Similarly, we ran Olio with the number of users such that the utilization of the web server matched with what was specified by the trace for that interval. Hence, this experiment captures changes in workload intensity that happen in real clouds. The resource profiles are captured by the following equation obtained through linear regression:
CP U(Olio−W eb) =U sers∗0.1 + 5 CP U(Olio−DB) =U sers∗0.035 + 7.5 CP U(Hadoop) =DataSize∗2.83 + 12.9
(5)
CloudPD independently monitors the cluster and identifies
cloud related anomalies, workload intensity and workload mix changes, as well as application anomalies for 15 minute intervals. We randomly injected anomalies in some of these intervals as listed in Table V. Apart from the injected applica-tion anomalies, we noticed that4intervals experienced invalid VM migrations and7intervals experienced invalid VM sizing anomalies due to cloud reconfiguration (we did not inject any cloud related anomalies). These were determined to be anomalous as the application latency and throughput deviated
by11%and9%for Hadoop and Olio, respectively. The sizing faults were a result of prediction error and the live migration faults were due to high resource utilization on the servers.
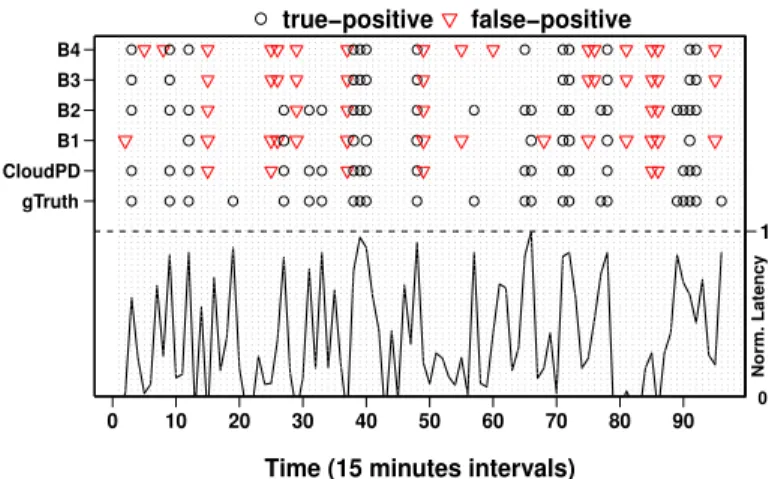
Figure 13 provides a detailed view of the case study. For each of the 96 intervals (shown in the X-axis), the left Y1 -axis shows the ground truth of intervals that had anomalies along with anomaly predictions made byCloudPDand the four baselines. Both correctly identified anomalies (true positives) and non-faulty events wrongly marked as anomalies (false
positives) are marked. On theY2-axis, we plot the normalized
application latency, where a value of 1 denotes the interval with the highest average job latency. Observe that anomalous intervals (marked under gT ruth) have a higher latency than normal intervals. One can observe that B1,B3 andB4 have many false positives, which is consistent with our other studies using synthetic fault injection (Section V-E).
0 10 20 30 40 50 60 70 80 90 gTruth CloudPD B1 B2 B3 B4
Time (15 minutes intervals)
1
Norm. Latenc
y
0 true−positive false−positive
Figure 13: Time-series showing the effectiveness ofCloudPDand
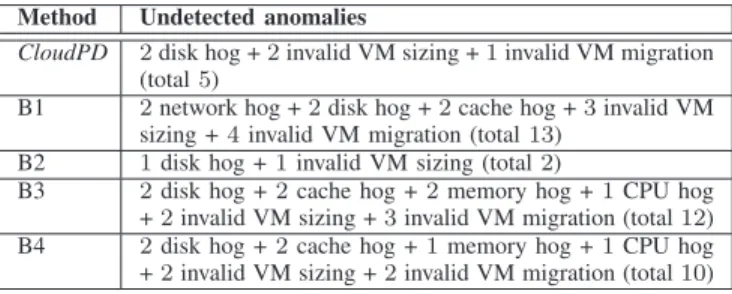
other base schemes in detecting faults in a 24-hour case study. The performance metrics for CloudPD and the baselines in terms of recall, precision, accuracy and false alarm rate (FAR) are summarized in Table IX. CloudPD is able to correctly diagnose 18 out of the 23 anomalous intervals and identify 67 out of the 73 normal intervals as normal. This is close to the performance of baseline B2 and significantly better than the other three baselines. This ability of CloudPD is due to its unique characteristic to better manage and deal with shared resources such as disk and cache in segregating cloud anomalies from application faults and normal workload change. Table X lists the undetected anomalies by CloudPD
and the baselines. CloudPD fails to detect the 2 disk hog anomalies, the reason for which can be attributed to the fact that the VMs share a SAN storage and the deviation of the storage utilization values from normal was not significant enough for the event generation phase ofCloudPDto raise an alarm.CloudPDalso missed detecting2invalid resizing events and an invalid VM migration. These were marginal anomalies which caused the application latency to be high enough to be