Association for Information Systems
AIS Electronic Library (AISeL)
ICEB 2018 Proceedings
International Conference on Electronic Business
(ICEB)
Winter 12-6-2018
The Impact of Big Data Analytics Use on Supply
Chain Performance --- Efficiency and Adaptability
as Mediators
Jao-Hong Cheng
Kuo-Liang Lu
Follow this and additional works at:
https://aisel.aisnet.org/iceb2018
This material is brought to you by the International Conference on Electronic Business (ICEB) at AIS Electronic Library (AISeL). It has been accepted for inclusion in ICEB 2018 Proceedings by an authorized administrator of AIS Electronic Library (AISeL). For more information, please contact
Cheng, J.H. & Lu, K.L. (2018). The impact of big data analytics use on supply chain performance--Efficiency and adaptability as mediators. In Proceedings of The 18th International Conference on Electronic Business (pp.
626-633). ICEB, Guilin, China, December 4-8.
The Impact of Big Data Analytics Use on Supply Chain Performance
--- Efficiency and Adaptability as Mediators
(Full Paper)
Jao-Hong Cheng*, Department of Information Management, Taiwan Yunlin University of Science
and Technology, Douliou, Taiwan, China, [email protected]
Kuo-Liang Lu*, Department of Information Management, Taiwan Yunlin University of Science and
Technology, Douliou, Taiwan, China, [email protected]
ABSTRACT
This paper develops a conceptual model to examine how big data analysis use affect supply chain performance in an omni-channel. A research model is developed which comprises 4 constructs and 4 research hypotheses, the efficiency and adaptability as mediating constructs. The model is tested on data collected from 245 top manufacturing firms in Taiwan, using structural equation modeling. The research findings highlight the importance of efficiency and adaptability as mediators for ensuring supply chain performance by reinforcing big data analytics use.
Keywords:Supply chain performance, big data analytics use, efficiency, adaptability *Corresponding author
INTRODUCTION
Supply chain performance is the key determinants of supply chains’ competitive advantages. Performance measurement is defined the process of quantifying both the efficiency and effectiveness of actions taken (Leończuk, 2016). In the retail and part of the business platform start of Omni-channel, the suppliers have not seen a new approach for the status quo. In practice, the previously mentioned foreign Amazon (amazon.com) and part of e-commerce platform has been in the layout, while in Taiwan this kind of case is not much. In addition, the supplier is not obvious on an Omni-channel. In science, we can see the change of many retail channels of literature (Tsai et al., 2015), but almost did not see how the supply chain response (Kumar & Hu, 2015).
Gahbiche, Hadjyoussef, Jemai and Dogui (2016) believe that through the formation of the alliance can improve supply chain performance.
Existing research of the Omni-channel in supply chains reveals that most of the studies of the marketing channel retailing change from multi-channel retailing to Omni-channel retailing that can provide a seamless experience across touch points (Verhoef et al., 2015). Less research has focused on big data analytics use in an Omni-channel for the supply chain to predict the customer
personalized interaction. There have been few studies on the factors that indirectly affect supply chain performance when in strengthening the efficiency and adaptability of speeding up services to customers. To achieve the benefits of supply chain performance for greater competitive advantages, it is essential for all the parties involved to ensure better efficiency and adaptability.
To verify this research model, this study proposes a novel research model to examine is how big data analytics use influencing the efficiency and adaptability and in turn, their impact on supply chain performance. This study will conduct an empirical study on the manufacturers and their partners in the supply chains of Taiwan, and use Structural equation modeling (SEM) with AMOS to analyze the hypothesized relationships of the research model.
The rest of this study is organized as follows. Section 2 provides 2 the effect of big data analytics use on supply chain performance and section 3 provide 3 theoretical framework and hypothesis development. The data collection method and research design are described in section 4, and the study’s findings are presented in section 5. Section 6 provides a discussion of the results and section 7 concludes this study and offers directions for future research.
THE EFFECT OF BIG DATA ANALYTICS USE ON SUPPLY CHAIN PERFORMANCE
Omni-channel Retail
A new fashion retail processes Omni-channel retailing is just beginning concept that lacks the level of process integration in many other vanguard supply chains (Bernon et al., 2016). With the development of science and technology, the retail industry is
changing constantly, and also has a certain impact on the entire supply chain. Researchers have found that access is changing and retailing is constantly breaking old barriers (Verhoef et al., 2015), but how the entire supply chain breaks down barriers
between suppliers to the Omni-channel has been a rare research done in the past. This study will eventually use the definition of Rigby. An integrated sales experience that melds the advantages of physical stores with the information-rich experience of online shopping (Rigby, 2011).
Cheng & Lu
The 18th International Conference on Electronic Business, Guilin, China, December 2-6, 2018
Big Data Analytics (BDA) Use is defined as “use in primary supply chain activities (i.e., purchasing, production, distribution, customer service) that can generate business insights and it impacts organizational competitive advantage according to the dynamic capabilities perspective” (Chen et al., 2015). The other researcher use big data and predictive analytics are divided into
acceptance, normalization and assimilation of the three processes and information sharing and supply chain performance is positively correlated (Gunasekaran et al., 2017). This study will extend the dynamic capability theory used by Chen
(García-Arca et al., 2014) to illustrate the impact of supply chain performance of the Omni-channel.
Efficiency and adaptability in supply chain
Efficiency is defined by Lee et al. (2010), which the extent to which buyers saves their resources from the supply chain activities
with sellers. It also Proof that information sharing has a significant impact on the buyer's efficiency. García-Arca et al. (2014)
think the globalization of sales and suppliers can seriously affect the efficiency and sustainability of the supply chain. Adaptability is defined as an enterprise's perception of the long-term market environment and can the flexibility to adapt the supply chain to change (Eckstein et al., 2015). Another paper has defined process adaptability as adopting adaptive processes
through close engagement with customers (Zhang et al., 2016). The Omni-channel bring efficiency includes the ability for
employees to quickly deliver product information to customers via wireless devices and ship them from locations closest to customers (Motorola, 2013). A framework for comprehension and frequently formally modeling social behavior is according to rational choice theory (Durlauf & Blume, 2008).
THEORETICAL FRAMEWORK AND HYPOTHESIS DEVELOPMENT
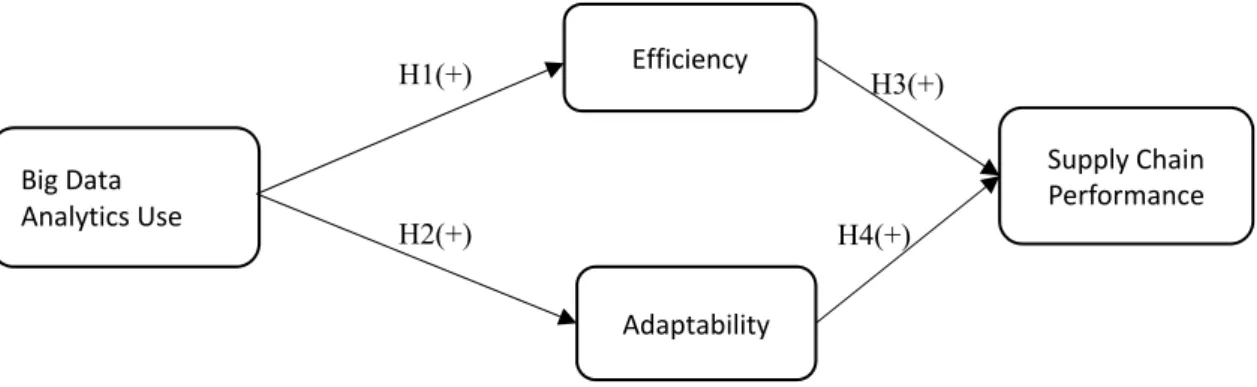
Figure 1 depict the conceptual model with the factors affecting supply chain performance and two mediating factor as mediating effect to efficiency and adaptability on supply chain performance. The arrows indicate the hypothesized relationships.
Figure 1 The research model
The path from big data analytics use to efficiency and adaptability
In the past studies, one of them has shown that big data and predictive analytics can reduce cost and achieve efficiency; it also increases the ability to cooperate in the supply chain relationship (Gunasekaran et al., 2017). Through the big data analytics use
can be used to re-configure the resources to adapt to changes in market supply and demand, that is accurately forecast (D. Q. Chen et al., 2015). Thus, this study think in the Omni-channel driver the big data analytics use may impact efficiency and
adaptability. It is thus hypothesized that:
H1: Big data analytics use is positively related to efficiency. H2: Big data analytics use is positively related to adaptability.
The path from efficiency and adaptability to supply chain performance
In the decade of supply and demand changes, the need to quickly change the strategy, strengthen the efficiency of supply chain partners and adaptability can improve the quality of cooperation and results (Fan, 2014). Partners in the supply chain must be aware that the design and strategic analysis process will affect efficiency (Lichocik, 2013). The adaptability of supplier change to customers is the strategic flexibility factor of supply chain partners (Grant, 1991). As such, it is hypothesized that:
H3: Efficiency is positively related to supply chain performance. H4: Adaptability is positively related to supply chain performance.
RESEARCH METHOD
To develop the survey instrument, a pool of items was first identified from the literature to measuring the constructs of the research model. Then, data from a survey sample were used to assess the instrument’s validity and reliability and test the relationships hypothesized in the research model.
Content validity
All of the measures in the survey instrument were developed from the literature. The English version was developed first, and then translated into Chinese. And at the appropriate, the expression of the items was tailored to the supply chain context, as
Big Data Analytics Use Efficiency Supply Chain Performance Adaptability H1(+) H2(+) H3(+) H4(+)
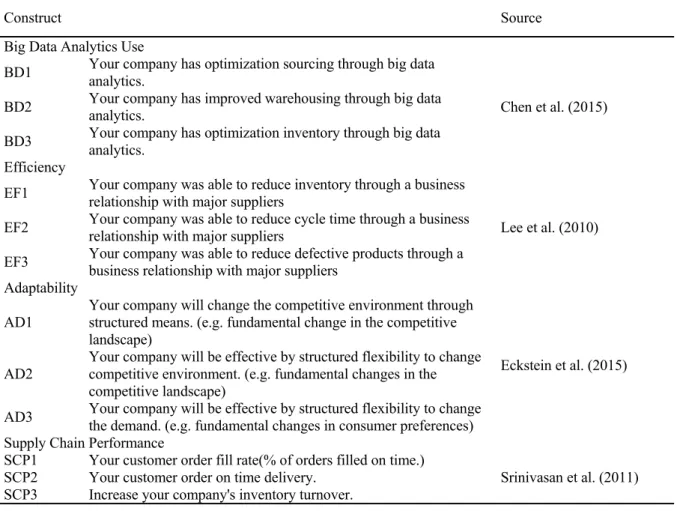
shown in Table1. The items were measured on a 7-point Likert scale ranging from “Strongly disagree” (1) to “Strongly agree” (7).
Table 1 Constructs and measures of the research items
Construct Source
Big Data Analytics Use
BD1 Your company has optimization sourcing through big data analytics.
Chen et al. (2015) BD2 Your company has improved warehousing through big data analytics.
BD3 Your company has optimization inventory through big data analytics. Efficiency
EF1 Your company was able to reduce inventory through a business relationship with major suppliers
Lee et al. (2010) EF2 Your company was able to reduce cycle time through a business relationship with major suppliers
EF3 Your company was able to reduce defective products through a business relationship with major suppliers Adaptability
AD1 Your company will change the competitive environment through structured means. (e.g. fundamental change in the competitive landscape)
Eckstein et al. (2015) AD2
Your company will be effective by structured flexibility to change competitive environment. (e.g. fundamental changes in the competitive landscape)
AD3 Your company will be effective by structured flexibility to change the demand. (e.g. fundamental changes in consumer preferences) Supply Chain Performance
SCP1 Your customer order fill rate(% of orders filled on time.)
Srinivasan et al. (2011) SCP2 Your customer order on time delivery.
SCP3 Increase your company's inventory turnover.
Pre- and pilot-tests
Two industry seniors and four Ph.D. students were asked for pre-test a 12-item questionnaire and provide feedback on the content and appearance of the survey instrument. This study sought to choose respondents who were expected to have the best knowledge about the operation and management of the inter-organizational relationships between their manufacturing firm and its suppliers or subcontractors.
Data collection and respondents’ profiles
This empirical study targeted the top 2500 manufacturing enterprises in Taiwan selected from the directories of the 2015 Chinese Credit Information Service (Taiwan’s leading credit company). This study sought to choose respondents who were expected to have the experience about the operation and management of the inter-organizational relationships between their manufacturing firm and its suppliers or subcontractors.
We sent the paper questionnaire directly to all 2500 manufacturing companies and invited the general manager of the company to participate in the study. There were 821 companies willing to participate in the study. A total of 245 usable responses were collected from function managers or other members of the senior management teams, such as general managers, vice presidents, or CEOs. This resulted in a sample size of 245 with a response rate of 29.8%.
DATA ANALYSIS AND FINDINGS
Software AMOS 21.0 was used to conduct structural-equation modeling (SEM) to test and analyze the relationships hypothesized in the research model.
Assessment of the measurement model
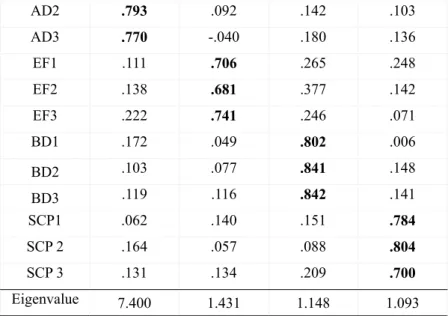
This study performed exploratory factor analysis using principal axis factoring to ascertain whether our items loaded onto a common latent factor. First, the 12items in the survey instrument were analyzed to assess their dimensionality and measurement properties. Analysis of their eigenvalues suggested a four-factor solution, with factors comprising big data analytics use, efficiency, adaptability and supply chain performance. Using an exploratory factor analysis, all of the items were found to perform well and were thus retained in the model, as shown in Table2.
Table 2 Results of exploratory factor analysis
AD EF BD SCP
Cheng & Lu
The 18th International Conference on Electronic Business, Guilin, China, December 2-6, 2018
AD2 .793 .092 .142 .103 AD3 .770 -.040 .180 .136 EF1 .111 .706 .265 .248 EF2 .138 .681 .377 .142 EF3 .222 .741 .246 .071 BD1 .172 .049 .802 .006 BD2 .103 .077 .841 .148 BD3 .119 .116 .842 .141 SCP1 .062 .140 .151 .784 SCP 2 .164 .057 .088 .804 SCP 3 .131 .134 .209 .700 Eigenvalue 7.400 1.431 1.148 1.093
The χ2 value of the measurement model was significant (χ2 =71.599, df =47p < 0.001), and the value of (χ2/df=1.526) was smaller than 2, indicating an ideal fit (Bentler, 1990). The large χ2 value was not surprising because the χ2 statistic has been shown to be directly related to sample size (Jöreskog & Sörbom, 1993). An assessment of the measurement model suggested an acceptable model fit (GFI =0.956; AGFI =0.926; CFI =0.985; NFI =0.959; RMSEA =0.046; SRMR =0.0373).
This measurement model was carried out by two steps. The first step assesses reliability and convergent validity, and the second step is for discriminant validity. Reliability is assessed by the criterion, Cronbach’s α-value larger than 0.7 (Chin, 1998). To assess the reliability of the constructs, a composite reliability (CR) test was performed.Item loadings range from0.855 to0.883. All of the CR values, ranging from a low of 0.843 to a high of0.884, exceeded the recommended cut-off value of 0.8. Each variable’s squared multiple correlations (SMC) is the proportion of its variance that is accounted for by its predictors. The average variance extracted (AVE) was greater than 0.5 in all cases, meaning that the variance accounted for by each of the constructs was greater than the variance accounted for by the measurement error (Hair et al., 1995; Jöreskog & Sörbom, 1993). Table 3
summarizes the assessment results of the measurement model.
Table 3 Convergent validity
Assessment of the structural model
Table 4 shows the inter-correlations between the five constructs of the structural model. An assessment of the discriminant validity between the constructs supported the model fit. Discriminant validity between constructs is assessed using the criterion that the square root of AVE for each construct should be larger than its correlations with all other constructs (Fornell & Larcker, 1981). The overall fit of the structural model was acceptable because all of the measures of fit reached an acceptable level (χ2 =71.599, df =47, ⍺ = 0.000; GFI =0.956; AGFI =0.926; CFI =0.985; NFI =0.959; RMSEA =0.046; SRMR =0.0373). the skewness and kurtosis indexes of all the items were lower than 2, and the Mardia’s (1970) coefficient was lower than p (p+2), where p is the number of items of individual construct, indicating that there is multivariate normality (Bollen, 1989; Bollen & Long, 1993). The use of Mardia’s coefficient to test multivariate normality follows previous studies (Menor & Roth, 2008; Nikolaos Tsigilis et al., 2004).
Table 4 Discriminate validity
Construct num. Item means Item Standard deviations Loadings Item AVE Congeneric reliability Cronbach's Alpha Big Data Analytics Use 3 4.973 0.933 0.802-0.842 0.717 0.884 0.883 Efficiency 3 5.310 0.893 0.681-0.741 0.641 0.843 0.843 Adaptability 3 5.333 0.764 0.770-0.795 0.682 0.865 0.863 Supply Chain Performance 3 5.347 0.779 0.700-0.804 0.713 0.878 0.855 Construct (1). (2) (3) (4)
(1)Big Data Analytics Use 0.847
Common method bias
Common method bias results from the collection of various data from a single source (Podsakoff et al., 2003). Following the
suggestion made by Podsakoff et al. (2003), this study applied several procedural and statistical mechanisms to avoid and check
for this potential problem. With respect to procedural mechanisms, the respondents were encouraged to provide accurate responses by being assured of anonymity and of the confidentiality of their answers (Nell & Ambos, 2013). We also distributed items pertaining to the same constructs in different parts of the questionnaire (Salvador et al., 2014).
CFA marker technique was one of the most widely used statistic techniques to address the issue of common method variance (Williams et al., 2010). In line with the recommendations of Williams et al. (2010), we selected supply chain performance as a
marker variable because it has the weakest relationships to other variables. The results showed that Method-R model was not superior to the Method-U model (Δχ2 =57.362, Δdf =7, p<0.005). This assessment offered evidence that no significant variance attributable to method effects. Thus, the results indicated that common method bias did not appear to be a problem in the study.
Multi-group analysis
Using the findings of the returned questionnaires, we attempted to explore the formation of relationships between the perspectives of manufacturers and subcontractors. The average total sales revenue and industry measurements were expected to have either positive or negative effects. The 245 usable responses were divided into two groups (larger sized firms in Group 1 and smaller sized firms in Group 2) in two different models shown in Tables 11To examine the differences between the parameters of the two groups, a statistical comparison was made following the multi-group procedure suggested by Jöreskog and Sorbom (1993). The procedure of each individual path was separately examined across groups to determine whether the estimated coefficients for each group were using a χ2 difference test. The path coefficients of both groups were then separately analyzed using a multiple group analysis to assure that the model’s goodness of fit was similar for both.
According to the returned questionnaires, manufacturers and subcontractors’ average total sales revenue was less than NT$1 billion (46.5% collaboration items), which indicated that more than half of the firms were small and medium in size. Thus, the average total sales revenue for the firms in Group 1 was less than NT$1 billion, whereas that of the firms in Group 2 was more than NT$1 billion. The fit indices for Group (χ2/df =1.55, GFI =0.917; AGFI =0.859; CFI =0.971; NFI =0.924; RMSEA =0.034;
SRMR=0.0536) were acceptable. The estimation results showed that the differences between the two groups were significant. The findings revealed that big data analytics use had a more significant associated with efficiency in Group 1 (γ =0.56, t =5.359, p<0.001)than in Group 2 (γ =0.69, t =5.325, p<0.001). Big data analytics use had a more significant associated with adaptability in Group 2(γ =0.28, t =2.498, p=0.012) than in Group 1 (γ =0.54, t =5.522, p<0.001). Efficiency had a more significant associated with supply chain performance in Group 1(γ =0.23, t =2.172, p=0.030) than in Group 2 (γ =0.39, t =3.176, p<0.001). Adaptability had a more significant associated with supply chain performance in Group 2 (γ =0.19, t =1.512, p=0.130) than in Group 1(γ =0.39, t =3.570, p<0.001).
According to the returned questionnaires, the manufacturers and subcontractors indicated that more than half of the firms were related to the electronics/communication industry (37.14% of the collaboration items). The 245 usable responses were divided into two groups, with electronics/communication industry-related collaborations in Group 3 and collaborations in other industries in Group 4. The estimation results showed that the differences between the parameters of the two groups were significant. The findings revealed that big data analytics use a more significant associated with efficiency in Group 3 (γ =0.67, t =5.501, p<0.001) that was less significant in Group 4 (γ =0.52, t =4.723, p<0.001). Big data analytics use had a more significant associated with adaptability in Group 4 (γ =0.51, t =4.741, p<0.001) than in Group 3 (γ =0.35, t =3.441, p<0.001). Efficiency had a more significant associated with supply chain performance in Group 4 (γ =0.32, t =2.895, p=0.004) than in Group 3 (γ =0.22, t =1.917, p=0.055). Adaptability had a more significant associated with supply chain performance in Group 3 (γ =0.37, t =2.913, p=0.004) than in Group 4(γ =0.28, t =2.434, p=0.015).
Hypotheses testing
In the SEM analysis, the relationships among the independent and dependent variables were assessed simultaneously via a covariance analysis. Maximum likelihood (ML) estimation was used to estimate the model parameters, with the covariance matrix as data input. The ML estimation method has been described as being well suited to theory testing and development (Anderson & Gerbing, 1988; Jöreskog & Sörbom, 1993).
The big data analytics use (H1: γ =0.60, t =7.453, p<0.001; H2: γ =0.43, t =5.972, p<0.001), efficiency (H3: γ =0.30, t =3.760, p<0.001) and adaptability (H4: γ =0.30, t =3.666, p<0.001) had significantly positive effects on supply chain performance. Thus, all of our hypotheses were supported. The coefficient of determination (R2) is computed to assess the predictive power of the
structural model. Overall, the model explains 43.5%of the variance in efficiency (R2=0.435), 59.8%of the variance in adaptability
(R2=0.598) and 30.7%of the variance in supply chain performance (R2=0.307).
(3)Adaptability 0.377** 0.504** 0.826
Cheng & Lu
The 18th International Conference on Electronic Business, Guilin, China, December 2-6, 2018
***denotes significance at α = 0.001; **denotes significance at α = 0.01; *denotes significance at α = 0.05
Figure 2 the structural model DISCUSSION
Consistent with our hypothesis, the results of the analyses suggest that big data analytics use, are all positive related to efficiency, which is consistent with previous studies on various frontiers (e.g., Gunasekaran et al., 2017; Schoenherr & Speier-Pero, 2015;
Zhang et al., 2016). The finding may suggest Taiwan’s supply chains that in Omni-channel, should through big data analytics
use, to improve efficiency and rapid adaptability. Therefore, the analysis of big data integration among suppliers, communication and mutual complementarity of resources are key factors in improving efficiency. It also used to maintain the organization's activities.
The findings of this study also indicate that big data analytics use, are all positive related to adaptability. In Taiwan’s supply chains, the analytics capability, network capability and response capability of the supply chain partner has important implications for adaptability. This finding is in line with the results of previous research on this subject. (e.g., Eckstein et al., 2015; Fantazy,
Tipu, & Kumar, 2016; Gligor & Holcomb, 2012). This suggests that adaptability among supply chain members will be affected by agility, coordination, cooperation, and coherence between organizations.
The results also suggest that efficiency and adaptability have a positive effect on supply chain performance. Efficiency has a significant impact on supply chain performance consistent with past research (Lichocik, 2013). Together, these findings suggest that when forming inter-organizational relationships in supply chains need to focus on improving efficiency and adaptability in order to improve supply chain performance.
Theoretical implications
With the development of the new research model, the theoretical contributions of this paper to the literature are described as follows. The results of our study contribute to the supply chain performance literature. Under the resource-based theory (RBT), scholars believe that the organization has control of entity capital, human capital and organizational capital can improve the efficiency and effectiveness of operations, which also includes the ability to implement the combination of resources (Barney et al., 2001; Grant, 1991). In addition, this study also changes the dependencies with supply chain partners in response to changes
in the environment through resource dependence theory (RDT) (Aiken & Hage, 1971; Pfeffer & Nowak, 1976). As a result, we are trying to fill gaps in supply chain performance of Omni-channel by using RBT and RDT. For instance, this study links big data analytics use, with efficiency and adaptability, of supply chain performance in exploring supply chain members relationship of inter-organizational. The framework of the model can be applied to other kinds of inter-organizational relationships relate to supply chain performance.
Average total sales revenue
The survey results show that the group1 effect on supply chain performance is affected by big data analysis. Only in the larger sized firms through adaptability effect on supply chain performance. So the finding concludes that larger sized firms will optimize the procurement, inventory and improvement of warehousing through data analysis techniques to achieve improved inventory and production. At the same time, the finding also learn that smaller sized firms are focused on supply chain partners in production and product delivery planning, because smaller sized firms do not have so much resources that larger sized firms can use, even have their own logistics systems.
Industry type
The survey results show that the group4 will affect the supply chain performance due to big data analysis. In the traditional industry, the focus will be placed on the ability to interact with potential partners, because the traditional industries of the same type of smaller sized firm, and is customer-oriented. In the electronics industry, analytical techniques are more aware of the importance of using big data analysis than traditional industries. With information technology, it is also important to aggregate the partners' data and conduct joint planning.
Managerial and practical implications
This study offers multiple insights into managers and practices looking for improving supply chain performance. Supply chain performance is always hot topic, has continued to have many scholars of concern. The most important managerial implication and practical insights are that a better efficiency and adaptability resulting from big data analytics use would help build better supply chain performance.
Big Data Analytics Use Efficiency Supply Chain Performance Adaptability 0.60*** 0.43*** 0.30*** 0.30*** R2=0.598 R2=0.43 R2=0
CONCLUSIONS AND FUTURE RESEARCH
This study offers multiple insights into managers and practices looking for improving supply chain performance. Through the improvement of supply chain performance, we can understand the entire operation strategy and goal is correct.
It is strategically important for firms to understand the factors that supply chain performance within inter-organizational setting of supply chain. In this study of supply chains in Taiwan, our research model investigates the factors influencing inter-organizational supply chain performance at Omni-channel. The finding indicate that big data analytics use, are affect efficiency and adaptability, and it also has significant impact on supply chain performance. When the supply chain partners can have a well interaction and information sharing, can increase the value of each other in order to respond to rapid changes in the market to improve the competitive advantage.
Given the impact of current research on the impact of big data analytics use, the future can further examine other factors that may affect consumer preferences, such as innovative services or logistics management. Future theoretical and empirical studies could explore whether alternative constructs affect big data analytics use, efficiency, adaptability and supply chain performance. In the Omni-channel environment, the demand side to push back to the supplier of the way of big data analytics use, efficiency and adaptability, pioneer of influence on supply chain performance. This study focuses on the supply chain partners how to change due to the rapid demand side, thereby affecting the efficiency, adaptability and supply chain performance.
REFERENCES
[1] Aiken, M., & Hage, J. (1971). The Organic Organization and Innovation. Sociology, 5(1), 63–82.
[2] Anderson, J. C., & Gerbing, D. W. (1988). Structural Equation Modeling in Practice: A Review and Recommended Two-Step Approach. Psychological Bulletin, 103(3), 411–423.
[5] Barney, J., Wright, M., & Ketchen, D. J. (2001). The resource-based view of the firm: Ten years after 1991. Journal of Management, 27(6), 625–641.
[6] Bernon, M., Cullen, J., & Gorst, J. (2016). Online retail returns management: Integration within an omni-channel distribution context. International Journal of Physical Distribution & Logistics Management, 46(6/7), 584–605.
[7] Bollen, K. A. (1989). Structural Equations with Latent Variables (1 edition). New York: Wiley-Interscience.
[8] Bollen, K. A., & Long, J. S. (Eds.). (1993). Testing Structural Equation Models (1 edition). Newbury Park: SAGE
Publications, Inc.
[9] Chen, D. Q., Preston, D. S., & Swink, M. (2015). How the Use of Big Data Analytics Affects Value Creation in Supply Chain Management. Journal of Management Information Systems, 32(4), 4–39.
[10] Chen, I. J., Lee, Y., & Paulraj, A. (2014). Does a purchasing manager’s need for cognitive closure (NFCC) affect decision-making uncertainty and supply chain performance? International Journal of Production Research, 52(23), 6878–6898.
[11] Chin, W. W. (1998). Commentary: Issues and Opinion on Structural Equation Modeling. MIS Quarterly, 22(1), vii–xvi.
[12] Durlauf, S. N., & Blume, L. E. (2008). The New Palgrave: Dictionary of Economics - Springer.
[13] Eckstein, D., Goellner, M., Blome, C., & Henke, M. (2015). The performance impact of supply chain agility and supply chain adaptability: the moderating effect of product complexity. International Journal of Production Research, 53(10),
3028–3046.
[14] Ernez Gahbiche, I., Hadjyoussef, K., Jemai, Z., & Dogui, A. (2016). Analysis of a Stackelberg game between a customer and several cooperating suppliers: stability and efficiency. Supply Chain Forum: International Journal, 17(2), 78–86.
[15] Fan, Y.-H. (2014). Assessing Efficiency and Adaptability in Supply Chains: Preference as a moderator. Department of
Information Management National Yunlin University.
[16] Fantazy, K. A., Tipu, S. A. A., & Kumar, V. (2016). Conceptualizing the relative openness of supply chain and its impact on organizational performance. Benchmarking: An International Journal, 23(5), 1264–1285.
[17] Fornell, C., and Larcker, D. F. (1981). Evaluating Structural Equation Models with Unobservable Variables and Measurement Error. Journal of Marketing Research (18:1), pp. 39-50.
[18] García-Arca, J., Prado-Prado, J. C., & Gonzalez-Portela Garrido, A. T. (2014). “Packaging logistics”: promoting sustainable efficiency in supply chains. International Journal of Physical Distribution & Logistics Management, 44(4), 325–346.
[19] Gligor, D. M., & Holcomb, M. C. (2012). Antecedents and Consequences of Supply Chain Agility: Establishing the Link to Firm Performance. Journal of Business Logistics, 33(4), 295–308.
[20] Grant, R. M. (1991). The Resource-Based Theory of Competitive Advantage: Implications for Strategy Formulation.
California Management Review, 33(3), 114–135.
[21] Gunasekaran, A., Papadopoulos, T., Dubey, R., Wamba, S. F., Childe, S. J., Hazen, B., & Akter, S. (2017). Big data and predictive analytics for supply chain and organizational performance. Journal of Business Research, 70, 308–317.
[22] Hair, J. F., Jr., Anderson, R. E., Tatham, R. L., & Black, W. C. (1995). Multivariate Data Analysis (4th Ed.): With Readings.
Upper Saddle River, NJ, USA: Prentice-Hall, Inc.
[23] Jöreskog, K. G., & Sörbom, D. (1993). LISREL 8: Structural equation modeling with the SIMPLIS command language
(Vol. xvi). Hillsdale, NJ, US: Lawrence Erlbaum Associates, Inc.
[24] Kumar, R., & Hu, M. (2015). Is Your Supply Chain Ready for the Omni-channel Revolution? Supply Chain Management Review, 19(5), 76–78.
[25] Lee, B.-C., Kim, P.-S., Hong, K.-S., & Lee, I. (2010). Evaluating antecedents and consequences of supply chain activities: an integrative perspective. International Journal of Production Research, 48(3), 657–682.
Cheng & Lu
The 18th International Conference on Electronic Business, Guilin, China, December 2-6, 2018
[26] Leończuk, D. (2016). Categories of Supply Chain Performance Indicators: An Overview of Approaches. Business, Management & Education / Verslas, Vadyba Ir Studijos, 14(1), 103–115.
[27] Lichocik, G. (2013). Efficiency of supply chain management. Strategic and operational approach. LogForum, 9(2), 119–
125.
[28] Menor, L. J., & Roth, A. V. (2008). New Service Development Competence and Performance: An Empirical Investigation in Retail Banking. Production and Operations Management, 17(3), 267–284.
[29] Motorola. (2013). Fulfilling Expectations: The Heart Of Omnichannel Retailing.
[30] Nell, P. C., & Ambos, B. (2013). Parenting advantage in the MNC: An embeddedness perspective on the value added by headquarters. Strategic Management Journal, 34(9), 1086–1103.
[31] Nikolaos Tsigilis, Athanasios Koustelios, & Aspasia Togia. (2004). Multivariate relationship and discriminant validity between job satisfaction and burnout. Journal of Managerial Psychology, 19(7), 666–675.
[32] Pfeffer, J., & Nowak, P. (1976). Joint Ventures and Interorganizational Interdependence. Administrative Science Quarterly, 21(3), 398–418.
[33] Podsakoff, P. M., MacKenzie, S. B., Lee, J.-Y., & Podsakoff, N. P. (2003). Common method biases in behavioral research: a critical review of the literature and recommended remedies. The Journal of Applied Psychology, 88(5), 879–903.
[34] Rigby, D. K. (2011, December 1). The Future of Shopping.
[35] Salvador, F., Chandrasekaran, A., & Sohail, T. (2014). Product configuration, ambidexterity and firm performance in the context of industrial equipment manufacturing. Journal of Operations Management, 32(4), 138–153.
[36] Schoenherr, T., & Speier-Pero, C. (2015). Data Science, Predictive Analytics, and Big Data in Supply Chain Management: Current State and Future Potential. Journal of Business Logistics, 36(1), 120–132.
[37] Tsai, T.-M., Wang, W.-N., Lin, Y.-T., & Choub, S.-C. (2015). An O2O Commerce Service Framework and its Effectiveness Analysis with Application to Proximity Commerce. Procedia Manufacturing, 3, 3498–3505.
[38] Verhoef, P. C., Kannan, P. K., & Inman, J. J. (2015). From Multi-Channel Retailing to Omni-Channel Retailing: Introduction to the Special Issue on Multi-Channel Retailing. Journal of Retailing, 91(2), 174–181.
[39] Williams, L. J., Hartman, N., & Cavazotte, F. (2010). Method Variance and Marker Variables: A Review and Comprehensive CFA Marker Technique. Organizational Research Methods, 13(3), 477–514.
[40] Zhang, Y., Gregory, M., & Neely, A. (2016). Global engineering services: Shedding light on network capabilities. Journal of Operations Management, 42–43, 80–94.