Recognition of Hand Drawn Chemical Diagrams
Tom Y. Ouyang and Randall Davis
MIT Computer Science and Artificial Intelligence Lab (CSAIL) MIT Building 32, 32 Vassar Street Room 235,237
Cambridge, MA 02139 ouyang,davis@csail.mit.edu
Abstract
Chemists often use hand-drawn structural diagrams to capture and communicate ideas about organic com-pounds. However, the software available today for spec-ifying these structures to a computer relies on a tra-ditional mouse and keyboard interface, and as a re-sult lacks the ease of use, naturalness, and speed of drawing on paper. In response, we have developed a novel sketch-based system capable of interpreting hand-drawn organic chemistry diagrams, allowing users to draw molecules with a pen-based input device in much the same way that they would on paper. The system’s ability to interpret a sketch is based on knowledge about both chemistry and chemical drawing conventions. The system employs a trainable symbol recognizer incor-porating both feature-based and image-based methods to locate and identify symbols in the sketch. Analy-sis of the spatial context around each symbol allows the system to choose among competing interpretations and determine an initial structure for the molecule. Fi-nally, knowledge of chemistry (in particular chemical valence) enables the system to check the validity of its interpretation and, when necessary, refine it to recover from inconsistencies. We demonstrate that the system is capable of recognizing diagrams of common organic molecules and show that using domain knowledge pro-duces a noticeable improvement in recognition accu-racy.
Introduction
Chemists regularly use diagrams to capture and communi-cate ideas about chemical compounds. Because they de-scribe a molecule’s spatial structure, diagrams can convey information about its chemical properties and potential inter-molecule interactions, and hence are considerably more in-formative than the chemical formula alone. The current state of the art in specifying chemical structures to a computer in-volves a mouse-based interface that relies on the traditional point-click-and-drag style of interaction (e.g., ChemDraw, IsisDraw). These systems do not provide the ease of use, naturalness, and speed of drawing on paper. We believe that if machines are to interact with us in a way that feels
nat-Copyright c2007, Association for the Advancement of Artificial Intelligence (www.aaai.org). All rights reserved.
ural, we will have to bridge this gap between how people naturally express ideas and how computers interpret them.
This paper describes an approach to building a natural and robust sketch understanding system inspired by how people interpret chemical structure sketches. When we examine a sketch, we use a wide range of information: we consider the low level geometry (e.g., individual lines and arcs) and the high level structure (e.g., the relationships between objects), and use our understanding of the semantics of the domain (e.g., what constitutes a valid configuration of atoms in a molecular compound). While some work has explored the first two of these, relatively little effort has been devoted to using knowledge about the domain to better understand and interpret a sketch. To explore this last idea, we have developed a sketch interpretation system that is aware of the rules and knowledge that govern how atoms combine to form compounds. While our implementation currently focuses on hand-drawn chemical diagrams, we believe that the approach presented here is more general and could be extended to other domains as well.
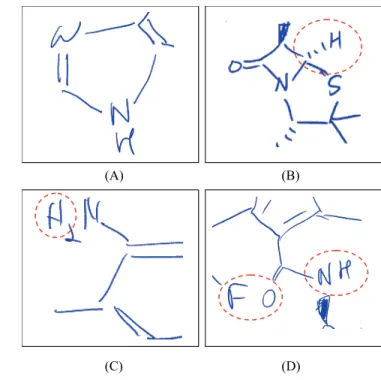
There is a growing body of work on graphical sketch in-terpretation. However, there has been relatively little work that deals with the types of unconstrained, interspersed di-agrams found in chemical structures. Molecular didi-agrams of the sort in Figure 1 present a number of interesting chal-lenges. First, they usually contain extensively intermixed drawing and handwriting (e.g., Figure 2(A)). Second, pars-ing is difficult because different subsets of a spars-ingle set of strokes may be interpreted as different symbols. For exam-ple, in isolation the two vertical lines in the “H” (Hydrogen) symbol in Figure 2(B) can also be interpreted as either a double bond or as part of the neighboring hash bond. Third, freehand drawings of this sort are frequently ambiguous. For example, the circled region in Figure 2(C) can reasonably be interpreted as either an “H” or an “N”. Fourth, the structure intended by the sketch (i.e., which atoms are linked) may not be obvious. In Figure 2(D), the system would need to deter-mine that the “N” and the “H” symbols should be connected while the “F” (Fluorine) and the “O” (Oxygen) should be kept separate, something not obvious from the spatial ar-rangement of the symbols alone.
Many of these difficulties can be resolved by using a com-bination of spatial context (i.e., how a symbol interacts with its surrounding components) and domain knowledge (i.e.,
Elements:
C H N …
Group Abbrev:
Ac Me R …
Aromatic Ring
Straight Bond Wedge Bond Hash Bond Superscripts:
H+O- …
Subscripts
H3 O2 …
Figure 1:(Left) A hand-drawn chemical diagram and (Right) the system’s interpretation of the sketch. (Bottom) Notations used in chemical diagrams. Wedge and hash bonds show the 3-D structure of a molecule: hash bonds angle down beneath the plane, wedge bonds angle up.
rules and constraints that specify what constitutes a valid chemical structure). For example, in Figure 2(C), our sys-tem is able to use its knowledge about chemical valence to correctly identify the circled group of strokes as a hydrogen atom, recognizing that the alternative interpretation ofN2N is not a valid chemical structure.
In the next section we describe how our system uses visual features and domain knowledge to tackle freehand sketches in this challenging domain. Our results show that this system achieves reasonable performance and that domain knowl-edge improves performance.
System Overview
Figure 3 shows the overall sketch interpretation process in our system. Sketch interpretation involves two related sub-problems: ink parsing (i.e., clustering strokes into groups that represent individual symbols), and symbol recognition (i.e., determining what symbol a given group of strokes rep-resents). Rather than doing parsing and recognition as sep-arate steps, our system examines all potential combinations of up to nsequential strokes (currentlyn = 7), using the symbol recognizer to evaluate each group. It then combines the resulting hypotheses about individual symbols to form a complete chemical structure, guided by domain knowledge about how chemical symbols fit together (e.g., two strokes meeting at a T junction cannot be bonds). Finally, it verifies that this structure conforms to its knowledge of chemistry and attempts to correct any inconsistencies.
The system carries out this process as the user draws,
(A) (B)
(C) (D)
Figure 2:Examples illustrating some of the challenges.
providing real-time feedback and updating its interpretation with each new stroke (performance is real time on a 1.5GHz Tablet PC). Once the sketch has been interpreted, the result-ing structure, expressed in a standard chemical specification format, can be passed to a variety of different programs such as ChemDraw (for drawing) or SciFinder (to query its mas-sive database of chemical properties, reactions, etc). Figure 1 shows an example of our system in operation, with the hand-drawn input on the left and the corresponding inter-pretation produced by our system on the right and shows the set of symbols in the graphical vocabulary.
Parsing and Recognition
Symbol Recognition. The first task in interpreting a sketch is to parse the individual pen strokes into groups that rep-resent valid symbols in the domain. As noted, the symbol recognizer evaluates all combinations of up to 7 sequen-tial strokes, identifying each as either one of the symbols in the domain or as an invalid grouping of strokes (the cur-rent limit of 7 strokes is easily changed based on the user and the domain). While using this sliding window assumes that individual symbols are drawn with temporally contigu-ous strokes, we have found in our user observations that this was not a significant limitation. People rarely interspersed symbols when drawing, and in almost all of the cases where it did occur, the author was making a correction or clarifica-tion to a previously drawn symbol.
Our recognizer uses a discriminative classifier based on Support Vector Machines (Vapnik 1995), representing each group of strokes in terms of the set of geometric and statis-tical features listed below. The training data includes sets of strokes corresponding to valid symbols (i.e., atomic element
Alternative Hypotheses Output Interpretation Domain Verification Input Strokes Parsing & Recognition Structure Interpretation
Figure 3:Overview of the system architecture.
letters, straight bonds, hash bonds, and wedge bonds) and in-valid groups, (i.e., groups that contain strokes from multiple symbols or contain only a subset of the strokes in a symbol).
• Number of strokes: This feature takes advantage of com-mon drawing conventions: an “O”(for oxygen), for in-stance, is usually drawn with a single stroke, while hash bonds typically contain at least three strokes.
• Bounding-box dimensions (a vector containing the width, height, and diagonal length of the smallest axis aligned bounding box for the candidate group): Bounding boxes of connectors (e.g., different types of bonds) are typically long and narrow while bounding boxes for element sym-bols are usually rectangular.
• Ink density (the ratio of the amount of ink in the candidate group to the diagonal length of its bounding box): Ink density can help indicate the type of symbol: text symbols and wedge bonds often correspond to regions of high ink density.
• Inter-stroke distance (the maximum distance between in-dividual strokes in the group): This feature can help dis-tinguish letters like “H” and “N” from hash bonds and double bonds.
• Inter-stroke orientation (a vector of the relative orientation of strokes in the candidate group): This feature is useful for identifying symbols made up of many simple strokes (e.g., hash bonds, drawn as a sequence of short parallel line segments).
Variations in drawing styles arise across both different users and different input devices, such as Tablet PC’s and digital whiteboards (e.g., a SmartBoard). As one example, the size of the chemical symbols can vary greatly depending on the users and the environments. To account for these variations, our system employs a preprocessing step to determine the scale of the molecule, based on the length of the straight bonds drawn by the user. Straight bonds were chosen because they are usually the easiest to identify: typically long, isolated line segments. This bond-length
estimate is then used to normalize the geometric features used for symbol classification, making the recognizer less sensitive to differences in scale.
Text Recognition. In order to accurately interpret the range of text notations employed in the chemistry domain, we add to the symbol classification features listed above the output from two independent recognizers. The first is the handwriting recognition system provided by the Microsoft Tablet PC SDK (Microsoft Corporation 2005), which is useful for identifying text symbols such as elements and digit subscripts. However, it often gives false positives for invalid groupings of strokes (e.g., groups containing strokes from more than one symbol). This is likely a result of its training set: it was designed and trained for use on input consisting of words and sentences rather than individual letters and digits.
To alleviate some of the shortcomings of the Microsoft recognizer, we implemented a second, image-based symbol recognizer that compares the candidate stroke group with a set of hand drawn templates for each element symbol in our domain. This recognizer employs a distance metric that is similar to the Tanimoto coefficient, used in (Kara & Sta-hovich 2004), which measures the degree of overlap be-tween two sets of points. We modified the standard Tani-moto metric to take into account the relative angle and cur-vature at each point; this allows the recognizer to better dis-tinguish between symbols such as “H” and “N,” and to be less sensitive to differences in drawing styles. Combining the output from these two recognizers with the features de-scribed above enables our system to accurately distinguish the different symbols in the domain.
Structure Interpretation
Hypothesis Selection. Once our system has generated the set of potential symbols, it examines the local spatial context around each candidate (i.e., the nearby symbols) and applies a set of domain-specific constraints. For instance, a stroke interpreted as a bond should connect two other symbols; a letter representing a chemical element should be grouped with at least one other element or bond (i.e., no dangling atoms); and a number should appear as a subscript to an ad-jacent element symbol, e.g.,CH3.
Yet another complication arises because of a common drawing style: chemists commonly draw a sequence of con-nected bonds using a single stroke (e.g., the ring at the top left of Figure 1). We thus need to segment these strokes into their individual components. Our system does this by com-puting the best poly-line approximation for the stroke using a recursive splitting algorithm that minimizes least squared error.
The output of the parsing and recognition process of-ten contains overlapping candidate symbols that share one or more strokes. Our system ranks these mutually exclu-sive candidates using the recognition and context scores de-scribed above, comparing each one against all of its com-peting interpretations. Next, it iteratively selects candidates which offer the greatest improvement in score over their best competing alternatives. This approach allows the system to
handle ambiguities of the sort in Figure 2(B), correctly rec-ognizing the circled strokes as an “H” because all the alter-natives would require the system to interpret the short hori-zontal stroke as a bond, resulting in a much lower score.
The best consistent set of symbol hypotheses is then passed on to the next stage of the interpretation. The system also records all alternative interpretations generated by this process, for use later in case any part of the sketch requires reinterpretation (discussed below).
Special Notations. We have extended this framework to accommodate two special chemistry notations. First, chemists frequently employ what are termed implicit elements, omitting carbon and hydrogen atoms wherever their presence can be inferred by a knowledgeable viewer. A carbon atom is implied whenever two or more bonds connect without a connecting element, or when a bond is drawn without an attachment at one end. For each implicit carbon, enough implicit hydrogen atoms are assumed to be present to fill any vacancies in its valence shell, so that it will have the requisite four connections. In Figure 2D, for example, the oxygen is double-bonded to an implicit carbon, which is in turn single-bonded to a nitrogen, and single-bonded to another carbon (in the ring).
The second special notation involves indicating an aro-matic ring by drawing a circle inside a hexagon, as in Fig-ure 1. These rings represent hydrocarbons with six carbon atoms connected by alternating single and double bonds. To handle this notation, the system recognizes a circle inside a 6-carbon cycle as part of an aromatic ring symbol, rather than as an oxygen atom.
Domain Verification
The system next determines whether its initial structure is chemically sound. One indication of a problem is an ele-ment with an incorrect number of bonds. For example, a hy-drogen atom can have only one bond, while a nitrogen atom has three. An inconsistency in the current interpretation can arise from three possible problems: a misinterpreted symbol (e.g., mistaking an “H” for an “N”), a mistake in the connec-tivity (e.g., failing to connect a bond to the proper element), or an error in the parsing (e.g., failing to combine strokes that belong to the same symbol).
The system attempts to correct any such inconsistencies by considering each of the possible causes in turn. Because we store alternatives hypotheses from the previous stages of the interpretation process, this task involves simply search-ing the space of relevant alternatives. If an element is found with an incorrect final valence number, the system reconsid-ers the element itself (perhaps interpreting it as a different element symbol that does match the valence information), as well as any bonds or elements that are connected to it. The system evaluates each of these alternative hypotheses, recreating the structural interpretation as needed to accom-modate the changes. If the alternative hypothesis is able to correct the inconsistency without introducing any new er-rors, it is accepted and the system repeats the process for any remaining problems.
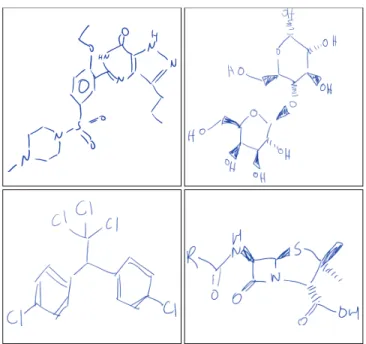
Figure 4:Sample sketches from the user study.
The system can also choose not to correct a domain in-consistency if the confidence of its original interpretation is much higher than that of any of the alternatives. This is done for two reasons. First, the user may still be modify-ing the sketch, so any inconsistencies in the structure may be only temporary. Second, chemists at times intentionally leave structures incomplete, and hence inconsistent, when they know what the remainder is. It would be tiresome to use a system that insisted on complete structures; hence we allow inconsistent structures if they have the highest score.
Evaluation
Data Collection
Our goal for the evaluation was to test the performance of our system on sketches that were as unconstrained as those people produce when drawing on paper. To collect these sketches, we recruited six participants who were familiar with organic chemistry and asked each of them to draw 12 pre-specified molecular compounds on a Tablet PC. The data collection program was designed to behave like a piece of paper, i.e., capturing the sketch but providing no recogni-tion or feedback. During the study, a reference diagram of the molecule to be drawn was presented at the upper right corner of the tablet display, but it disappeared whenever the user’s stylus came near the drawing surface. This was done to indicate what was to be drawn without requiring that the user knew the structure from memory, yet prevent them from simply copying the reference image.
We believe this provided a stringent, real-world test, in-hibiting the tendency of users to draw more carefully when they know their strokes are being interpreted. It also avoids the tendency for users to adapt their drawing style to the recognizer when they see their strokes being misinterpreted.
Domain Baseline Method P R F P R F User 1 0.89 0.92 0.90 0.82 0.86 0.84 User 2 0.87 0.91 0.89 0.85 0.85 0.85 User 3 0.81 0.86 0.83 0.83 0.87 0.85 User 4 0.85 0.89 0.87 0.78 0.82 0.80 User 5 0.92 0.92 0.92 0.85 0.87 0.86 User 6 0.81 0.86 0.84 0.74 0.83 0.78 Overall 0.86 0.89 0.87 0.81 0.85 0.83 Table 1:Performance of the domain knowledge and baseline sys-tem for each participant in the user study.
Sketch Baseline Domain
Figure 5: A sketch where chemistry knowledge allowed the sys-tem to recover from initial errors in recognition.
Examples of the sketches collected during this evaluation are shown in Figure 4.
Experiments
We evaluated our system by running it on each of the collected sketches, treating the remaining eleven examples from the same users as training data. The results are dis-played in Table 1. Performance of the system is measured by the number of symbols identified correctly in each sketch; we report the precision, recall, and F-measure. To be con-sidered a true positive, a retrieved symbol needs to match both the location (stroke grouping) and the classification (la-bel) of the ground truth. We also compare our system’s per-formance against a simplified baseline version that has no knowledge of chemical valence and hence does not attempt to correct chemical inconsistencies.
Analysis
The results show an overall improvement in performance for five of the six users when the system uses chemistry do-main knowledge to improve its interpretation. The system reduced the overall error rate, as measured by the recall, by 27 percent over the baseline. Using paired t-tests, we find that our system significantly outperforms the baseline ver-sion (p < .05).
Figure 5 shows one of the examples where domain knowl-edge allowed the system to recover from initially mistaking the two “N” symbols as groups of 3 bonds. This misinterpre-tation resulted in 5 bonds being connected to an implicit car-bon, a structure inconsistent with the chemical rules regard-ing valence. The chemistry verification component noted this error and correctly reinterpreted the strokes.
(A) (B)
Figure 6:Irregularities in drawing style not currently handled.
An inspection of the output revealed that many of the re-maining mistakes were caused by symbols that the system was unable to parse correctly. For example, in Figure 6(A) on two separate occasions the author drew a single bond us-ing two strokes (highlighted by the dashed circles). Our sys-tem currently assumes that straight bonds are drawn with at most one stroke, and as a result classified the two strokes as two individual, connected bonds. In Figure 6(B), the user over-traced one of the bonds (in the dashed circle), caus-ing the system to incorrectly interpret the stroke as two con-nected bonds. Unlike letter symbols, we do not currently use a combined geometric and template based feature set when analyzing straight bonds. Mistakes like those in Figure 6 suggest that it may be useful to do so in the future.
Related Work
Recently there has been a great deal of interest in sketch recognition systems (Hammond & Davis 2003; Sezgin & Davis 2005). Graph based techniques (Calhounet al.2002) model geometric primitives (e.g., lines and arcs) and the re-lationships between them as graphs, with recognition posed as a graph isomorphism problem. (Shilman et al. 2002) presented an approach that uses a hand coded visual gram-mar to describe shapes in the domain. Recognition is then treated as a statistical visual language parsing problem. (Al-varado, Oltmans, & Davis 2002) proposed an approach that uses dynamically constructed Bayesian networks to parse a sketch, employing both top-down and bottom-up interpreta-tion. (Shilman & Viola 2004) presented a system for rec-ognizing and grouping text and graphics in diagrams and equations. Their approach links individual strokes into a proximity graph and searches for symbols among spatially connected subgraphs. In contrast to our system, their ap-proach was evaluated on synthetically generated geometric shapes, flowcharts, and equations, and does not use domain knowledge to refine its interpretation.
(Gennari, Kara, & Stahovich 2005) developed a sketch based interface that uses geometry and domain knowledge to interpret hand drawn electronic circuit diagrams. They employ a set of geometric heuristics (e.g., density, bound-ing box size, presence of arcs, etc.) and domain constraints (e.g., number of connections) to guide hypotheses selection and error correction. (Kurtoglu & Stahovich 2002)
pre-sented a similar approach that relies on physical reasoning to resolve ambiguities in sketches of mechanical devices and electronic circuits. In addition to enforcing consistency be-tween pairs of connected components (e.g., a wire cannot connect to a bearing because one is an electrical device while the other is a mechanical one), it uses qualitative simulation to choose between multiple possible interpretations of the sketch. Their system avoids the parsing problem by requir-ing users to press a button to indicate that a symbol has been completed.
While these systems have demonstrated that domain knowledge can be used to overcome ambiguities, our ap-proach differs in both the recognition process and the types of sketches considered. In order to interpret the inter-mixed drawing and handwriting found in molecular dia-grams, our system employs both geometric features and tem-plate matching to parse and recognize symbols in the sketch. It also uses contextual hypothesis evaluation and automatic error correction to deal with the additional challenges in in-terpreting the spatial structure of chemical diagrams (e.g., aromatic rings, implicit chemical notations, sources of am-biguity shown in Figure 2).
There have also been efforts to recognize chemical sketches and diagrams. (Tenneson & Becker 2005) devel-oped a sketch-based system that helps students visualize the three dimensional structure of an organic molecule. Unlike our system, it avoids the ink parsing problem by requiring that all symbols be drawn using a single stroke. It also does not handle implicit structure such as omitted carbon and hy-drogen atoms. (Caseyet al. 1993) developed a system for extracting chemical graphics from scanned documents, but that work focused on printed chemical diagrams rather than freehand drawings. Also, unlike our system their approach did not handle non-planar chemical notations such as wedge or hash bonds.
Conclusion and Future Work
In this paper we presented a sketch recognition system de-signed to interpret hand drawn chemical diagrams. We have shown that the system is capable of recognizing common or-ganic chemistry notations and is able to use domain knowl-edge to improve its interpretation of the sketch. Our sys-tem uses a trainable symbol recognizer to locate and iden-tify symbols in the sketch. The recognizer incorporates both feature-based and image-based methods, allowing it to more reliably interpret messy sketches that contain artifacts such as noisy or over-traced strokes. Analysis of the region sur-rounding each symbol allows the system to choose among competing interpretations and determine an initial structure for the molecule. Knowledge of chemistry, in particular chemical valence, then enables the system to check the va-lidity of its interpretation and if necessary revise it to recover from errors.
For our future work, we would like improve the perfor-mance of the system when dealing with messy sketches such as those in Figure 6 by expanding the template-based com-ponent of the symbol recognizer. Also, while the system is aimed primarily at chemists and other researchers, we believe that it could also be used in chemistry education,
for example as a learning aid in a high school chemistry classroom. As a student draws on a smart whiteboard, the system would provide real time feedback about improper bond structures, present a three dimensional visualization of the molecule, or animate a reaction. We are also currently working provide more real time feedback about the chemi-cal compound as the user sketches, such as providing a con-tinuously updated list of properties like atomic weight and automatically identifying parts of the molecule that may be toxic or dangerous.
Acknowledgements
This research was performed under an appointment to the U.S. Department of Homeland Security (DHS) Graduate Fellowship Program and was supported in part by Pfizer, Inc.
References
Alvarado, C.; Oltmans, M.; and Davis, R. 2002. A frame-work for multi-domain sketch recognition. InAAAI Spring Symposium on Sketch Understanding1–8.
Calhoun, C.; Stahovich, T. F.; Kurtoglu, T.; and Kara, L. B. 2002. Recognizing multi-stroke symbols. InAAAI Spring Symposium on Sketch Understanding15–23.
Casey, R.; Boyer, S.; Healey, P.; Miller, A.; Oudot, B.; and Zilles, K. 1993. Optical recognition of chemical graphics. Document Analysis and Recognition627–631.
Gennari, L.; Kara, L. B.; and Stahovich, T. F. 2005. Com-bining geometry and domain knowledge to interpret hand-drawn diagrams.Computers and Graphics29(4):547–562. Hammond, T., and Davis, R. 2003. Ladder: A language to describe drawing, display, and editing in sketch recogni-tion. InProceedings of the IJCAI 2003.
Kara, L. B., and Stahovich, T. F. 2004. Hierarchical pars-ing and recognition of hand-sketched diagrams. In Pro-ceedings of UIST 200413–22.
Kurtoglu, T., and Stahovich, T. 2002. Interpreting schematic sketches using physical reasoning. In AAAI Spring Symposium on Sketch Understanding78–85. Microsoft. 2005. Microsoft windows xp tablet pc edition software development kit.
Sezgin, T. M., and Davis, R. 2005. Hmm-based efficient sketch recognition. InProceedings of IUI 2005281–283. Shilman, M.; Pasula, H.; Russell, S.; and Newton, R. 2002. Statistical visual language models for ink parsing. InAAAI Spring Symposium on Sketch Understanding.
Shilman, M.; and Viola, P. 2004. Spatial recognition and grouping of text and graphics. InEUROGRAPHICS Work-shop on Sketch-Based Interfaces and Modeling.
Tenneson, D., and Becker, S. 2005. Chempad: Generating 3d molecules from 2d sketches. InACM SIGGRAPH 2005 Posters.
Vapnik, V. N. 1995. The nature of statistical learning the-ory. New York, NY, USA: Springer-Verlag New York, Inc.