The Australian Journal of Agricultural and Resource Economics, 50, pp. 131– 152
Blackwell Publishing, Ltd. Oxford, UK AJAR
The Australian Journal of Agricultural and Resource Economics 1364-985X
2006 Australian Agricultural and Resource Economics Society and Blackwell Publishers Ltd March 2006
50 2
ORIGINAL ARTICLE
A milk components model of the AUSFTA J. M. Alston et al.
Supply and demand for commodity components:
implications of free trade versus the AUSFTA
for the US dairy industry*
Julian M. Alston, Joseph V. Balagtas, Henrich Brunke
and Daniel A. Sumner
†During the negotiations on the Australia–US free trade agreement (AUSFTA), the US dairy industry vigorously opposed opening the US market to imports of Australian dairy products on the grounds that the US industry would be devastated. Subsequently, the agreement signed in February 2004 made an exception for dairy, providing for only limited quota expansion and no free trade, even at the end of the long imple-mentation period. This paper presents a simulation model of world dairy markets, represented by supply and demand equations for fat and non-fat components of milk and manufactured dairy products. We use the model to analyse the effects on US milk markets of both a hypothetical agreement, allowing free bilateral trade in dairy products, and the actual AUSFTA. An important contribution to the literature is the derivation of explicit supply and demand relationships for milk components. The components model allows an analysis of long-term production, consumption, and trade patterns that is not tied to specific, fungible products. Simulations indicate that increased imports from Australia resulting from bilateral trade liberalisation would have resulted in small reductions in US milk prices and production. The much smaller increases in Australian access to the US market under the actual AUSFTA will have even smaller, almost negligible, impacts.
Key words: Australia–US trade agreement, components model, dairy.
1. Introduction
In February 2004, negotiators from Australia and the United States reached accord on a bilateral free trade agreement between the two countries. Agricultural commodities, including dairy, sugar, and beef, were central to the negotiations, as US producer groups sought continued protection despite the general movement towards the elimination of all trade barriers between the two countries. In the
* Partial funding for research related to this paper was provided by Dairy Australia. Results and views presented here are those of the authors and not necessarily those of Dairy Australia.
† Julian Alston (email: [email protected]) is a Professor in the Department of
Agricultural and Resource Economics at the University of California, Davis, California, United States and a member of the Giannini Foundation of Agricultural Economics. Joseph Balagtas is an Assistant Professor in the Department of Agricultural Economics at Purdue University. Henrich Brunke is a Postgraduate Researcher at the University of California Agricultural Issues Center. Dan Sumner is the Frank H. Buck, Jr. Chair Professor in the Department of Agricultural and Resource Economics at UC Davis, Director of the University of California Agricultural Issues Center and a member of the Giannini Foundation of Agricultural Economics..
132 J. M. Alston et al.
end, the agreement made specific exceptions for these commodities (see Dee 2004 for a detailed documentation of the provisions of the agreement and some assessment). The result was no improvement in access for sugar and very modest increases in Australian access to US markets for beef and dairy products. In the case of dairy, the United States agreed to slight increases in Australian access through gradual expansion of preferential tariff rate quotas (TRQs). The agreement leaves unaltered the existing over-quota tariff rates for dairy products. This outcome was disappointing to many and surprising to some. At the height of the negotiations, US industry groups argued that opening the US market to imports of Australian dairy products under an Australia–US free trade agree-ment (AUSFTA) would devastate the US dairy industry and rural communities. For instance, the National Family Farm Coalition (NFFC 2004) reported:
According to an analysis prepared by the National Milk Producers Federation (NMPF), the flood of Australian dairy imports into the U.S. resulting from the AUSFTA would force more than 1/4 of the nation’s dairy farmers out of business. In addition, the U.S. would lose more than 10% of the 1.3 million jobs generated by milk production and processing activities. The NFFC is concerned with the threat of economic devastation to rural communities across America as a result of Australian dairy imports. [The] displacement of U.S. milk production will exceed 13% of the total national production. . . . [and] the dollar loss to America’s dairy farmers
will average #2.6 billion per year. . . .
These claims seemed exaggerated. Total Australian milk production was only 14.7 per cent of US production in 2003, and one-fifth of that was dedicated to domestic fluid milk consumption such that Australia’s total production of manufactured dairy products was equivalent to only 11.8 per cent of US milk pro-duction. Nevertheless, the claims went largely unchallenged in the public debate or media in the United States at the time. The organised opposition to freer trade in dairy may have had some influence, especially in an election year in which several key states – such as Wisconsin and Minnesota – were known to have strong perceived interest in the outcomes of the AUSFTA negotiations for dairy. Given the publicity generated by US dairy industry claims, some of the analysis reported in this article was conducted in 2003 to evaluate potential effects of bilateral free trade on the US industry. ACIL (2003) and the Centre for Interna-tional Economics (CIE) (2001) also conducted assessments of a hypothetical free-trade agreement, but from a broader perspective. The specific purpose of our analysis was to develop a quantitative understanding of the implications for the US dairy industry of various policy scenarios that would have resulted eventually in free trade between Australia and the United States. We focused on the impacts of bilateral free trade on the quantity of US imports, the prices of milk components, the quantity of milk produced in the United States, and the farm-level price of US milk. Subsequently, we conducted a corresponding analysis of the implications of the actual AUSFTA signed in 2004 (see CIE
A milk components model of the AUSFTA 133 2004 and Dee 2004 for analysis of the effects of the agreement on the Australian economy more generally).
This article compares the effects of the hypothetical free trade agreement and the actual agreement. To evaluate the impacts of various policy alterna-tives we develop a simulation model of the global market for dairy products, focusing on Australia and the United States as elements of that market. We allow for the fact that much of the potential global dairy market is not open to market-driven trade, and significant trade is largely insulated from market forces by government policy. New Zealand enters the model as a primary competitor for Australia in the more open import markets, which are modelled in aggregate. An innovation of our model is the derivation of explicit supply and demand relationships for milk components (fat and solids-not-fat) rather than traded dairy products themselves. In this approach, the analysis of long-term patterns of dairy production, consumption, and trade is not tied to specific products whose composition and relative proportions will change in response to changes in relative prices of components. This article explains the simulation model in detail and presents and interprets the quantitative findings.
2. An equilibrium displacement model of world trade in dairy components
Our model represents the markets for both raw milk and dairy products in terms of the corresponding implicit markets for the fat and solids-not-fat (snf) com-ponents of milk and dairy products. The model specifies supply and demand equations for each component from four ‘regions’: Australia (A), the United States (U), New Zealand (Z), and the market-based, trade-exposed countries of the rest of the world (R). We include a fifth region (O, representing ‘other’ countries) that interacts with the other four only through managed trade in fixed quantities of dairy products, to impose global market clearing. Domestic and global market clearing is represented by treating the trade in dairy products in terms of the equivalent transactions in fat and snf components, under an assump-tion that the shadow values of these components are equated among products. Authors of a few previous studies have incorporated the component structure of milk and manufactured dairy products in analyses of regional
dairy trade (e.g., Chavas et al. 1998) as well as international trade (e.g., Cox et al.
1999; Lariviere and Meilke 1999; Cox and Chavas 2001; Bouamra-Mechemache
et al. 2002a, 2002b). These studies modelled the supply and demand for
components implicitly by incorporating the component structure of milk and dairy products in equations linking explicit models of supply and demand for milk and supplies and demands for dairy products. However, they did not model the supply and demand for components directly.
In contrast, we derive explicit supply and demand relationships for milk components, which we use to solve explicitly for equilibrium in the markets for components while leaving implicit the supplies and demands for raw milk and dairy products. This innovation permits analysis of dairy trade that is not tied to specific dairy products. The advantages of this feature are many.
134 J. M. Alston et al.
Dairy products are numerous and heterogeneous – for instance, consider the number and variety of cheeses alone, and the range of quality within a variety, such as Cheddar, from a single country. In conventional commodity (rather than component) models, we typically aggregate over differentiated products with a loss of specific detail about the commodities. The widespread use of Armington assumptions, to represent differentiated products, may be seen as a partial correction for the problems associated with such aggrega-tions when the aggregate commodities, and even the elements within the aggregates, are not homogeneous. However, the Armington approach is at best a crude approximation for representing heterogeneous aggregates, and could be seriously misleading if the composition of those aggregates is liable to change over time or in the context of the analysis. The disaggregation of dairy commodities into homogeneous components avoids these aggregation biases, and leaves us free to apply Armington assumptions to represent differences in demand related to country of origin per se. Our approach does involve a loss of information about the implications for the specific products, but in our application that drawback is not a serious one.
Global market-clearing conditions on quantities mean that the total amount of fat and snf in raw milk produced at the farm level, globally, is equal to the total amount of fat and snf in the dairy products sold at whole-sale, globally. Within a country (or region), national market-clearing condi-tions on prices mean that the price of raw milk is determined by the implicit prices and quantities of the fat and snf components in the milk. Similarly, the prices of dairy products depend on the same implicit prices and the product-specific quantities of the fat and snf components, as well as other costs of production. The prices of dairy products (and thus the implicit prices of the components) are linked among countries by price transmission equations, reflecting trade barriers in some instances. Consequently, the supplies of and demands for milk components are linked both within and among countries.
Ratios of fat and snf per unit of raw milk vary somewhat by country, but are not readily responsive to modest changes in relative market prices of the components. Dairy products also contain fat and snf in differing proportions. The composition of individual products is not readily adjustable. However, the proportions of products are flexible in response to relative prices. Hence, the mixture of products produced and consumed in a market adjusts in response to changes in the supply of fat and snf associated with changes in the import or export mix. The model shows how markets respond to specific adjustments in US dairy import barriers holding other US policies in place, in particular, the US price support policy, which modifies both the price and quantity market-clearing conditions. We use linear supply and demand equations. To simplify the presentation, and to make it easier to represent parameters in terms of underlying elasticities of supply and demand and share parameters, in the theoretical development that follows we express the equations of the model in first-difference (or differential) form. In the application, we retain this form and solve for changes relative to a baseline projection of quantities and prices.
A milk components model of the AUSFTA 135
2.1 US-derived supply of fat and snf components
The supply equation for US raw milk (M) as a function of the all-milk price
(P) is:
M = m(P) = b0 + b1P (1)
Market clearing requires linking the prices of products to the price of raw milk, through the prices of their fat and snf components. The all-milk price, which is the incentive price for dairy farmers, is equal to the sum of the values, per hundredweight of milk, of the fat and snf components,
given by the product of the shadow value of fat (Wf) times the quantity
of fat per hundredweight (f) plus the shadow-value of the snf component
(Wn) times the quantity of snf components per hundredweight (n) in raw milk:
P = f Wf + nWn (2)
Federal and state marketing orders set minimum farm prices for milk in the United States. Our representation of milk prices captures the essence of the formulae used by marketing orders to set the minimum prices. Although we do not explicitly model price discrimination as practised by marketing orders, we do capture changes in the all-milk price caused by changes in the shadow values of components. We ignore any changes in the all-milk price caused by a reallocation of milk between fluid and manufacturing uses. Such realloca-tion is negligible for the magnitude of price changes considered here.
Substituting (2) into (1) and totally differentiating yields
dM = b1dP = b1fdWf + b1ndWn (3)
The corresponding changes in total quantities of fat (F) and snf (N)
components produced by the US are given by
dF = fdM = b1f 2dW f + b1fndWn, (4) and dN = ndM = b1nfdWf + b1n 2dW n. (5)
To parameterise these equations, we require information on the fat and
snf component quantities in milk (i.e., f and n), and the slope of milk supply
(b1), which can be defined in terms of the elasticity of supply of milk (ε)
as follows: (6) b M P M P 1 = = . ∂ ∂ ε
136 J. M. Alston et al.
We rearrange equations (4) and (5) to express supply of fat and snf as linear equations that are parameterised in terms of initial, or base, values of the prices and quantities of fat and snf components, and price slopes:
F = FBASE + β
ffdWf + βfndWn (7)
N = NBASE + β
nfdWf + βnndWn (8)
The parameters (own- and cross-price slopes) of the supply equations are defined in terms of the US elasticities of supply for components, and their underlying determinants, for each scenario (or ‘BASE’), as follows:
(9)
where εjk = skε is the elasticity of supply for component j with respect to the
price of component k, sf= WfF /PM is the value of milk fat as a share of
the total value of raw milk, and sn = WnN/PM is the value of snf as a share
of the total value (and sn = 1 − sf). In the Appendix, we derive the supply
parameters expressed in Equation (9).
2.2 US-derived demand for fat and snf components of dairy products
The quantity demanded for each milk product (Xj) depends on its own price and
the prices of the other milk products, and we allow for a total of five products, namely (i) fluid milk (including cream), (ii) cheese, (iii) butter (including but-ter oil), (iv) skim milk powder, and (v) a residual ‘other’ comprising products such as whole milk powder, yogurt, sour cream, ice cream, casein, and so on:
Xi = xi(P1, . . . , P5). (10)
Competitive market clearing is imposed with an assumption that the price of each product, i, is equal to its costs of production or ‘make allowance’
(gi) plus the costs of its fat and snf components, which depend on the
product-specific quantities of those components (fi and ni) and their
market-wide shadow values (Wf and Wn):
β β β β ε ε ε ε ε ε ε ff fn nf nn ff f BASE fn n BASE nf f BASE nn n BASE f f BASE n n BASE f f F W F W N W N W s F W s F W s N W = = BASE n n BASE s N W ε
A milk components model of the AUSFTA 137
Pi = gi + Wffi + Wnni. (11)
The total amount of fat consumed is equal to the sum across the products of the product-specific fat per unit times the number of units consumed; sim-ilarly for snf:
, (12)
and
. (13)
To derive equations for the demands for components as functions of the prices of the components, we replace the product quantities in Equations (12) and (13) with the corresponding demand equations from Equation (10), and use Equation (11) to replace the product prices with the prices of the com-ponents. Before making the substitutions, it is helpful to express the equations in differential form, as follows:
, (14) dPj= fjdWf + njdWn, (15) , (16) and . (17) Substituting (15) into (14), (18)
where the aij are the own- and cross-price demand slopes, which can be defined
in terms of the own- and cross-price elasticities of demand (ηij = dlnXi/dlnPj)
as follows:
(19) Substituting Equations (18) and (19) into Equations (16) and (17) yields
, (20) and F f Xj j j = =
∑
1 5 N n Xj j j = =∑
1 5 dX X P dP a dP i i j j j ij j j = = = =∑
∂∂∑
1 5 1 5 dF f dXj j j = =∑
1 5 dN n dXj j j = =∑
1 5 dXi aij f dW n dW j j f j n = ( + ) =∑
1 5 a X P X P ij i j i j ij = ∂ = . ∂ η dF f f X P dW f n X P dW i j ij i j j i f i j ij i j j i n = + = =∑
= =∑
η∑
∑
η 1 5 1 5 1 5 1 5138 J. M. Alston et al.
. (21)
These equations show changes in the consumption of fat and snf as linear functions of changes in the prices of fat and snf. The coefficients are defined in terms of own- and cross-price elasticities of demand for products, the con-tent of those products in terms of fractions of fat and snf, and the quantities and prices of the products. In practice, we assume that the cross-price elasti-cities of demand among our five broad categories of dairy products are zero
(such that ηij= 0 for i ≠ j). We make this assumption in part to simplify the
expressions, but also because of the general lack of knowledge of cross-price elasticities for dairy products. Much of the published work on dairy demand imposes no substitution between dairy products. Published estimates of cross-price elasticities of US demand for dairy products differ not only in magni-tude but in sign (e.g., Heien and Wessells 1988; Huang 1993; LaFrance 2000).
The resulting demand equations for fat and snf are as follows:
, (22)
and
. (23)
We convert Equations (22) and (23) to linear equations for demand for fat and snf components of milk and dairy products produced and consumed in the United States as follows
F = FBASE + αffdW
f + αfndWn (24)
N = NBASE + αn fdW
f + αn ndWn. (25)
In these equations, quantities demanded are equal to the quantities that
would be demanded with prices at their base values (denoted by ‘BASE’) in
the absence of the AUSFTA plus the changes in quantities that would result
from changes in the prices of components relative to their base values: dWk = Wk
– (Wk)
BASE (k = f, n).
The parameters (own- and cross-price slopes) of the demand equations are defined in terms of the US elasticities of demand for components, and the base values of market prices and quantities, as follows:
(26) dN n f X P dW n n X P dW i j ij i j j i f i j ij i j j i n = + = =
∑
= =∑
η∑
∑
η 1 5 1 5 1 5 1 5 dF f X P dW f n X P dW i ii i i i f i i ii i i i n = + = =∑
2∑
1 5 1 5 η η dN n f X P dW n X P dW i i ii i i i f i ii i i i n = + = =∑
η∑
η 1 5 2 1 5 α α α α η η η η ff fn nf nn ff f BASE fn n BASE nf f BASE nn n BASE F W F W N W N W = .A milk components model of the AUSFTA 139 To implement the model, we use actual 2003 data for prices and quantities produced and consumed, and elasticities of demand for products, according to:
(27)
and these elasticities are held constant across the alternative scenarios. We derive the demand elasticities for components in the Appendix.
2.3 Supply and demand for fat and snf components in global ‘regions’
As noted above, we represent the world with five regions: (i) the United States (U); (ii) Australia (A); (iii) other trade-exposed countries with com-plete price transmission (in this in application, only New Zealand, Z); (iv) somewhat trade-exposed countries (R), having partial but incomplete price transmission; and (v) other countries (O) with zero-price transmission and essentially closed borders for market response to changes in world prices for dairy products. Because trade flows associated with region O do not respond to world prices, the model includes explicit supply and demand equations only for the four trade-exposed regions (A, U, Z, and R). However, we have to take account of the fact that members of the trade-exposed group have transactions with the non-trade-exposed countries (O), which we treat as fixed elements of managed trade for the analysis. These fixed quantities are dealt with as an element of the quantity market-clearing conditions in the trade-exposed group, but the non-trade-exposed countries otherwise do not play any role in the model.
Hence, the model includes supply and demand equations for fat and snf components of milk for each of four trade-exposed regions, and a set of market clearing conditions for prices and quantities. These market clearing conditions reflect: (i) some fixed quantities traded between countries in region O and the trade-exposed countries (in regions A, U, Z, and R), but zero price transmission and hence no changes in quantities traded between O and the other regions; (ii) incomplete price transmission between Australia and the countries in region R; and (iii) complete price transmission between Australia (A) and the United States (U) and between Australia and New Zealand (Z). The supply and demand equations for other regions take the same form as their counterparts derived for the United States above, and are parameterised accordingly. For any region, K (K = A, U, Z, or R), the equations for domestic supply and demand for fat and snf components of milk and dairy products are given by (noting that we have introduced superscripts D and S to represent demand and supply):
η η η η η η η η ff fn nf nn ii f i i i i ii n i i i i i i ii f i i i i ii n i i i i i i W F PX F F W N PX F F W F PX N N W N PX N N = = = = =
∑
∑
∑
∑
, 1 5 1 5 1 5 1 5140 J. M. Alston et al. Demand (28) (29) Supply (30) (31) Following Equation (26), the parameters of the demand equations are defined in terms of the elasticities of demand for components in region K, as follows:
(32)
The elasticities of demand for components in each region are assumed to be equal to those for the United States, which are defined according to Equa-tion (27) and quantified using 2003 data combined with elasticities of dairy product demand from the literature, as described in Sections 3.1 and 3.2:
(33)
The assumption of equal elasticities of demand for components among regions is necessitated by a lack of specific information for non-US countries and regions. These elasticities are determined by component proportions in products that are similar across countries combined with elasticities of demand for dairy products that may vary systematically across countries, especially with changes in per capita incomes. Regions A and Z are reasonably similar to the United States in terms of per capita income and likely elasticity values, while region R encompasses a range of rich and poor countries that are also heterogeneous with respect to other characteristics, perhaps in off-setting ways. Therefore the assumption is not unreasonable and we have little basis for presuming it will lead to biases in one direction or another.
Following Equation (9), the region-specific parameters (own- and cross-price slopes) of the supply equations are defined in terms of the elasticities of supply for components, and their underlying determinants, as follows:
F F dW dW DK DK BASE ff K f K fn K n K (= ) +α +α N N dW dW DK DK BASE nf K f K nn K n K (= ) +α +α FSK FSK BASE ffdWf dW K fn n K (= ) +β +β N N dW dW SK SK BASE nf f K nn n K (= ) + β +β α α α α η η η η ff fn nf nn ff fn nf nn K K K K K DK f K BASE K DK n K BASE K DK f K BASE K DK n K BASE F W F W N W N W = . η η η η η η η η ff fn nf nn ff fn nf nn K K K K U U U U U A Z R = = , ( , , )
A milk components model of the AUSFTA 141
(34)
2.4 Market-clearing conditions
Quantity market-clearing conditions require that total production of fat equals total consumption of fat, globally; similarly, total production of snf equals total consumption of snf. The structure of the supply side of the model assures that these restrictions on the markets for the components mean that the total supply of raw milk also equals the total demand for raw milk. Algebraically, this means that:
FSA+ FSU+ FSZ+ FSR− FDA− FDU− FDZ− FDR= ÏO, and (35)
NSA+ NSU+ NSZ+ NSR− NDA− NDU− NDZ− NDR= NO, (36)
where ÏO and NO are the net imports of fat and snf by region O from the
countries included in the other regions of the model.
The market-clearing conditions on prices entail linkages in terms of both the initial prices and how they differ among countries, and in terms of the changes in prices and how they are transmitted between pairs of countries. Our basic premise is that, initially, the internal US price is higher than that for the com-parable Australian product at the US border, for both fat and snf. Initially, we have the following conditions for prices among the different markets:
, (37)
and
(38)
where TK is the size of the price wedge between region K and world-trading
prices at the US border, for the relevant milk component. We assume price equality between Australia and New Zealand, reflecting their bilateral free-trade agreement and the fact that they compete directly in third countries (although there may still be rents from particular markets, which we treat as being outside the model – that is, we do not identify who receives the rents created by price distortions and managed trade). We allow that prices in Australia and New Zealand may differ from those in region R, to capture both price wedges and partial price transmission.
Once we choose a value for the price transmission parameter, say , the
value of the corresponding price wedge parameter, , is determined, given
β β β β ε ε ε ε ff fn nf nn f n f n K K K K K K SK f K BASE K K SK n K BASE K K SK f K BASE K K SK n K BASE s F W s F W s N W s N W = . Wf W T W W W W T U f A f U f Z f A f R f R f A f R = + ; = ; ( = 1−λ ) + Wn W T W W W W T U n A n U n Z n A n R n R n A n R = + ; = ; ( = 1−λ ) + , λnR Tn R
142 J. M. Alston et al.
our observations of the prices, and . A larger value of λn implies a
smaller degree of price transmission and a correspondingly larger value of
the absolute price wedge, Τn, for a given pair of prices; when λn takes a value
of 1, price transmission is non-existent.
3. Parameters and baseline scenarios
The parameters of the supply and demand equations for fat and snf are defined by underlying elasticities of demand for dairy products, the elasticity of supply of raw milk, the fat and snf components in raw milk and each of the individual dairy products, and the relevant set of ‘base’ values of the prices and quantities of the dairy products and milk. Here we discuss the published estimates of supply elasticities for milk and demand elasticities for dairy products, which we use to compute supply and demand elasticities for fat and snf.
3.1 Elasticities of supply and demand for milk and dairy products
The literature includes a large number and considerable variety of estimates of elasticities of supply of milk and demand for dairy products. Some of the variation among the elasticity estimates reflects differences in the context to which they are meant to apply (i.e., different places, different products at different market levels, or different times) or the concept they are meant to represent (i.e., different lengths of run or different things being held constant), and some of it represents measurement or estimation error. Well-known econometric problems – related to, for example, uncertainty, expectations, dynamics, and time horizons – plague estimates of dairy supply (and demand) functions. Of particular concern is that parameters estimated under specific policy regimes may not apply under different policy regimes and are therefore not directly applicable for analysis of policy change (McDonald and Sumner 2003). These observations are especially pertinent for the present context. We use the supply (and demand) parameters to simulate responses over a comparatively long period of time, to policy changes that can be regarded as fully anticipated and permanent. For this kind of policy change, we require long-run elasticities of the type that generally cannot be estimated directly.
On the demand side, the literature includes estimates of elasticities of final consumer demand, or demand at the wholesale market level for indi-vidual dairy products – such as our product categories of fluid milk, cheese, butter, skim milk powder, and ‘others’ – applicable to various countries and time periods. Such elasticities are sometimes estimated directly using either time-series data (e.g., Wohlgenant 1989) or using cross-sectional data (e.g., Heien and Wessells 1988). Balagtas and Sumner (2003) reviewed the estimates of US elasticities of demand for milk and dairy products in the agricultural economics literature. They reported that estimates of the long-run elasticity
of farm-level demand for fluid-class milk range from −0.34 (Ippolito and
Wn R
Wn A
A milk components model of the AUSFTA 143
Masson 1978) to −0.076 (Helmberger and Chen 1994), and that estimates of
elasticities of farm-level demand for manufacturing milk range from −0.35
(Dahlgran 1980; Helmberger and Chen 1994) to −0.20 (Ippolito and Masson
1978). Heien and Wessells (1988) estimated own-price elasticities of retail
demand of −0.63 for milk, −0.52 for cheese, and −0.73 for butter. We use a
value of −0.5 to represent the most likely value of the own-price elasticity
of demand for each of our product categories at wholesale, between the
Heien and Wessells (1988) values of about −0.6 for retail elasticities, and the
−0.2 that Balagtas and Sumner used for farm-level elasticities. The
cross-price elasticities are all assumed to be zero, as discussed above.
Balagtas and Sumner (2003) also reported a range of supply elasticities for US raw milk production relevant to an intermediate time horizon of 3–6 years in which to allow for adjustment of milk production in response to an expected, permanent change in the relative price of milk. Relevant estimates from the published work include Chavas and Klemme (1986), 0.22 –1.17; Cox and Chavas (2001), 0.37; Ippolito and Masson (1978), 0.4–0.9; Helmberger and Chen (1994), 0.583; Chen et al. (1976), 2.53. In the analysis here, like Balagtas and Sumner (2003), we use 1.0 as our base estimate of the elasticity of supply of raw milk in the United States and region R. For Australia and New Zealand, where dairy is a larger share of total agriculture in the relevant regions, and is pasture-based and therefore land-constrained, our base elasticity is 0.6.
3.2 Derived elasticities of supply and demand for fat and snf components
Combining the elasticities of demand for products with the relevant information on composition of the products (in terms of their fat and snf components) and data on US consumption and prices of these components, we derived the corresponding estimates of the elasticities of demand for components using Equation (27):
(39)
Similarly, on the supply side, using a supply elasticity of raw milk of 1.0, the US component proportions of 3.7 per cent butterfat and 8.7 per cent snf, and 2003 data on US production and prices of fat and snf components of raw milk (discussed below), the matrix of US component supply elasticities is given by
(40) In the absence of complete, specific data on other regions needed to replicate these steps taken with the US data, we expect the elasticities of demand for components for other regions will be similar to those for the United States
η η η η ff U fn U nf U nn U . . . . = −−0 190 09 −−0 120 24 ε ε ε ε ff U fn U nf U nn U . . . . = 0 36 0 520 36 0 52
144 J. M. Alston et al.
and we hold these values constant across the various simulations. As noted, in Australia and New Zealand, we assume as our base case that the elasticity of supply of milk is less elastic, at 0.6, while it is 1.0 in the United States and the rest of the world. A milk supply elasticity of 0.6 implies scaling down all the values in Equation (40) by a factor of 0.6. The elasticities of supply and demand for components are approximately proportional to the underlying elasticities of supply of raw milk and demand for dairy products. Therefore it is straight-forward to examine the implications of alternative elasticity assumptions.
3.3 Baseline quantities and prices
We require projected baseline values for prices, production, and consumption of fat and snf for each of the four trade-exposed regions, for 2014 (i.e., 10 years after beginning to implement an agreement in 2005). In addition, we require current (2003) observations on prices, production, and consumption to define the elasticities of supply and demand for fat and snf. By 2014, any trade reforms resulting from the Doha round of World Trade Organization (WTO) negotiations should begin to have some significant effect on markets. Hence we developed two baselines for 2014, one with and one without a new WTO agreement, based on a combination of: (i) baseline price projections from the Food and Agricultural Policy Research Institute (FAPRI); and (ii) Australian price projections supplied by Dairy Australia. For the non-WTO baseline, we used FAPRI and Dairy Australia price projections, and the price wedges that they imply for products, along with component shares in products, to compute corresponding prices of fat and snf and the price wedges that they imply, as presented in Table 1.
The Doha Round WTO agreement is expected to bring about significant adjustments in world markets for dairy products, although less than global free trade. In particular, we use projections that anticipate some lowering of US internal prices as a reflection of expanded import quantities, and more importantly, an increase in world market prices reflecting a general opening of some import markets and a reduction in the use of export subsidies. Together, these changes will substantially reduce the price wedge between Australia and the United States, greatly reducing the liberalisation remaining in response to the hypothetical bilateral free trade agreement. The reduced price wedge is the result of a significant rise in the Australian fat price, and a slight decrease in the US fat price (Table 1). The baseline data and projections are discussed in more detail in a separate data document (Brunke et al. 2005).
4. Simulation results and interpretations
We compare the effects of complete bilateral liberalisation for dairy and the actual AUSFTA, in each case with and without a Doha WTO agreement. Bilateral free trade in dairy products between the United States and Aus-tralia is modelled by eliminating the wedge between the US and AusAus-tralian
A milk components model of the AUSFTA 145
prices but not eliminating the other wedges. Hence, for the free trade scenario, we alter the market clearing conditions on prices (Equations (37) and (38)) by setting .
The actual AUSFTA allows for only slight, partial opening of the US border to Australian dairy products even by 2014 (with and without a Doha WTO agreement) and does not change tariff rates. We calculate the quantities of fat and snf contained in the increased quota access for Australian dairy products, and model the AUSFTA as the corresponding increases of US imports of fat and snf from Australia.
4.1 Results for complete bilateral liberalisation in 2014
Consider first the columns in Table 2 that show the results for the free trade agreement that did not happen: a complete liberalisation of bilateral Australia– US trade in dairy products by 2014. Column 1 shows that in the absence of a new and significant WTO agreement, free bilateral trade would have a modest impact on US production of milk (and fat and snf, which are
Tf T
U n
U
= =0
Table 1 2014 production and consumption projections used to calibrate the model Trading region Australia (A) United States (U) New Zealand (Z) Other markets (R)
Milk fat (million lbs)
Production without WTO 1282 7382 1643 12 187
with WTO 1336 7365 1712 12 553
Consumption without WTO 727 7485 213 13 528
with WTO 700 7494 205 13 314
Net exports without WTO 555 −103 1430 −1341
with WTO 636 −129 1507 −761
Milk snf (million lbs)
Production without WTO 2745 16 609 3518 27 421
with WTO 2860 16 571 3665 28 244
Consumption without WTO 1524 16 379 1285 31 534
with WTO 1497 16 388 1263 31 298
Net exports without WTO 1221 230 2233 −4113
with WTO 1363 183 2402 −3054
Prices (#/lb)
Milk fat without WTO 1.290 1.590 1.290 1.440
with WTO 1.540 1.580 1.540 1.560
Milk snf without WTO 0.840 0.840 0.840 0.840
with WTO 0.840 0.840 0.840 0.840
Note: The Doha WTO case envisions moderate trade reform equivalent to elimination of export subsidies, moderate reform of domestic subsidy and 50 per cent increases in market access by tariff cuts and expansion of TRQs (Babcock et al. 2002, 2003). Projections of US milk production and milk prices in 2014 without a Doha WTO agreement are extrapolations of the FAPRI 2004 baseline. Projections of production and consumption of milk components in the ‘with WTO’ scenarios result from our projected changes in component prices (relative to the ‘without WTO’ scenario), along with the component supply and demand elasticities derived in the text.
146 J. M. Alston et al.
produced in fixed proportions in milk): a decrease of about 2.1 per cent. This is associated with a 2.1 per cent decrease in the price of raw milk, given the US supply elasticity of 1.0. Both fat and snf imports will increase (by 3.1 and 2.7 per cent as a share of US consumption), with corresponding decreases in price of 6.1 per cent for fat and 0.4 per cent for snf.
Column 3 of Table 2 shows the results for the implementation of bilateral free trade in 2014 after having implemented a significant Doha WTO agreement. The results for the ‘with Doha WTO’ scenario are much smaller than those for the ‘without Doha WTO’ scenario. Bilateral free trade implies only very small changes in US prices and quantities – generally in the range of half of 1 per cent or less – if a significant WTO agreement has already been implemented.
4.2 Results for the actual AUSFTA agreement in 2014
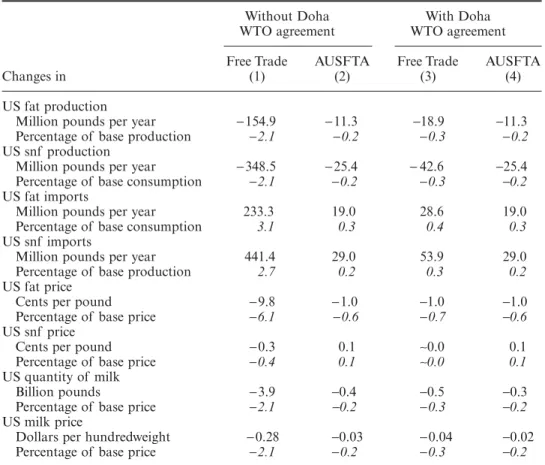
Columns 2 and 4 of Table 2 show the results for the actual AUSFTA. Even without a new WTO agreement in place (column 2), our results confirm that Table 2 Effects of free bilateral trade and the AUSFTA on US dairy prices and quantities
Changes in Without Doha WTO agreement With Doha WTO agreement Free Trade (1) AUSFTA (2) Free Trade (3) AUSFTA (4) US fat production
Million pounds per year −154.9 −11.3 −18.9 −11.3
Percentage of base production −2.1 −0.2 −0.3 −0.2
US snf production
Million pounds per year −348.5 −25.4 −42.6 −25.4
Percentage of base consumption −2.1 −0.2 −0.3 −0.2
US fat imports
Million pounds per year 233.3 19.0 28.6 19.0
Percentage of base consumption 3.1 0.3 0.4 0.3
US snf imports
Million pounds per year 441.4 29.0 53.9 29.0
Percentage of base production 2.7 0.2 0.3 0.2
US fat price
Cents per pound −9.8 −1.0 −1.0 −1.0
Percentage of base price −6.1 −0.6 −0.7 −0.6
US snf price
Cents per pound −0.3 0.1 ∼0.0 0.1
Percentage of base price −0.4 0.1 ∼0.0 0.1
US quantity of milk
Billion pounds −3.9 −0.4 −0.5 −0.3
Percentage of base price −2.1 −0.2 −0.3 −0.2
US milk price
Dollars per hundredweight −0.28 −0.03 −0.04 −0.02
Percentage of base price −2.1 −0.2 −0.3 −0.2
Note: The dairy title of the AUSFTA comprises quota expansion for Australian dairy products. In 2014, the additional quota granted to Australia is equivalent to 19 million pounds of fat and 29 million pounds of snf.
A milk components model of the AUSFTA 147 the AUSFTA will have a negligible impact on US production of milk (and fat and snf ): a decrease of 0.2 per cent, associated with a 0.2 per cent decrease in the price of raw milk. Both fat and snf imports would increase by 0.2 per cent as a share of US consumption.
Comparing columns 1 and 2, the effects of complete bilateral liberalisation, although quite small, are significantly greater than the results of the AUSFTA. In contrast, comparing columns 2 and 4, the effects of expanded US imports from Australia are essentially the same with or without a Doha WTO agree-ment in force. Moreover, comparing columns 3 and 4, with the Doha agreeagree-ment in place, neither bilateral free trade nor the AUSFTA would be expected to have any significant effect on US dairy prices or quantities.
The anticipated WTO agreement would eliminate much of the arbitrage incentive for the Australian dairy industry to supply dairy products to the US market. The slight expansion of Australian access to the US market under the bilateral agreement will have even smaller impacts on the US market (i.e., 0.2 or 0.3 per cent reductions in the price and quantity of US milk). These effects are very much smaller than the effects of complete bilateral liberalisation in the absence of a new WTO agreement.
5. Caveats and conclusion
This article has pursued a component-based model for examining important agricultural policy considerations. Obviously manufactured dairy products (cheese, butter, milk powder, etc.) form the basis of consumption and trade. However, an explicit focus on underlying product components recognises the fungibility of components across specific products on the time scales to which most policy questions apply. Components of raw milk can be used to make a huge variety of products (far too many to model individually) and the quantities of specific products in the mix change in response to relative prices. But the underlying effects on producers, and even processors and consumers, depend on the impacts on the components, not on the specific products. Our model of dairy trade policy shows the assumptions and data needed to implement a full component-based approach.
Before summarising and interpreting our results and drawing further implications, we want to remind the reader of some caveats. As with any ex ante simulation model, our results depend on simplifications, functional forms, and parameter values. We have discussed our reasoning for our modelling choices. Some of these choices would have only modest effects on the basic results. For example, over the price ranges we examine our linearity assumption is innocuous. Further, a choice to model fat and protein as components rather than fat and solids-not-fat, would have little significant impact. Some parameter choices affect results in ways that are well understood. For example, if the elasticity of supply in the United States is substantially greater than 1.0, the price impacts we project are overestimates and quantity impacts are underestimates.
148 J. M. Alston et al.
Also, of course, the scope of our topic is limited. We do not deal with the time path of price and quantity responses. Nor do we consider such issues as availability of new products, changes in product quality or effects on scale economies, or degrees of imperfect competition that are sometimes discussed in the context of market liberalisation.
Underlying baseline projections of relative prices are important in the results presented for reasons that are well illustrated by the results under the WTO scenario. If the baseline world prices are relatively high in the base-line by 2014 and are near to basebase-line internal US prices (because of a WTO agreement or otherwise), then free trade with Australia would have very little effect. We have used the best available projections, but readers should remember that the policy-relevant questions demand comparing alternative projections of prices a decade into the future. Such an exercise cannot be done with great confidence in the precision of the numerical results. However, even with these caveats, our results provide some useful lessons and we summarise these next.
The changes in the quantity of US imports from Australia implied by com-plete bilateral free trade in dairy products are derived from three sources: (i) modest production growth in Australia in response to increases in the price of milk facing Australian producers; (ii) small reductions in consumption in Australia in response to these price increases; and (iii) diversion of Australian dairy products from other export markets to the US market. About one-third of the additional shipments to the United States would derive from addi-tional Australian exports (mostly new production) and about two-thirds would derive from exports diverted from other markets. New exports to the United States would comprise about one-third of all Australian exports and about one-fifth of Australian production. The US market would become much more important for Australia, but exports to other markets would remain important as well.
The results for US prices and quantities of milk indicate small effects from free bilateral trade on the US market (reductions in both price and quantity of milk of about 2 per cent in the base case, and about 0.3 per cent under the likely WTO agreement). Free bilateral trade with Australia would imply a
loss to US dairy farmers in 2014 of #100 million per year without the new
WTO agreement; #22 million per year with a new WTO agreement. These
effects are an order of magnitude smaller than those claimed by the industry – that more than 13 per cent of US milk production would be displaced and
that America’s dairy farmers would lose #2.6 billion per year.
The impacts on the US dairy industry even of the rejected bilateral free trade agreement are best characterised as very small compared with other price and policy changes in the United States. For example, from 1981 to 1991 the support price for milk in the United States fell by 25 per cent in nominal terms, and by more in real terms. The support price is now about
#3.00 per hundred pounds of milk below where it was two decades ago. Over
A milk components model of the AUSFTA 149 to year. The 2 per cent milk price change associated with free bilateral trade is very small in comparison with milk price changes of these magnitudes. The projected impacts reported by the US dairy industry were hugely exaggerated but nonetheless they were seemingly successful in blocking any significant bilateral liberalisation in dairy product markets.
Domestic commodity interests naturally exaggerate the negative effects of opening the market, and one concern of proponents of freer trade is that more accurate estimates will almost always show impacts with the same neg-ative sign as claimed by the domestic industry. Hence, there may be a natural tendency to avoid engaging in discourse on quantitative measures of impacts on industries that lose under freer trade. This seems to have been the case during US debate of the dairy provisions of the proposed AUSFTA. US milk producer groups asserted that the proposed agreement would result in an impossibly large increase in imports from Australia, causing large reductions in US dairy prices with devastating effects on US dairy farms. Australian negotiators opted not to counter these claims by publicizing alternative estimates, perhaps on the grounds that they too would be regarded with scep-ticism because the source has an interest in the outcome. However, our work reported in this article indicates that estimates circulated without any rebuttal were too high by a factor of 10 or more. Exposing such numbers as the gross exaggerations that they were may not have yielded more market opening, but such an effort could hardly have yielded less.
References
ACIL Consulting (2003). A Bridge Too Far? An Australian Agricultural Perspective on the
Australia/United States Free Trade Area Idea. A report for the Rural Industries Research
and Development Corporation, February 2003, Melbourne.
Babcock, B.A., Beghin, J.C., Fabiosa, J.F., De Cara, S., Elobeid, A., Fang, C., Hart, C.E., Isik, M., Matthey, H., Saak, A.E. and Kovarik, K. (2002). The Doha Round of the World Trade
Organiza-tion: Appraising Further Liberalization of Agricultural Markets. Working Paper 02-WP 317.
Center for Agricultural and Rural Development, Iowa State University, Ames, Iowa. Babcock, B.A., Fabiosa, J.F., Matthey, H., Isik, M., Tokgoz, S., Elobeid, A., Hart, C.E.,
Fuller, F.H. and Meyer, S. (2003). An Analysis of the Proposed Doha Modalities. Staff Report 03-SR 98. Center for Agricultural and Rural Development, Iowa State University, Ames, Iowa.
Balagtas, J.V. and Sumner, D.A. (2003). The effect of the Northeast Dairy Compact on producers and consumers, with implications of compact contagion, Review of Agricultural Economics
25, 123 –144.
Bouamra-Mechemache, Z., Chavas, J.P., Cox, T.L. and Requillart, V. (2002a). EU dairy policy reform and future WTO negotiations: a spatial equilibrium analysis, Journal of Agricultural
Economics 53, 233–257.
Bouamra-Mechemache, Z., Chavas, J.P., Cox, T.L. and Requillart, V. (2002b). Partial market liberalization and the efficiency of policy reform: the case of the European dairy sector,
American Journal of Agricultural Economics 84, 1003–1020.
Brunke, H., Sumner, D.A., Alston, J.M. and Balagtas, J.V. (2005). Economic Data and
Projec-tions for Analysis of Dairy Trade on a Component Basis. University of California Agricultural
150 J. M. Alston et al.
Chavas, J.P., Cox, T.L. and Jesse, E. (1998). Spatial allocation and the shadow pricing of product characteristics. Agricultural Economics 18, 1–19.
Chavas, J.P. and Klemme, R.M. (1986). Aggregate milk supply response and investment behavior on U.S. dairy farms, American Journal of Agricultural Economics 68, 55 – 66. Chen, D., Courtney, R. and Schmitz, A. (1976). A polynomial lag formulation of milk production
response, American Journal of Agricultural Economics 54, 77– 83.
CIE (2001). Economic Impacts of an Australia-United States Free Trade Area. Report prepared for the Department of Foreign Affairs and Trade, Center for International Economics, Canberra.
CIE (2004). Economic Analysis of AUSFTA: Impact of the Bilateral Free Trade Agreement with
the United States. Report prepared for the Department of Foreign Affairs and Trade, Center
for International Economics, Canberra.
Cox, T.L. and Chavas, J.-P. (2001). An interregional analysis of price discrimination and domestic policy reform in the U.S. dairy sector, American Journal of Agricultural Economics
83, 89–106.
Cox, T.L., Coleman, J.R., Chavas, J.P. and Zhu, Y. (1999). An economic analysis of the effects on the world dairy sector of extending the Uruguay Round Agreement to 2005, Canadian
Journal of Agricultural Economics 47, 169 –183.
Dahlgran, R.A. (1980). Welfare costs and interregional income transfers due to regulation of dairy markets, American Journal of Agricultural Economics 62, 288 – 296.
Dee, P. (2004). The Australia–US Free Trade Agreement: An Assessment. Paper prepared for the Senate Select Committee on the Free Trade Agreement between Australia and the United States of America. Australia Pacific School of Economics and Government, Australian National University, Canberra.
Food and Agricultural Policy Research Institute (2004). U.S. and World Agricultural Outlook, 2004. Center for Agricultural and Rural Development, Iowa State University, Available from URL: http://www.fapri.iastate.edu/Outlook2004/outlook2004.htm [accessed January 2006].
Heien, D.M. and Wessells, C.R. (1988). The demand for dairy products: structure, prediction, and decomposition. American Journal of Agricultural Economics 70, 219 – 228.
Helmberger, P. and Chen, Y. (1994). Economic effects of U.S. dairy programs, Journal of
Agricultural and Resource Economics 19, 225 – 238.
Huang, K.S. (1993). A Complete System of US Demand for Food. Technical Bulletin No 1821, US Department of Agriculture, Economic Research Service, Washington, DC.
Ippolito, R.A. and Masson, R.T. (1978). The social cost of government regulation of milk,
Journal of Law and Economics 21, 33 – 65.
LaFrance, J.T. (2000). The Structure of U.S. Food Demand. Working Paper No. 862, Depart-ment of Agricultural and Resource Economics and Policy, University of California at Berkeley.
Lariviere, S. and Meilke, K. (1999). An assessment of partial dairy trade liberalization on the U.S., EU-15 and Canada, Canadian Journal of Agricultural Economics 47, 59 –73.
McDonald, J.D. and Sumner, D.A. (2003). The influence of commodity programs on acreage response to market price: with an illustration concerning rice policy in the United States,
American Journal of Agricultural Economics 85, 857– 871.
National Family Farm Coalition (2004). Australia Free Trade Agreement Concerns. Available from URL: http://www.nffc.net/issues/fair/fair_4b.htm [accessed 28 Nov 2004].
Wohlgenant, M.K. (1989). Demand for farm output in a complete system of demand func-tions, American Journal of Agricultural Economics 71, 241– 252.
A milk components model of the AUSFTA 151
Appendix: derivation of supply and demand elasticities for fat and snf
We calculate supply and demand parameters for the linear model from supply and demand elasticities published in the published work and data on prices and quantities of milk and dairy products. In this Appendix, we derive the supply elasticities for fat and snf from the supply elasticity for milk and we derive the demand elasticities for fat and snf from the demand elasticities for dairy products.
Component supply elasticities
Substituting Equation (6) into Equations (4) and (5) and converting to proportional changes yields:
, (41) and
(42)
where sf = WfF/PM is the value of milk fat as a share of the total value of
raw milk, and sn = WnN/PM is the value of snf as a share of the total value
(and sn = 1 − sf). The supply equations for the two components, (41) and (42),
have the same structure as one another, and are identical to the correspond-ing proportional change form of the supply equation for raw milk, because the two components are produced in fixed proportions to one another and to
the quantity of milk (i.e., dF/F = dN/N = dM/M).
Thus, the supply elasticity for fat and snf with respect to the price of fat is
sfε, and the supply elasticity for fat and snf with respect to the price of snf is
snε. The own- and cross-price slopes in Equation (9) follow from multiplying
the supply elasticities by the appropriate quantity and dividing by the appropriate price.
Component demand elasticities
To express the linear demand equations (Equations (22) and (23)) in terms of elasticities of demand for fat and snf we transform the equations into proportional-change form as follows:
, (43) and dF F s dW W s dW W f f f n n n = ε + ε dN N s dW W s dW W f f f n n n = ε + ε , dF F f W F X P dW W f n W F X P dW W i ii f i i i f f i i ii n i i i n n = + = =
∑
2∑
1 5 1 5 η η152 J. M. Alston et al.
(44)
Then, rearranging terms yields:
, (45)
and
(46)
Each of the elasticities of demand for fat and snf components in these equations depends on the elasticities of demand for the final products
(i.e., ηii for i = 1, . . . , 5) weighted by the value of the component whose price
is changing as a share of the value of the product, times the importance of that product as a source of the component.
dN N f n W N X P dW W n W N X P dW W i i ii f i i i f f i ii n i i i n n = . + = =