Using Selective Laser Sintering to produce Scaled Structural Models
Cooke, W R* and Tomlinson, R A; The University of Sheffield
Burguete, R L, Johns, D and Vanard, G J C; Airbus
Featherston, C A; Cardiff University
*Department of Mechanical Engineering, The University of Sheffield, Sheffield, S1 3JD,
ENGLAND; email: [email protected]
ABSTRACT:
Complex or non-linear Finite Element Analyses are by their very nature uncertain. It is desirable therefore to validate experimentally any results thus produced. Traditional methods of producing structural models are, however, both slow and expensive, reducing the number of validated design cycles which may be completed for a given time and cost. An additive layer manufacturing method known as Selective Laser Sintering (SLS) is thus suggested as a method for producing scaled structural models both rapidly and at low cost. The models would be analysed using suitable experimental techniques, such as Digital Image Correlation, under reduced loads derived using dimensional analysis methods. It is the aim of the current work to determine the potential accuracy of structural analyses completed using scaled models produced by SLS. To this end, the directional properties of a common SLS material were accurately determined, in addition to the effect of the observed orthotropy on the experimental analysis of a hole in a finite plate in tension. Further, the suitability of producing SLS models of stiffened panels for buckling analyses has been determined by experiment.
1. NOMENCLATURE
a hole diameter
D distortion error
d specific distortion error
E Young’s modulus (subscripts denote direction)
G shear modulus (subscripts denote plane)
O12 orthotropy
P load
Pcr critical buckling load
Pcr,1 critical buckling load of prototype
Pcr,2 critical buckling load of model
SE Young’s modulus scale factor
Sw geometric scale factor
w plate width
ε strain
εf strain to failure
ε1,VM,max maximum von Mises strain in the prototype
ε2,VM,max maximum von Mises strain in the model
θ angle between material 1-direction and the direction of loading (off-axis angle)
ν Poisson’s ratio
σmax,1 maximum stress in the prototype
σmax,2 maximum stress in the model
σUTS ultimate tensile strength
Proceedings of the SEM Annual Conference June 1-4, 2009 Albuquerque New Mexico USA ©2009 Society for Experimental Mechanics Inc.
2. INTRODUCTION
Finite element analyses (FEA) contain certain inherent uncertainties. Even assuming the virtual model has been constructed correctly and suitable boundary conditions and loads applied, the accuracy of the solution is still constrained by the technique itself [1]. Discretization, the division of the virtual model into the finite elements required to complete an analysis, will always limit the resolution of analysis (of particular concern in areas of high strain gradient such as at crack tips and sharp corners). In specific situations, accuracy may also be lost due to rounding errors in the mathematical model caused by the use of numbers with finite precision (known as matrix ill-conditioning).
In safety-critical industries (those with an often high part cost and low failure tolerance, such as the aerospace, rail and nuclear industries), uncertainties in FEA may lead to the need for development tests using prototype components to verify the numerical analyses. The overall design process time and cost would thus be increased due to the long lead times associated with relatively expensive traditional prototyping methods such as CNC machining. This increase in time and cost leads to a reduction in the number of design iterations which may be completed in a given cycle, thus reducing design quality. In the worst case scenario, failure of the design at a late stage in the process, and the need for expensive and time consuming redesign [2], may result. A method for rapidly and accurately producing complex structural models of prototype designs would therefore be of great use. Additive layer manufacturing (ALM) is the generic term for a group of technologies that began to emerge in the late 1980s, designed to build components directly from CAD data without the need for part-specific tooling, through the layer-by-layer addition of material [3]. Such technologies show potential for producing complex structural models for development testing at a fraction of the time and cost of traditional prototyping techniques, particularly as the same CAD models used for FEA may also be used for model production. One of the most popular ALM techniques, known as selective laser sintering (SLS), is considered to show particular promise for structural model production due to the wide range of materials it is able to process [4-7].
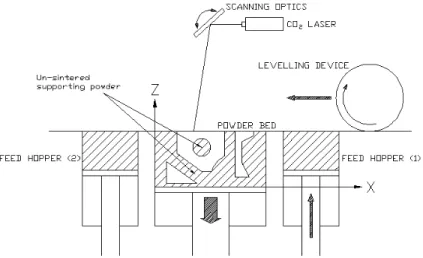
The selective laser sintering apparatus (figure 1) consists of: a powder bed and feed hoppers, heated to within a few degrees of the sintering temperature of the powder; a levelling device (either a blade or a counter-rotating roller); a CO2 laser, controllable in the horizontal (xy-) plane by scanning optics and working in the 25-100 W
range; and a control computer. At the start of a build, the base of the powder bed is located one layer thickness (between 0.10 and 0.25 mm) below the rim of the powder bed. A layer of powder is then spread over the bed by the levelling device, having been released by the relevant feed hopper. The laser then raster scans the cross section of the part to be built, heating and sintering the powder to form a solid layer. The base of the powder bed then indexes down by a single layer thickness, and the process repeated. The laser power is controlled such that subsequent layers will also be sintered to those preceding. Unsintered powder acts to support the parts during the build, and may be removed after completion and cooling of the build.
Previous studies have shown that parts built by ALM techniques may exhibit significant levels of orthotropy and residual stress [8-10], although no complete studies of the orthotropy of any SLS material exists in the literature. It has also been shown that position within the build volume may have an effect of the properties of the material produced [8], and as such SLS parts may be inhomogeneous. Thus, using SLS models to verify numerical analyses of prototypes assumed to be isotropic, homogeneous and residual stress-free by dimensional modelling methods [11] will lead to inaccuracies in the analysis, known as distortion error.
It is the aim of the on-going study to determine the current suitability of SLS to
Figure 1: the selective laser sintering (SLS) apparatus, showing the apparatus x- (recoating) and z- (vertical) directions. The apparatus
p m h c s r F 3 I w G b 2 ( c t r a p f A s s u f w E in y t in a m e = f G w F m m y a 1 b s t a b f produce scale methods. To have been fou common stres similar plate reinforced pan FEA of the sa 3. THE D n total, 304 d were used to GF [7] when both produced 2) consisted vertically, pe created in bot he layers, pa respectively). arranged as i plane of the la found as desc All specimens speed of 2 m specimens w uncontrolled ( from both buil were stored in Example stres n figure 3. Th yield stress of he profile at s n the usual m and the z-dire manufacturer. equal in all di = 0.37 for bu for build 2 we Gzx = Gzy = 1 with Gxy = 1.6 Analy From figure 3 material is modulus. You y-) directions and 2 respec 10.5% and 10 build 1 and shown to be s o failure. The as would be e by-layer fash fact that the
ed structural m this end, the und. The leve ss raiser pro
models built nel, has also me structure. DIRECTIONA dogbone tens determine th produced on d by 3D Syst of 72 specim erpendicular t th the x- and arallel and p The secon in the first, p ayers to allow cribed by Jone s were tested mm/min. From were selected (ambient) con lds were teste n a dry and da ss-strain prof he lack of de f the material strain ε = 0. U manner. The ection aged s . Poisson’s rections, with uild 2. The sh ere equal in th 1.3 GPa, but GPa. ysis and disc 3 and table 1 transversely ung’s modulu varies by 2. ctively, where 0.1% lower th 2 respective similarly trans ese transverse expected for a ion, and are shear modul models for ex e directional m els of distortio ototype, a fini t by SLS an o been produc . AL MECHANI sile specimen he mechanica n a Sintersta tems Inc. The mens created to the layer y-directions ( perpendicular d build con plus 16 speci w the shear m es [13]. d in tension m the first b d and allowe nditions. All o ed within 7 da ark environme files for x-, y- efined linear e from being d Ultimate tensi means and s specimens fro ratio ν was h ν = 0.36 for hear moduli G he zx- and zy t different in cussion , it may be s y isotropic s in the horiz .5% and 0.7% eas in the z-an the horizo ely. The mate
sversely isotr ely isotropic p a part produc e further conf i in zx- and xperimental v mechanical p on error caus
ite plate with d analysed ced by SLS a ICAL PROPE ns created o al properties ation® HiQ™ e first build (s d parallel to t plane), and (horizontally, to the reco sisted of 14 mens angled odulus of the to failure at build, 18 of t ed to age fo of the remain ays of build co ent prior to te and z-directio elastic and n determined, an le strength σU standard dev om build 1 a found to be build 1 and ν G determined y-planes, with the xy-plane
seen that the in Young’s zontal (x- and % for build 1 direction it is ontal mean fo erial may be ropic in strain properties are ced in a layer-firmed by th zy-planes ar validation of fi properties of ed by varying a hole in te experimental and tested in ERTIES OF D ver two build of DuraForm® platform [12 shown in figur the z-directio 36 specimen in the plane o ating directio 44 specimen d at 45° to th e material to b a cross hea the z-directio or 43 days ing specimen ompletion, an esting.
on, and z-dire non-linear sec
nd forced You
UTS and strain
iations of the re shown in e ν d h , e s d 1 s r e n e -e re 0 5 10 15 20 25 30 35 40 45 0 STRESS / MPa Figure 3: nite element a common g g levels of mo ension, have ly. A second n compression DURAFORM® ds ® 2], re on ns of on ns he be ad on in ns nd ection (aged) ctions of the ung’s modulu n to failure εf w e x-, y- and z table 1, alon 0. Figure (build 1). 72 horiz example stress material, and Z X analyses by glass-filled po odel orthotrop been determ d common a n, and the re ® GF specimens f stress-strain us E to be def were determin -direction pro gside the pro
01 0 STRAIN e 2: 144 off dogb . Showing the 7 zontal specimen y-dire s-strain profiles d z-direction (ag Y dimensional olyamide SLS py on the ana mined numeric aerospace str esults compar from build 1 a profiles prev fined as the g ned for each operties for bo operties quote 0.02 z-directio z-directio y-directio x-directio
bone tensile spe 72 vertical speci ns (36 x-directio ection). s for x-, y- and z ged) material. modelling S material alysis of a cally, and ructure, a red to the are shown vented the gradient of specimen oth builds ed by the 0.03 on (aged) on on on ecimens imens and on and 36 z-direction
equal and different from that in the xy-plane. The ultimate tensile strength may be seen to be more generally orthotropic, thought to be caused in some way by the recoating process. However, as it is the intention to use the SLS parts for modelling structures performing in the elastic region, this is considered of low importance.
In common with the usual definition of the primary material axes in a unidirectional fibre reinforced composite (another transversely isotropic material) [13], the material 1-direction is to be considered parallel to the SLS apparatus z-axis (the non-transverse direction; parallel to the fibre direction in a composite), with the 2- and 3- directions being interchangeable and parallel to the SLS apparatus x- and y-directions. This assignment of primary material axes allows the orthotropy of the material O12 to be determined, with
= 1 − 12 2 1 E O E (3-1)
where E1 is the Young’s modulus in the 1-direction, and E2 the Young’s modulus in the 2-direction (identical to
that in the 3-direction for transversely isotropic materials). Thus, most unidirectional fibre reinforced composite materials will display positive orthotropy, whereas DuraForm® GF displays orthotropy of 0.105 (or 10.5%) and -0.101 (or -10.1%) for builds 1 and 2 respectively (taking E2 to be the mean of the horizontal Young’s moduli).
It is also clear from figure 3 and table 1 that the age of the specimens has an impact on the performance of the material, with reductions of 21% and 44% in Young’s modulus and ultimate tensile strength and an increase of 7% in strain to failure after 43 days in ambient conditions. Subsequent work, proprietary of the ALM Group at Airbus, has shown this ageing to be due to moisture absorption and may be completely removed by storing specimens in a dry environment.
Significant variations in the material properties from build-to-build may also be observed, with an average reduction in all properties of 10% from build 1 to build 2. No changes were made to the process parameters used to create builds 1 and 2, however, in the intervening period routine maintenance was carried out on the apparatus. The large variations in material properties caused by the maintenance procedure shows the susceptibility of process output to even small changes in input, as used extensively to optimise the SLS process by statistical methods [14-18]. Because the properties of the material produced by SLS are likely to drift over time, it is required to produce and test a small run of dogbones (3 in each of the x-, y- and z-directions) with each build containing models for experimental structural analysis.
However, in order that numerical studies of the distortion errors caused by using structural models made from DuraForm® GF could be completed, it was necessary to choose one set of properties to represent the SLS material. It was decided to use the properties determined from build 2, as it was only in build 2 that the shear moduli of the material were also determined. Thus, the complete set of elastic material properties for DuraForm® GF used for the remainder of the studies was:
E / GPa σUTS / MPa εf BUILD 1 x-dirn MEAN 5.213 38.6 0.0205 standard deviation 0.227 2.8 0.0024 y-dirn MEAN 5.084 40.6 0.0208 standard deviation 0.293 2.2 0.0027 z-dirn MEAN 4.606 35.6 0.0161 standard deviation 0.272 3.6 0.0041
z-dirn (aged) MEAN 3.628 19.9 0.0172
standard deviation 0.230 2.0 0.0059 BUILD 2 x-dirn MEAN 4.305 34.9 0.0197 standard deviation 0.326 2.4 0.0022 y-dirn MEAN 4.273 36.3 0.0206 standard deviation 0.386 2.7 0.0027 z-dirn MEAN 3.853 30.9 0.0143 standard deviation 0.448 2.1 0.0023
GLOBAL UN-AGED MEAN 4.556 36.2 0.0187
MANUFACTURER’S QUOTED [7] 4.068 26 0.014
Table 1: the directional properties of DuraForm® GF, including global mean properties and those quoted by the manufacturer.
1 3.9 E = GPa 2 3 4.3 E =E = GPa 12 13 1.3 G =G = GPa (3-2) 23 1.6 G = GPa 12 13 23 0.37 ν =ν =ν =
4. DISTORTION ERRORS AROUND HOLES IN PLATES
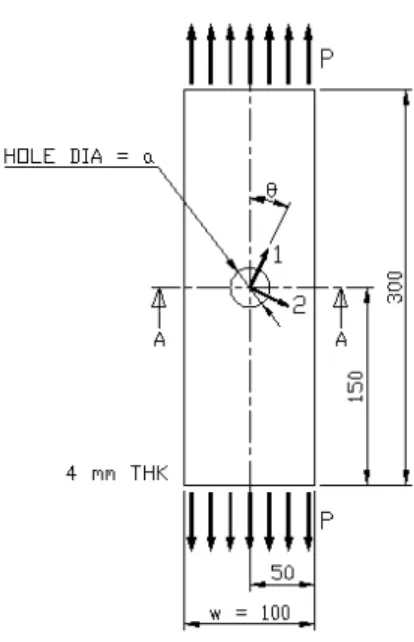
A finite plate with a hole in tension represents a simplification of a large range of structural features. In order to determine the suitability of SLS to accurately model such features in materials assumed to be isotropic, the effect of various levels of orthotropy O12, from 0 (isotropic) to 0.4 (40%),
on the maximum von Mises equivalent strain in the plate shown in figure 4 was determined by finite element analysis. The hole diameter to plate width ratio a/w was varied from 0 to 0.725. The material off-axis angle θ, the angle between the loading direction and the material 1-direction, was also varied, between 0° and 90°. The modelling distortion error D (the deviation from the isotropic prototype results) for any given orthotropic (model) case was defined as
2, ,max 1, ,max 1, ,max VM VM VM D ε ε ε − = (4-1)
where ε2,VM,max was the maximum von Mises strain in an orthotropic (model) plate, and ε1,VM,max the equivalent result for the isotropic (prototype) case. E1 was maintained constant at 74 GPa, with E2 and E3
(the through-thickness Young’s modulus) being varied according to the orthotropy for any given case. Poisson’s ratio and shear modulus in all planes were maintained as 0.3 and 28.5 GPa respectively. The material properties thus defined represent an idealised form of model orthotropy, expressed only in directional Young’s moduli, with the prototype case being a plate constructed from isotropic aluminium alloy 2024 (alu-2024). It was found that the modelling distortion error D varied
approximately linearly with O12 for all values of θ and a/w
(example given in figure 5), which allowed the non-dimensional specific modelling distortion error d to be defined as 12 D d O = (4-2)
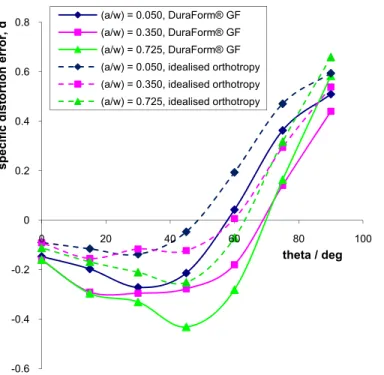
The specific modelling error d was then plotted against the material off-axis angle θ for all values of a/w. It was found that for all values of a/w, the variation of d with θ followed the same approximate form (shown as the dashed lines in figure 6 for a/w = 0.050, 0.350 and 0.725), with maximum specific distortion error occurring at θ = 90°. The maximum specific distortion error for any θ could then be plotted against a/w (figure 7). A plot of this form would allow the experimental analyst to determine the maximum distortion error that would be expected from modelling an isotropic prototype plate using an orthotropic model with O12≤ 0.4.
Figure 4: the hole-in-plate specimen, also showing the material off-axis
angle θ. -35 -30 -25 -20 -15 -10 -5 0 -0.5 -0.4 -0.3 -0.2 -0.1 0.0 % distortion error orthotropy (a/w)=0.050 (a/w)=0.375 (a/w)=0.700
Figure 5: showing the linear variation of distortion error with orthotropy for three plate geometries, with material off-axis angle θ = 90°. All hole sizes and off-axis angles
It may be seen from figure 7 that for DuraForm® GF, with O12 ≈ -0.1, the
maximum distortion error D that would be expected when modelling an isotropic plate is around -7% (the maximum strain in model would be 7% lower than in prototype). This distortion error is considered to be within the bounds of normal experimental error. Similar numerical analyses were then carried out using the complete SLS material data determined previously. For these cases, εVM,max for DuraForm® GF (the model) was compared with that for the isotropic alu-2024 (the prototype), with the model tensile loads being scaled by a factor 1/SE = 0.052
(the ratio of E1 for DuraForm® GF, 3.9
GPa, to the Young’s modulus for alu-2024, 74 GPa). These results are shown as the solid lines on figure 6, and it may be seen that distortion errors from the idealised orthotropic model are, in all cases, greater than those from the DuraForm® GF model. In order to validate the finite element analyses used, three hole-in-plate specimens were created by SLS, geometrically scaled by the factors Sw
-0.6 -0.4 -0.2 0 0.2 0.4 0.6 0.8 0 20 40 60 80 100 specific distortion error, d theta / deg (a/w) = 0.050, DuraForm® GF (a/w) = 0.350, DuraForm® GF (a/w) = 0.725, DuraForm® GF (a/w) = 0.050, idealised orthotropy (a/w) = 0.350, idealised orthotropy (a/w) = 0.725, idealised orthotropy
0.0 0.1 0.2 0.3 0.4 0.5 0.6 0.7 0.8 0.0 0.2 0.4 0.6 0.8 d (max) a/w Figure 6: showing variation of specific distortion error with off-axis
angle for three plate geometries. Includes results for idealised orthotropy (orthotropy expressed only in the Young’s modulus),
and for the complete directional properties of DuraForm® GF
-0.0030 -0.0020 -0.0010 0.0000 0.0010 0.0020 0.0030 0.0040 -60 -40 -20 0 20 40 60 strain
distance from hole centre / mm
1st principal strain, FEA 2nd principal strain, FEA 1st principal strain, experimental 2nd principal strain, experimental
Figure 7: showing the variation of maximum specific distortion error (for all θ) with plate geometry, for plates with idealised orthotropy (orthotropy expressed only in
Young’s modulus). For DuraForm® GF, O12≈ -0.1, maximum distortion error D = -7%.
Figure 8: validation of the hole-in-plate FEA. Showing 1st and 2nd principal strains along the transept A–A, determined by finite element analysis and
= 0.8, 0.5 and 0.3. The hole diameter to plate width ratios a/w were set to 0.280, 0.750 and 0.050, and the material off-axis angles θ to 0°, 45° and 90°, respectively. A group of 9 dogbone tensile specimens was also produced in the same build as the plates, with 3 dogbones produced parallel to each of the primary material axes. Each model was loaded in tension to failure, with the strain fields being determined by 3-dimensional digital image correlation (DIC) at various intervening loads. The 1st and 2nd principal strains along the transept A–A (figure 4)
were then plotted for the DIC (experimental) and corresponding FEA (numerical) analyses (example shown as figure 8 for Sw = 0.8, a/w = 0.280, θ = 0°). The numerical analyses used material properties determined from the 9
tensile dogbones produced with the plates. Close correlation was noted between the numerical and experimental results.
5. MODELLING REINFORCED COMPRESSION PANELS
The buckling behaviour of reinforced panels is of particular interest to the aerospace sector, as much of the structure of an aircraft may be considered to be a more complex form of a simple reinforced compression panel. However, the buckling and post-buckling behaviour of even simple reinforced panel structures is extremely complex [19] and as such, a requirement to perform experimental analyses of these structures exists for both aircraft design and for more specific research studies. The ability of SLS to rapidly and accurately produce models of compression panels is therefore of concern to the current study.
The panel that was considered for analysis is shown as figure 9. The ends of the panel were constrained to simulate a built-in end condition. An eigenvalue fbuilt-inite element analysis of the panel was completed in order to find the approximate critical buckling load Pcr,1 for an isotropic aluminium alloy 2024
prototype panel (E = 74 GPa, Poisson’s ratio ν = 0.3). Similar analyses were then completed using the material properties determined previously for DuraForm® GF, with the critical model buckling loads then scaled by the ratio of the Young’s modulus for alu-2024 to E1 for DuraForm® GF (SE = 19.2). The
material off-axis angle θ (the angle between the loading direction and the material 1-axis, in the plane of the plate) was again varied from 0° to 90°. The distortion error D was defined as
,2 ,1 ,1 cr cr cr P P D P − = (4-1)
where Pcr,2 is the buckling load predicted for the isotropic alu-2024 prototype panel by the scaled DuraForm® GF
model.
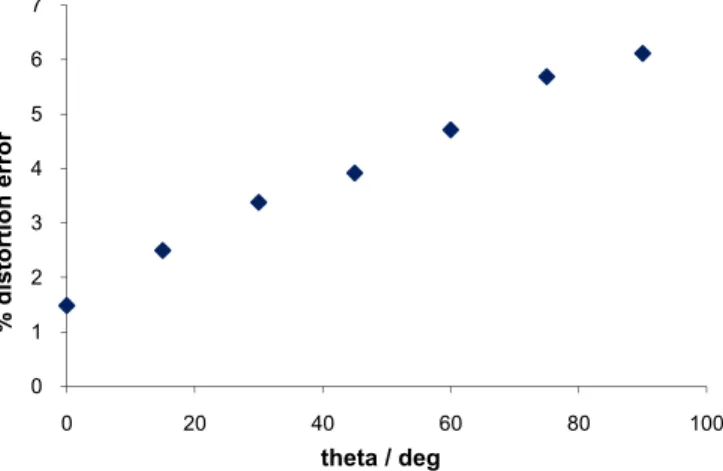
Figure 10 shows the variation of the distortion error in critical load (expressed as a percentage) with the material off-axis angle for the reinforced panel. It may be seen that the maximum distortion error when modelling the prototype panel with DuraForm® GF is less than 7%. Again, this distortion error is considered to be within the limits of normal experimental error.
In order to validate these results, a series of panels at various scales and material off-axis angles was produced. However, the residual stresses created in components built by SLS ensure that the process is non-optimal for accurately producing
Figure 9: the reinforced compression panel specimen, showing the material off-axis angle θ, and the stiffener and plate components of the panel.
0 1 2 3 4 5 6 7 0 20 40 60 80 100 % distortion error theta / deg
Figure 10: showing the variation of distortion error with material off-axis angle for a DuraForm® GF panel, determined by finite
large flat plates. This is particularly true when such plates have features of different thicknesses attached to them, such as the stiffeners of the reinforced panel. All of the panels produced thus far have contained considerable levels of warp on removal from the build volume, leading to the top and bottom edges of the plate being non-parallel to one another (the panels twisted about the axis of loading). Annealing the panels at a temperature of 75°C for 10 hours provided the solution to a significant extent; however, panels treated in this manner still contained initial
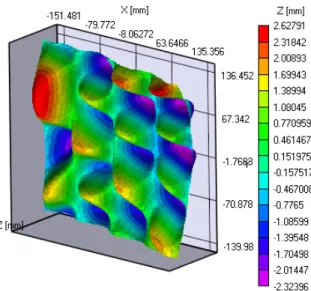
imperfections large enough to cause unexpected patterns of buckling during compression tests (figure 11).
6. DISCUSSION, OR “THE ART OF PRODUCING SCALED MODELS BY SLS”
The distortion errors caused by the orthotropy of DuraForm® GF have been shown by finite element studies to be within the bounds of normal experimental error, considered to be around 10%, when modelling isotropic prototype holes in finite plates in tension and reinforced buckling panels. It is thought that similar levels of distortion error would exist for the modelling of other isotropic prototype structures.
In theory, therefore, it is possible to produce, by SLS, scaled models of structural prototypes for use in experimental validation of finite element analyses. However, considering only the elastic orthotropy of the SLS material ignores a number of other concerns in the production of accurate models. These concerns include the non-linearity of the SLS material and the dimensional accuracy of models produced by SLS: clearly, differences in the behaviour of DuraForm® GF to whatever material it is aiming to imitate, and any differences in the shape of a model to that of the prototype, will lead to further distortion errors in the analysis.
If it is assumed that the finite element analysis to be validated is only concerned with elastic behaviour, and again using aluminium alloy 2024 as the modelled material, it may be shown that the non-linearity of the SLS material will have little effect on the experimental analysis. The Young’s modulus scale factor SE, the ratio of the Young’s
modulus of the prototype material (alu-2024) to that of the model material (DuraForm® GF), is 19.2. If the prototype included peak stresses σmax,1 equal to the yield stress of alu-2024, around 230 MPa, the equivalent peak stress in the DuraForm® GF model σmax,2 would be
max,2 max,1 1 12.0 E S σ = σ = MPa (5-1)
Figure 11 (clockwise, from above): buckling pattern of panel (θ = 0°) at the critical load, from experiment; the experimental set-up, showing buckling panel held in grips
(also produced by SLS) and the loading rig; and buckling pattern of corresponding panel determined by eigenvalue finite element analysis. Very little agreement between the
buckling patterns from experiment and from FEA is evident.
It may be seen from figure 3 that the maximum stress in the model would therefore be well within the linear region of un-aged DuraForm® GF, and thus no distortion errors would be caused by the non-linear behaviour of the material in these cases.
The difficulties in producing dimensionally accurate scaled models of certain forms by SLS are, unfortunately, harder to overcome. Large flat plates of the types of forms found extensively in lightweight structures such as aircraft are particularly difficult to produce accurately, although any structure may present problems specific to its shape. These losses of dimensional accuracy are caused by the shrinkage of the material during sintering and then cooling, leading to residual stresses and distortion [10]. Reducing such distortion is no mean feat: the SLS process has more than 50 input parameters which may affect the output of the process, from layer thickness and laser beam speed to hatch spacing and part bed temperature, many of which interact in complex manners [17]. The precise manners in which the process parameters affect output are still poorly understood, and as a result operator experience is invaluable when attempting to build accurate parts. Achieving consistently high-quality models in any ALM process is often described as “more of an art than a science” by experienced users. It is likely that difficulties in producing suitably accurate parts will be the major limitation in using SLS to produce structural models of certain types.
It was shown that it is possible to reduce the warp of parts by annealing, however levels of distortion large enough to affect the experimental analyses still remained. Also, the need to complete secondary processes to prepare a model for analysis removes some of the attraction of ALM for producing structural models in the first place. There may be other ways around this problem, though: initial attempts to build much smaller scale versions of the reinforced compression panels (Sw = 0.5) have met with more success. The smaller parts display considerably
less warping and achieve better dimensional accuracy than their larger counterparts. However, at sizes such as this the thickness of the plates is of a similar order to the laser beam diameter, and approaching that of the layer thickness. It is unknown if this will have a detrimental effect on the accuracy of the model, and to what levels such geometric scaling may be taken whilst maintaining accuracy.
The future concerns of the study will include investigation the limits of geometric scaling, and SLS process parameter optimisation to further reduce orthotropy and improve dimensional accuracy.
7. CONCLUSIONS
A study of the suitability of using the SLS process and DuraForm® GF to produce scaled structural models for validation of FEA is on-going. Currently, the following conclusions may be drawn:
o DuraForm® GF when processed by SLS is transversely isotropic, with Young’s modulus in the 2- and 3-directions being around 10% greater than in the 1-direction. The material 1-direction is parallel to the SLS apparatus z-direction. The material degrades with age due to moisture absorption, with a reduction in Young’s modulus and ultimate tensile strength of around 20% and 45% respectively after 43 days stored in ambient conditions.
o The material properties of Duraform GF make it suitable for the production of structural models, with distortion errors caused by orthotropy of less than 10%.
o The difficulties of producing dimensionally accurate parts by SLS is likely to be the major limiting factor on using the process to produce structural models, although attempts are to be made to reduce levels of warp in parts to suitable levels.
8. REFERENCES
1. Cook R D, Malkus D S, Plesha M E, Witt R J, Concepts and Applications of Finite Element Analysis (4th edition), John Wiley & Sons, New York, London, 2002.
2. O'Brien E W, Pre-test analysis using stereolithography and photoelastic coatings, Proceedings of the 2005 SEM Annual Conference and Exposition on Experimental and Applied Mechanics, Portland, OR, United States, p. 1631, 2005.
3. Jacobs P F, Stereolithography and other RP&M Technologies, American Society of Mechanical
Engineers (ASME) Press, New York, 1996.
4. Bourell D L, Marcus H L, Barlow J W, Beaman J J, Selective laser sintering of metals and ceramics, International Journal of Powder Metallurgy, vol. 28 (4), pp. 369-381, 1992.
5. McAlea K, Booth R, Forderhase P, Lakshminarayan U, Materials for selective laser sintering processing, Proceedings of the 27th International SAMPE Technical Conference, Albuquerque, NM, US, pp. 949-961, 1995.
6. Berzins M, Childs T H C, Ryder G R, Selective laser sintering of polycarbonate, CIRP Annals -
Manufacturing Technology, vol. 45 (1), pp. 187-190, 1996. 7. 3D Systems Inc., Laser Sintering Materials, available from
http://www.3dsystems.com/products/solidimaging/LaserSintering/index.asp, 2006 (viewed on 24/03/2008).
8. Gibson I, Shi D, Material properties and fabrication parameters in selective laser sintering process, Rapid Prototyping Journal, vol. 3 (4), pp. 129-136, 1997.
9. Dulieu-Barton J M, Fulton M C, Mechanical properties of a typical stereolithography resin, Strain, vol. 36 (2), pp. 81-87, 2000.
10. Mercelis P, Kruth J-P, Residual stresses in selective laser sintering and selective laser melting, Rapid Prototyping Journal, vol. 12 (5), pp. 254-265, 2006.
11. Szirtes T, Applied Dimensional Analysis and Modeling (2nd edition), Elsevier, London, New York, 2007.
12. 3D Systems Inc., SLS Systems, available from http://www.3dsystems.com/products/sls/index.asp, 2009 (viewed on 11/03/2009).
13. Jones R M, Mechanics of composite materials (2nd edition), Taylor & Francis, London, 1999.
14. Hardro P J, Wang J-H, Stucker B E, Determining the parameter settings and capability of a rapid prototyping process, International Journal of Industrial Engineering: Theory, Applications and Practice, vol. 6 (3), pp. 203-213, 1999.
15. Yang H J, Hwang P J, Lee S H, A study on shrinkage compensation of the SLS process by using
the Taguchi method, International Journal of Machine Tools and Manufacture, vol. 42 (11), pp. 1203-1212, 2002.
16. Bacchewar P B, Singhal S K, Pandey P M, Statistical modelling and optimization of surface
roughness in the selective laser sintering process, Proceedings of the Institution of Mechanical Engineers, Part B: Journal of Engineering Manufacture, vol. 221 (1), pp. 35-52, 2007.
17. Raghunath N, Pandey P M, Improving accuracy through shrinkage modelling by using Taguchi
method in selective laser sintering, International Journal of Machine Tools and Manufacture, vol. 47 (6), pp. 985-995, 2007.
18. Wang R-J, Wang L, Zhao L, Liu Z, Influence of process parameters on part shrinkage in SLS,
International Journal of Advanced Manufacturing Technology, vol. 33 (5-6), pp. 498-504, 2007.
19. Featherston C A, Koffi K, Burguete R L, Postbuckling behaviour of a stiffened panel subject to
combined loading, 25th International Congress of the Aeronautical Sciences, 3-8th September 2006, Hamburg, Germany, 2006.