Planning Model for Implementing Electric
Vehicle Charging Infrastructure in
Distribution System
by
Yassir Alhazmi
A thesis
presented to the University of Waterloo in fulfillment of the
thesis requirement for the degree of Doctor of Philosophy
in
Electrical and Computer Engineering
Waterloo, Ontario, Canada, 2016
AUTHOR'S DECLARATION
I hereby declare that I am the sole author of this thesis. This is a true copy of the thesis,
including any required final revisions, as accepted by my examiners
Abstract
Plug-in electric vehicles (PEVs) are growing in popularity in developed countries in an attempt to overcome the problems of pollution, depleting natural oil and fossil fuel reserves and rising petrol costs. In addition, automotive industries are facing increasing community pressure and governmental regulations to reduce emissions and adopt cleaner, more sustainable technologies such as PEVs. However, accepting this new technology depends primarily on the economic aspects for individuals and the development of adequate PEV technologies. The reliability and dependability of the new vehicles (PEVs) are considered the main public concerns due to range anxiety. The limited driving range of PEVs makes public charging a requirement for long-distance trips, and therefore, the availability of convenient and fast charging infrastructure is a crucial factor in bolstering the adoption of PEVs. The goal of the work presented in this thesis was to address the challenges associated with implementing electric vehicle fast charging stations (FCSs) in distribution system.
Installing electric vehicle charging infrastructure without planning (free entry) can cause some complications that affect the FCS network performance negatively. First, the number of charging stations with the free entry can be less or more than the required charging facilities, which leads to either waste resources by overestimating the number of PEVs or disturb the drivers’ convenience by underestimate the number of PEVs. In addition, it is likely that high traffic areas are selected to locate charging stations; accordingly, other areas could have a lack of charging facilities, which will have a negative impact on the ability of PEVs to travel in the whole transportation network. Moreover, concentrating charging stations in specific areas can increase both the risk of local overloads and the business competition from technical and economic perspectives respectively. Technically, electrical utilities require that the extra load of adopting PEV demand on the power system be managed. Utilities strive for the implementation of FCSs to follow existing electrical standards in order to maintain a reliable and robust electrical system. Economically, the low PEV penetration level at the early adoption stage makes high competition market less attractive for investors; however, regulated market can manage the distance between charging stations in order to enhance the potential profit of the market.
As a means of facilitating the deployment of FCSs, this thesis presents a comprehensive planning model for implementing plug-in electric vehicle charging infrastructure. The plan consists of four main steps: estimating number of PEVs as well as the number of required charging facilities in the network; selecting the strategic points in transportation network to be FCS target locations; investigating the maximum capability of distribution system current structure to accommodate PEV loads; and developing an economical staging model for installing PEV charging stations. The
development of the comprehensive planning begins with estimating the PEV market share. This objective is achieved using a forecasting model for PEV market sales that includes the parameters influencing PEV market sales. After estimating the PEV market size, a new charging station allocation approach is developed based on a Trip Success Ratio (TSR) to enhance PEV drivers’ convenience. The proposed allocation approach improves PEV drivers’ accessibility to charging stations by choosing target locations in transportation network that increase the possibility of completing PEVs trips successfully. This model takes into consideration variations in driving behaviors, battery capacities, States of Charge (SOC), and trip classes.
The estimation of PEV penetration level and the target locations of charging stations obtained from the previous two steps are utilized to investigate the capability of existing distribution systems to serve PEV demand. The Optimal Power Flow (OPF) model is utilized to determine the maximum PEV penetration level that the existing electrical system can serve with minimum system enhancement, which makes it suitable for practical implementation even at the early adoption rates. After that, the determination of charging station size, number of chargers and charger installation time are addressed in order to meet the forecasted public PEV demand with the minimum associated cost. This part of the work led to the development of an optimization methodology for determining the optimal economical staging plan for installing FCSs. The proposed staging plan utilizes the forecasted PEV sales to produce the public PEV charging demand by considering the traffic flow in the transportation network, and the public PEV charging demand is distributed between the FCSs based on the traffic flow ratio considering distribution system margins of PEV penetration level. Then, the least-cost fast chargers that satisfy the quality of service requirements in terms of waiting and processing times are selected to match the public PEV demand. The proposed planning model is capable to provide an extensive economic assessment of FCS projects by including PEV demand, price markup, and different market structure models. The presented staging plan model is also capable to give investors the opportunity to make a proper trade-off between overall annual cost and the convenience of PEV charging, as well as the proper pricing for public charging services.
Acknowledgments
All praise is due to Allah almighty, who is the source of all knowledge in this world and whose countless bounties have enabled me to complete this thesis successfully. I would not have been able to finish my dissertation without the guidance of my committee members, help from friends, and support from my wife and family.
I would like to express my deepest gratitude to my advisor, Professor Magdy Salama, for his guidance, care, and patience and for providing me with such a wonderful atmosphere for conducting research. In addition to my advisor, I also wish to thank the rest of my thesis committee: Professor Mohammed Elhawary, Professor Amir Khajepour, Professor Kankar Bhattacharya, and Professor Tarek Abdelgalil for their encouragement and insightful comments.
Special thanks also to all colleagues and graduate friends, especially the Distribution Engineering group for sharing the literature, support, and fruitful discussions.
I also offer my gratitude to my father and my mother. My research would not have been possible without their help, their constant support and encouragement, and their never-failing good wishes.
Finally, I would like to thank my wife Ghaida, and my son Abdulaziz for always standing by me through both the good times and the bad.
Table of Contents
Table of Contents
List of Figures ... x
List of Tables ... xii
Nomenclature ... xiii
Introduction and Objectives ... 1
1.1 Research Objectives ... 3
1.1.1 Objective 1: Forecast PEV market sales and the forecast parameters ... 3
1.1.2 Objective 2: FCS allocation in the transportation network... 4
1.1.3 Objective 3: Evaluating the capability of distribution systems to serve PEV demand ... 4
1.1.4 Objective 4: Economical staging plan for implementing FCS posts ... 4
1.2 Thesis Outline ... 5
... 7
Background and Literature Review ... 7
2.1 Electric Vehicles (EVs) ... 7
2.1.1 Electric Vehicles Types ... 7
2.1.2 Battery Technologies ... 9
2.1.3 Charging Technologies ... 10
2.2 Forecast PEV market sales ... 12
2.3 Siting and sizing charging facilities... 13
2.3.1 Previous work in transportation field ... 14
2.3.2 Previous work in electrical field ... 15
2.4 Economics of implementing public charging stations ... 16
2.5 Chapter assessment and major research gaps ... 17
3.1 Problem description ... 20
3.2 PEV Sales Forecasting Model ... 21
3.3 Explanatory Variables of PEV Market Sales ... 23
3.3.1 Fuel cost savings ... 23
3.3.2 Average price difference ... 24
3.3.3 Average government incentives ... 24
3.3.4 Number of PEV models available in the market ... 24
3.3.5 Public charging infrastructure availability... 24
3.4 PEV sales forecast sample results (2016 – 2025) ... 25
3.4.1 PEV sales forecast Canada-wide (2016 – 2025) ... 25
3.4.2 PEV sales forecast for British Columbia (2016 – 2025) ... 27
3.4.3 PEV sales forecast for Ontario (2016 – 2025) ... 28
3.4.4 PEV sales forecast for Quebec (2016 – 2025) ... 29
3.5 Discussions ... 31
3.6 Chapter assessment ... 33
Fast Charging Station Optimal Location ... 34
4.1 Problem description ... 34
4.2 Trip Success Ratio Model ... 35
4.2.1 Travel Pattern model ... 36
4.2.2 Remaining electric range model ... 39
4.2.3 Trip Success Ratio model results ... 44
4.3 FCS Optimal Location model ... 47
4.4 FCS Optimal Location sample results ... 49
4.4.1 In city network case study ... 50
4.4.2 In city network (20 – node transportation 23 – node distribution) case study ... 51
4.5 Conclusions and discussion ... 57
4.6 Chapter assessment ... 57
Technical Evaluation for Accommodating PEV Load in Distribution System ... 59
5.1 Problem description ... 59
5.2 PEV and Normal Load Modeling ... 60
5.2.1 Typical Distribution system load modeling ... 61
5.2.2 PEV load modeling ... 61
5.2.3 Number of PEVs and charging characteristics ... 61
5.2.4 Traffic flow modeling ... 63
5.3 Technical evaluation formulation ... 66
5.4 Sample Results and Discussion ... 68
5.4.1 Coupled 23 – bus distribution system and 20 – node transportation network ... 69
5.4.2 Coupled 54 – bus distribution system and 25 – node transportation network ... 74
5.5 Chapter assessment ... 78
Economical Staging Plan for Implementing Fast charging Stations ... 79
6.1 Problem description ... 79
6.2 Economical Staging Plan Modeling ... 81
6.2.1 Investment cost ... 82
6.2.2 PEV market penetration... 83
6.2.3 FCS average and peak demand ... 84
6.2.4 Electricity prices and tariffs ... 84
6.3 Economical Staging Plan Formulation ... 85
6.3.1 The staging plan model... 85
6.3.2 Economic evaluation model ... 88
6.4 Sample Results and Discussion ... 89
6.4.2 Coupled 23 – bus distribution system and 20 – node transportation network ... 92
6.4.3 Coupled 54 – bus distribution system and 23 – node transportation network ... 98
6.5 Chapter assessment ... 105
Concluding Remarks ... 106
7.1 Summary and Conclusion ... 106
7.2 Contributions ... 108
7.3 Direction for Future Work ... 108
Bibliography ... 110
Appendix A ... 113
Appendix B ... 114
x
List of Figures
Figure 1-1 Distribution of greenhouse gas emissions by economic sector, Canada, 2013 [2] ... 2
Figure 2-1 PEV Charging System Power Levels ... 11
Figure 2-2 Geographic Information System Layers [19] ... 14
Figure 3-1 PEV Cumulative Sales Forecast for the U.S. (Adopted from [17]) ... 23
Figure 3-2 PEV Cumulative Sales Forecast for Canada (2016 – 2025) ... 26
Figure 3-3 PEV Cumulative Sales Forecast for British Columbia (2016 – 2025) ... 27
Figure 3-4 PEV Cumulative Sales Forecast for Ontario (2016 – 2025) ... 29
Figure 3-5 PEV Cumulative Sales Forecast for Quebec (2016 – 2025) ... 30
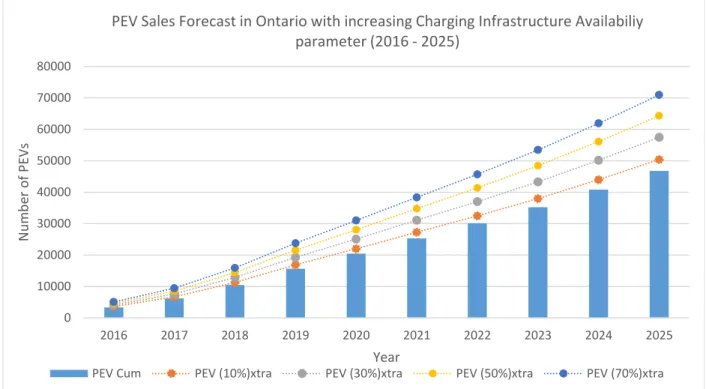
Figure 3-6 The correlation between PEV Sales Forecast in Ontario and charging infrastructure availability... 32
Figure 3-7 The correlation between PEV penetration level in Ontario and charging infrastructure availability ... 32
Figure 4-1 The Probability distribution function of trip mileage (NHTS 2009) ... 36
Figure 4-2 Daily Trip classification (starting time and mileage) ... 37
Figure 4-3. The probability of trips based on trip purpose (NHTS 2009) ... 38
Figure 4-4 The probability of Earn a Living trips based on trip mileage (NHTS 2009) ... 39
Figure 4-5 The probability of Earn a Living trips based on trip starting time (NHTS 2009) ... 39
Figure 4-6 The Proposed Trip Success Ratio Model ... 40
Figure 4-7 SOC estimation method flow chart... 42
Figure 4-8 Probability of daily trips per vehicle [53] ... 43
Figure 4-9 The relationships between the Trip Success Ratio and Charging Station Service Range for different battery capacities (In-city) ... 45
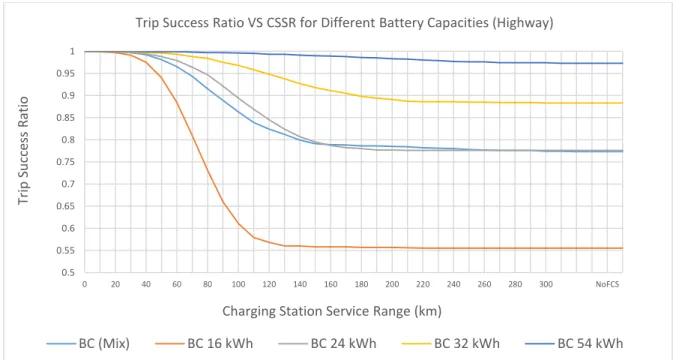
Figure 4-10 The relationships between the Trip Success Ratio and Charging Station Service Range for different battery capacities (Highway) ... 46
Figure 4-11 Selected Charging Stations (In-city Network, CSSR = 40 km) ... 51
Figure 4-12 The 20-node transportation 23-bus DS, and the selected charging stations, based on a CSSR = 25 km ... 52
Figure 4-13 The relationship between charging station construction costs and different CSSRs... 53
Figure 4-14 The relationship between charging station construction costs and number of success trips ... 54
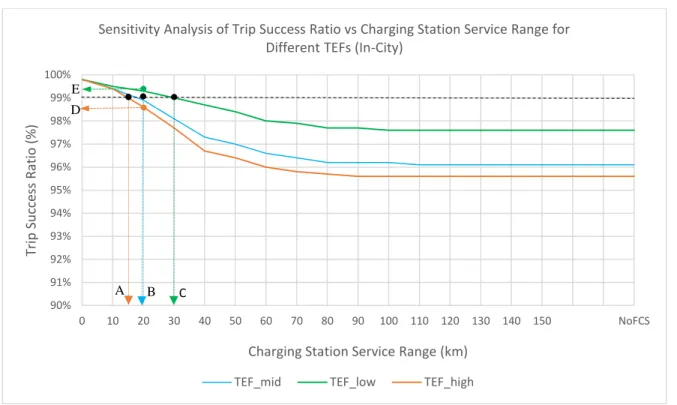
Figure 4-15 The sensitivity analysis of Trip Success Ratio and CSSR for different TEFs (in - City) ... 55
Figure 4-16 Candidate Charging Stations (Ontario Highway 401, OnRoute™) [73] ... 56
Figure 5-1 Home Arrival Time Distribution in North America (NHTS 2009)... 62
Figure 5-2 The Daily Travel Distance Distribution in North America (NHTS 2009) ... 62
Figure 5-3. The probability of PEV plugged at home (NHTS 2009) ... 63
Figure 5-4 The Relation between Peak – Hour and AADT volume; Source: FDOT, Project Traffic Forecasting Handbook 2002 [76] ... 65
Figure 5-5: The probability of PEVs arrived hourly to FCS (NHTS 2009) ... 65
Figure 5-6: Technical Evaluation Model for Accommodate PEV Demand ... 67
Figure 5-7 Graphical topology of the coupled 23 – node distribution and 20 – node transportation system... 69
Figure 5-8 The PEV penetration level margins of the coupled 23- bus distribution and 20- node transportation system ... 70
Figure 5-9 The peak demands of the coupled 23- bus distribution and 20- node transportation system ... 72
Figure 5-10 PEV load profiles of the coupled 23- bus distribution and 20- node transportation system ... 73
Figure 5-11 The Voltage profile of the coupled 23 – node distribution and 20 – node transportation system ... 74
Figure 5-12 Graphical topology of the coupled 54 – Bus distribution and 25 – node transportation system ... 75
Figure 5-13 The overall losses of the coupled 54 – Bus distribution and 25 – node transportation system ... 76
Figure 5-14 The Peak demands of the coupled 54 – Bus distribution and 25 – node transportation system ... 76
Figure 5-15 The PEV demand profiles of the coupled 54 – Bus distribution and 25 – node transportation system ... 77
Figure 5-16 The voltage profile of the coupled 54 – Bus distribution and 25 – node transportation system ... 77
xi
Figure 6-2 The relationship between the investment cost and the service time of FCS units based on a 20kWh charging event
... 83
Figure 6-3 The impact of different electricity tariffs on the markup-charging price with different utilization rates ... 91
Figure 6-4 The markup-charging price feasibility for different fast charging units according to their utilization rates ... 91
Figure 6-5 Comparison between Single – charging capacity and Multiple – charging capacities BCRs ... 97
Figure 6-6 Comparison between FCS 14 BCRs of Single – charging capacity and Multiple – charging capacities ... 101
xii
List of Tables
Table 2-1 Energy and Power Densities for Different Battery Technologies [7]... 10
Table 3-1 Summary of key studies in forecasting PEV market sales [12 – 17]... 22
Table 3-2 PEV sales regression coefficients (Canada-wide) ... 26
Table 3-3 PEV sales regression coefficients (British Columbia) ... 27
Table 3-4 PEV sales regression coefficients (Ontario) ... 28
Table 3-5 PEV sales regression coefficients (Quebec) ... 30
Table 3-6 Correlations between response variable and each explanatory variable... 31
Table 3-7 the influence of increasing charging infrastructure parameter on pev sales ... 31
Table 4-1 fitted pdf parameters of different TSR inputs ... 44
Table 4-2 PEV battery capacities and their market share [71] ... 45
Table 4-3 Comparison between MCLP model and MIP and Greedy methods proposed in [27] ... 50
Table 4-4 Ontario 401 Highway candidate FCS locations and cost [73– 74] ... 56
Table 6-1 Fast charging station specifications and investment costs [82] ... 82
Table 6-2 The traffic volume data for the coupled 23 – Bus and 20 – node system for low adoption rates ... 93
Table 6-3 The economical staging plan for the coupled 23 – Bus and 20 – node system for low adoption rates... 94
Table 6-4 The traffic volume data for the coupled 23-bus distribution and 20-node transportation network (Fig. 5-7) ... 95
Table 6-5 The economical staging plan for the coupled 23 – bus and 20 – node system for high adoption rates (single-charger) ... 96
Table 6-6 The economical staging plan for the coupled 23 – Bus and 20 – node system for high adoption rates (multiple-charger types) ... 97
Table 6-7 The traffic volume data for the coupled 54 – Bus and 25 – node system for low adoption rates ... 99
Table 6-8: The proposed economical staging plan for the coupled 54 – Bus and 25 – node system for low adoption rates (Single-charger) ... 100
Table 6-9: The proposed economical staging plan for the coupled 54 – bus and 25 – node system for low adoption rates (Multiple-charging Capacities) ... 102
Table 6-10 The traffic volume data for the coupled 54 – bus and 25 – node system (high adoption rates) ... 103
Table 6-11 The proposed economical staging plan for the coupled 54 – bus and 25 – node system for high adoption rates (Multiple charging capacities) ... 104
xiii
Nomenclature
Acronyms
AADT Annual Average Daily Traffic AER All – Electric Range
AFV Alternative fuel vehicle ARMA Autoregressive moving average
BARON Branch-And-Reduce Optimization Navigator BC Battery Capacity
BCR Benefit to cost ratio BEV Battery Electric Vehicle BMS Battery management system CSSR Charging station service range DS Distribution System
EDF Empirical Distribution Function EPRI Electric Power Research Institute EREV Extended range electric vehicle EV Electric Vehicle
EVSE Electric Vehicle Supply Equipment FCFS First-come first-served
FCLMs Flow–Capturing Location Models FCS Fast charging station
FCV Fuel Cell vehicle
FRLMs Flow–Refueling Location Models GHG Greenhouse gas
GIS Geographic Information System HEV Hybrid Electric Vehicle
ICEV Internal combustion LDC Load Duration Curve
MCLP Maximum Covering Location Problem MCS Monte Carlo simulation
MIP Mixed Integer Program
MLRM Multiple Logistic regression model NHTS National Household Travel Survey
xiv
NPV Net Present Value OD Origin–Destination OPF Optimal Power Flow
pdf Probability distribution function PEV Plug – in electric vehicle PHEV Plug – in hybrid electric vehicle RER Remaining Electric Range ROI Return of Investment
SAE Society of Automotive Engineers SOC State of Charge (based on AER) TEF Tractive Effort Factor
TN Transportation network TOU time-of-use rate TSR Trip Success Ratio V2G Vehicle to grid
VTD Virtual Travel Distance
Indices
N𝑏 Index of the electrical buses in the distribution system
𝑁𝐶𝑆 Index of fast charging station candidate locations
𝑁𝑇 Index of transportation nodes
n Index of scenarios
pn index of the number of charger posts inside the charging station rd Index of the roads
𝑢𝑡
index of the charger unit type and capacity (e.g. 50kW, 100kW) inside the charging station
𝑏𝑡 Index of battery capacities in the market 𝑐 Index of class of trip
𝑖,j,g Indices of load points 𝑘 Index of year 𝑞 Index of battery types
xv Parameter
AADT𝑟𝑑 The annual average daily trips on road (rd) in (veh. /day).
ADT(𝑝𝑛,𝑘) The average daily traffic flow of all vehicles at step (k) captured by an FCS post (pn)
Capacity𝑟𝑑 The road capacity based on the annual average daily trips on road (rd) in (veh.).
Cost(𝑘) The annualized cost of the FCS project at step (k)
Gask The annual average gas price in $/L in year k
Mk The set of ICEV models comparable with the PEV models in year k
PEV𝐹𝐶𝑆 The number of PEVs requiring fast charging service
wmkPEV The relative weight of the PEV model (m) to the comparable ICEV in year (k)
βnPEV The regression coefficients for the explanatory variables
εkPEV The error term for PEV sales
λ(𝑝𝑛,𝑘) The mean arrival rate of vehicles to the FCS post number (pn) at step (k) in (veh./hr.)
𝐴𝐴𝐷𝑇𝑔𝐹𝐶𝑆 The average number of PEVs served daily by FCS
𝐵𝐶𝑞 The battery capacities in kWh of PEVs available in the market
𝐷𝑗,𝑘 The matrix of the shortest paths between any transportation node (j) and node (k) in the
transportation network
𝐼(𝑖,𝑗)𝑚𝑎𝑥 The maximum current flowing between bus(i) and bus(j)
𝐼(𝑗,𝑔)𝑚𝑎𝑥 The maximum current flowing between charging station(g) and bus(j) 𝐾𝑟𝑑30 The ratio of traffic volume at the 30th peak hour on road (rd).
𝑀𝑎𝑥 𝑃 𝐹𝐶𝑆(𝑘) The maximum power limit provided by the distribution system for an FCS in year (k)
𝑀𝑎𝑥 𝑈𝑛𝑖𝑡𝑠(𝑘) The maximum number of charger posts allowable inside an FCS in step (k)
𝑃(𝑖,𝑡)𝐷 The basic electrical power demand at DS bus(i) at time (t)
𝑃(𝑖,𝑡)𝑠𝑠 , 𝑄(𝑖,𝑡)𝑠𝑠 Active and reactive power provided by the substation at DS bus(i) at time (t)
𝑃(𝑖,𝑡)𝐿𝑜𝑎𝑑, 𝑄(𝑖,𝑡)𝐿𝑜𝑎𝑑 Active and reactive power load at DS bus(i) at time (t) 𝑃𝐹𝐶𝑆 Charging power and duration for fast charging mode (level 3)
xvi
𝑄𝐿(𝑝𝑛,𝑘) The queue length for PEVs using post number (pn) at step (k)
𝑇𝐸𝐹(𝑐) The average tractive effort factor of a PEV conducting a trip in Class “c” (kWh/km)
𝑈𝑔,𝑡 Number of PEVs arrived at Fast charging station in DS node (g) in time (t)
𝑈𝑖,𝑡 Number of PEVs connected to DS node (i) in time (t)
𝑈𝑛𝑖𝑡𝐶𝑎𝑝(𝑢𝑡) FCS charger unit of type (ut) rating power capacity (kW)
𝑈𝑛𝑖𝑡𝐶𝑜𝑠𝑡(𝑢𝑡) FCS charger unit of type (ut) installation cost in ($)
𝑈𝑛𝑖𝑡𝑆𝑇(𝑢𝑡) FCS charger unit of type (ut) service time in (min.) to charge 16 kWh battery 𝑉𝑇𝐷(𝑐) The virtual travel distance in km of a trip in Class “c”
𝑉𝑚𝑖𝑛, 𝑉𝑚𝑎𝑥 Minimum and maximum voltage limits, respectively
𝑌𝐵𝑢𝑠(𝑖,𝑗) The bus admittance matrix (Y bus matrix ) of the distribution system
𝑡𝑞(𝑝𝑛,𝑘) The time PEVs spend in the queue to start charging at post number (pn) at step (k)
𝑡𝑠(𝑝𝑛,𝑘) The time PEVs spend during charging at post number (pn) at step (k)
𝑡𝑤(𝑝𝑛,𝑘) The total time PEVs spend in the entire FCS system using post number (pn) at step (k)
𝛼(𝑘) The PEV penetration level (α) at step (k)
𝜆𝑘,𝑔𝑅𝐻 The number of PEVs arrive to charging station (g) at rush hour in (veh.) at step (k) 𝜇(𝑝𝑛,𝑘) The mean service rate of a post number (pn) at step (k) in (minutes)
𝜇1, 𝜎1 The estimated mean and standard deviation of actual trip data pdf
𝜇2, 𝜎2 The estimated mean and standard deviation of state of charge pdf
𝜌(𝑝𝑛,𝑘) The occupation rate of charging post number (pn) at step (k)
Area The area in km2 of the network under study
Bk The annual benefit at the end of stage (k) for the FCS project BPV The benefit present value of the FCS project at time (k)
Charge The average public charging event (16 kWh) conducted by FCS
Ck The annual cost at the end of stage (k) for the FCS project CPV The cost present value of the FCS project at time (k)
CSSR The station service diameter in km, which is obtained from the TSR model di,j The distance between transportation nodes in the network
HWL The length of the highway under study in km
ICEVeff ICEV efficiency in (liter/km)
NV The total number of vehicles in the system based on the number of houses TEF, PEVeff PEV efficiency in (km/kW)
xvii
ti The transportation demand according to location (i)
Xjcs The x-coordinate of Charging Station (j) Yjcs The y-coordinate of Charging Station (j)
γ The PEV public charging share
𝐷𝐺𝑅 The annual growth rate of the basic electrical demand
𝑀𝑎𝑥 Tq The maximum allowable time that PEVs spend in the queue to start charging
𝑀𝑎𝑥 Tw The maximum allowable time that PEVs spend in the entire FCS system
𝛼 PEV penetration level
Functions
𝑓1 The probability distribution function of the actual trip data
𝐹1 The cumulative distribution function of the actual trip data
𝐹2−1 the inverse of the cumulative density function of SOC at the beginning of a trip in
Class “c”
𝐹𝑛 The CDF (step function) for the Empirical Distribution Function
Variables
𝐶𝑆𝑔 Flag variable equals 1 if charging station connected to bus (g); 0 otherwise
𝐼(𝑖,𝑗,𝑡) the current flowing between bus(i) and bus(j) at time (t)
𝐼(𝑗,𝑔,𝑡) the current flowing between bus(j) and charging station(g) at time (t)
𝑆𝑂𝐶(𝑐) The random PEV battery state of charge at the beginning of a trip in Class “c” 𝑆𝑂𝐶𝑅 The distributed random variable representing the charge level
𝑆𝑂𝐶𝑝𝑟𝑒𝑣 The random initial state of charge used to generate the SOC level
𝑆𝑆(𝑖) the apparent power of substation (i)
𝑉(𝑖,𝑡), 𝑉(𝑗,𝑡) Voltage magnitude of bus (i) and bus (j) at time (t)
𝑎(𝑔,𝑟𝑑) Decision variable to assign road (rd) to charging station (g).
𝑝𝑖,𝑡𝐻 , 𝑝𝑖,𝑡𝐹𝐶𝑆 Nodal charging powers of home charging and fast charging facilities at DS node (i) in time (t)
𝑦(𝑢𝑡,𝑝𝑛,𝑘) Decision variable equaling 1 if the unit type (ut) of the post number (pn) in step (k) is
xviii
𝜃(𝑖,𝑗), 𝛿(𝑖,𝑡) Phase angle deviation of branch (i,j) in time(t) and the voltage angle at bus (i) in time (t);
CSj The decision variable equaling ‘1’ if a station is located at node (j) and ‘0’ otherwise 𝑧 Normally distributed random variable between zero and one
Introduction and Objectives
High oil prices and energy demand are major challenges facing transportation sectors, as reliance on fossil fuels as the main source of energy has negative affected those sectors. Environmentally, the transportation sector overall produces a large percentage of emitted carbon dioxide, causing greenhouse gas (GHG) emissions to increase greatly. According to the U.S. Greenhouse Gas Inventory Report 2011 [1], 30% of carbon dioxide emissions in the US come from the transportation sector. In Canada, 35% of energy demand is represented by the transportation sector, and it is the second-highest source of GHG emissions, at 23% [2]. Therefore, meeting future transportation energy demands by finding alternative energy sources has gained much attention.
Shifting the high energy demands of transportation to the electrical system will raise some concerns. The future electrical system must be prepared to serve PEVs as a new type of load in the system. These loads have the ability to move, so the connection times and places of PEV loads have high degrees of uncertainty; hence, electrical systems have to be protected and mitigated from any technical impacts that PEV charging may cause. Moreover, the reliability and dependability of these new vehicles (PEVs) are considered as the main public concerns due to their limited driving range, whereas accepting this new technology depends primarily on the economic aspects for individuals as well as for the development of adequate PEV technologies. It is normally expected that PEVs will be recharged nightly at home [3], but the limited driving range of PEVs makes public charging a requirement for long-distance trips.
Charging PEVs at home depends mainly on users’ behaviors, so if there is no control over home charging for PEVs, zonal peak demands and local overloads will arise in the form of new distribution system problems [3]. Electric system infrastructure is designed to meet the highest expected demand, which occurs only at certain times of the day [4]. Such demand concentrations can cause significant stress on local power distribution systems, if this demand occurs at all time. The additional load imposed by high PEV penetration is expected to have severe consequences, such as feeders’ thermal limit violations, phase imbalances, transformer degradation, and fuse blowouts if not managed effectively [4]. However, providing alternatives to home charging will definitely assist local distribution utilities in managing the additional load from PEVs.
The availability of public charging infrastructure is a crucial factor in increasing the adoption of PEVs, because long-distance trips cannot be achieved with PEVs’ limited Electric Range (ER). Therefore, providing a public charging service as a complement to home charging will be an essential need. Electrical Fast Charging Stations (FCSs) will eventually be dispersed in the network, but inefficient
planning for implementing charging infrastructure will hold back PEV adoption. Hence, the siting and sizing of the charging stations, as well as the time for construction, should be properly planned in order to utilize FCSs effectively.
Figure 1-1 Distribution of greenhouse gas emissions by economic sector, Canada, 2013 [2]
The planning approach for implementing charging infrastructure should be done with a view to meet users’ and suppliers’ needs. PEV users require access to FCSs whenever they need them, accompanied with a high quality of service. Therefore, a lack of charging facilities due to siting FCSs inappropriately or not at all will have a negative impact on drivers’ convenience. The planning model should also enhance PEV drivers’ accessibility to charging points by optimally choosing those points from candidate sites in order to cover the planning network. Moreover, investing in premature technology is considered high-risk. Investors desire a profitable business that promises maximum profits and a secure investment, so providing a public charging service has to be evaluated with the consideration of all uncertainties and parameters affecting that business. Forecasting the future demand for PEVs will enhance investment security and give decision-makers and investors the ability to evaluate their investments over the long run, as well as providing electrical utilities data on the expected PEV demand that must be covered in their upgrade plans.
The key parameters influencing the implementation of FCS networks are: 1) the extent of PEV sales in the future; 2) the required locations for installing FCSs; 3) the proper capacity of the FCSs; and 4) the times to install FCS posts over the planning horizon to match the PEV pubic charging demand. Therefore,
the work presented in this thesis focuses primarily on those key parameters. The work can be described as consisting of four phases, with the first phase addressing forecasting PEV market sales and its correlation with public charging facility availability. The second phase deals with the allocation of public charging stations (FCSs) considering the impact of their locations on enhancing the ratio of successfully-completed PEV trips. In the third phase, the ability of distribution systems to serve the extra PEV demand is addressed considering the influence of shifting PEV demands. The fourth and last phase deals with the best staging plan for implementing the FCS posts over time considering quality of service as well as the economic benefit associated with FCSs. Those four phases are described in detail in the next section.
1.1 Research Objectives
As mentioned in the previous section, the key factors in planning the implementation of Fast Charging Stations (FCSs) can be summarized in the following points:
1- Forecasting PEV market sales and the main parameters that influence the PEV market size, including the availability of public charging facilities.
2- Determining the Optimal Locations of public charging facilities to cover the transportation network and to enhance the ability of PEVs to complete their trips successfully.
3- Evaluating the capability of distribution systems to serve PEV demands with no major upgrades, and the influence of using public charging facilities in managing PEV demands.
4- The best times to install public charging facilities to gradually match PEV demand considering the quality of charging service in terms of waiting and charging times, as well as the economic benefit associated with the installed facilities.
The research was therefore based on four main objectives related to those four parameters, as shown in Fig. 1.2 and outlined below.
1.1.1 Objective 1: Forecast PEV market sales and the forecast parameters
For this objective, the task was to estimate the key parameters that influence the market sales of Plug-in Electric Vehicles (PEVs) by developing a model that describes the correlation between the PEV market sales as a response variable and number of explanatory variables such as gas prices, electricity rates, available charging infrastructure, vehicle prices, and government incentives. Limited information on PEV sales is one of the major challenges that the estimation’s task faces. For many early adopters, power outlets at home are likely the primary charging facilities in the near term, but many emerging technologies and business models that are under development may also reshape PEV market sales and people’s recharging behavior in the longer term. The model should determine the key parameters among
the various factors that jointly influence the dynamics of PEV sales. The model should also identify the correlations between each of the considered factors and PEV market sales in order to evaluate the significance of their influences on PEV sales. A number of scenarios were considered with respect to the different parameters influencing the PEV market sales in order to examine these parameters relative significance.
1.1.2 Objective 2: FCS allocation in the transportation network
For the second objective, the research focused on the development of an allocation model for plug-in electric vehicle charging stations from a new perspective, which is PEV drivers’ convenience. The model should choose, from the available candidate sites, the charging station set that optimally enhances the ratio of trips completed successfully. A PEV trip can be completed successfully if the electrical energy remaining in the PEV’s battery is sufficient to allow the PEV to reach its destination; otherwise, the PEV battery has to be recharged on route in order to complete the trip. Optimal FCS location selection can guarantee a certain level of convenience for PEV drivers. The proposed model includes consideration of the uncertainty and the variability associated with vehicle usage, as well as of battery capacity.
1.1.3 Objective 3: Evaluating the capability of distribution systems to serve PEV demand For this objective, the models and the methodologies developed in the previous two objectives are utilized in order to evaluate the impact of the extra PEV load on electrical network performance in terms of voltage violation, power losses, and line loading. The additional PEV demand is assumed to be fed by the network as a normal charging load at home or fast charging load at public charging stations. Therefore, modelling the PEV charging demand for normal and fast charging levels is the first step in the evaluation. By adding this extra PEV loading to the selected target locations (Objective 2), the model can determine the maximum PEV penetration level (α) that the existing distribution network would be able to serve without violating its technical constraints. The model was also used to evaluate the influence of using public charging facilities in managing PEV demands as well as on distribution system performance.
1.1.4 Objective 4: Economical staging plan for implementing FCS posts
This objective is the development of an optimization methodology for determining the optimal economical staging plan for FCS post as a last step of implementation model. The PEV penetration level (Objective 1) and the target FCS locations (Objective 2) are utilized to produce public charging demand (the demand) using the traffic flow in the transportation network. Then, the maximum ability of distribution system to serve PEV demand (Objective 3) is considered as “the supply”. The solution should matching the demand and the supply by determining at which times the FCS posts should be installed, along with their power capacities, in order to obtain the minimum overall cost of the FCS project. Then,
the lowest-cost FCS posts that satisfy the quality of service requirements in terms of waiting and queueing times are selected. The model was also used to evaluate the profitability of FCS projects considering different charging prices.
Objective (1): Forecast PEV market sales and the influencing
parameters
Objective (2): FCS allocation in the transportation network
Objective (3): Evaluating the capability of distribution system
to serve PEV demand
Objective (4): Economical staging plan for implementing FCS posts
Chapter 3 Chapter 4
Chapter 5
Chapter 6
Implementation Planning for Electric Vehicle Charging
Infrastructure
PEV Penetration Level Target FCS Locations Distribution System MarginsFigure 1-2 Research objectives
1.2 Thesis Outline
The reminder of the thesis is organized as shown in Fig. 1.2, and the details of each chapter are as follows:
Chapter 2 provides a brief review of the background topics and the associated literature pertinent to this research.
Chapter 3 presents the proposed approach for forecasting PEV sales as well as its key influencing parameters, along with related simulation results.
Chapter 4 explains the Trip Success Ratio model for allocating FCSs in the transportation network, along with related case studies on both in-city and highway networks.
Chapter 5 introduces the evaluation approach to modeling PEV charging demand in order to determine the capability of distribution systems to serve that extra demand, as well as demonstrating the impact of using FCSs in managing PEV demand.
Chapter 6 describes the proposed economical staging plan for implementing FCS posts in order to optimally match PEV demand with the lowest cost FCS system.
Background and Literature Review
This chapter provides an introduction to and background information on Electric Vehicles (EVs) considering their types, battery technologies, and charging technologies, followed by a discussion of previous research. Finally, the drawbacks with respect to forecasting PEV market sales, siting and sizing charging stations, and the economics of using charging stations are highlighted in the chapter assessment.
2.1 Electric Vehicles (EVs)
Electrical system infrastructure has been built to meet the maximum expected demand, which occurs at most at 5% of the year overall [3]. However, electrical systems should deliver energy for other sectors and utilize their infrastructure, especially during off-peak times. That, as mentioned earlier, makes the electrical energy sector the best alternative for feeding the transportation sector. GHG emissions and oil prices are the biggest reasons to electrify the transportation sector. According to the Oregon Department of Energy, Oregonians drive over 60 billion kilometers per year, with more than 70% of these kilometers being driven in private cars [6]. Hence, electrifying private vehicles will be a cornerstone for energy-switching. Electric vehicles are not a new invention; they go back to the 1830s when the first electric vehicle, with no rechargeable battery, was driven [5]. Electricity was one of the preferred methods for motor vehicle propulsion; however, electric vehicles have not achieved the vast success of internal combustion (IC) vehicles, which normally have much longer ranges and are easy to refuel. Lately, due to the environmental impact of petroleum-based vehicles along with the price of oil, EVs have received increased attention over the traditional IC-engine vehicles. Therefore, different types of EV have been developed in conjunction with the development of batteries, electronics, and control technologies.
2.1.1 Electric Vehicles Types
The term “electric vehicle” refers to any vehicle that uses an electric motor for propulsion [5]. Electric trains, electric boats, and electric cars are examples of electric vehicles. In this research, the term “electric vehicle” will refer only to electric cars or automobiles that have an electric motor and are powered fully or partially by electricity. There are many types of electric vehicles; however, five of them, until now, have been the most popular types in research: Hybrid Electric Vehicles (HEVs), Fuel Cell Vehicles (FCVs), Plug-in Hybrid Electric Vehicles (PHEVs), Battery Electric Vehicles (BEVs), and Extended Range Electric Vehicles (EREVs). Because EV innovation has gained more attention recently, the possibility of having new types rather than just these five is expected in the near future.
2.1.1.1 Hybrid Electric Vehicle (HEV)
Hybrid Electric Vehicle refers to vehicles powered by a combination of an IC engine and an electric motor. The combination makes the HEV more energy-efficient than IC-powered vehicles, with almost half the fuel consumption. Moreover, CO2 emissions are decreased significantly due to the regenerative braking system. The design could even have more than two power sources, with a large number of variations [5]. HEVs operate exactly like IC-engine vehicles, but with higher fuel economy thanks to the electric motor.
2.1.1.2 Battery Electric Vehicle (BEV)
Battery Electric Vehicle refers to vehicles using electric motors powered only by chemical energy stored in battery packs. The concept of the BEV is very simple in that it uses electric motors and controllers for propulsion. The energy stored in rechargeable batteries is used as the fuel supply for the electric motor, and the controller regulates the vehicle’s speed by controlling the power supplied to the motor. Due to being fully dependent on a limited battery capacity, BEVs have a shorter driving range than conventional cars [5]
.
2.1.1.3 Plug-in Hybrid Electric Vehicle (PHEV)
Plug-in Hybrid Electric Vehicle refers to vehicles that use both gas and electricity. PHEVs can be perceived as an intermediate technology between HEVs and BEVs. A PHEV is a form of HEV with larger batteries to allow the vehicle to be driven farther, and it has the ability to charge its batteries directly from the electrical network. Having two different power sources gives PHEVs a high degree of energy resilience [5].
2.1.1.4 Fuel Cell Vehicle (FCV)
Fuel Cell Vehiclerefers to vehicles powered by fuel cells. The basic principle of the FCV is similar to the BEV, but the chemical driving force comes from combining a fuel, usually hydrogen, with oxygen, rather than batteries. Hydrogen is most frequently derived from methane or other fossil fuels; however, hydrogen is not technically an energy source, but is instead considered an energy carrier [5].
2.1.1.5 Extended Range Electric Vehicle (EREV)
Extended Range Electric Vehicle refers to vehicles powered by batteries, similar to BEVs, along with a small generator. The small onboard generator is used to recharge the batteries and extend the range of the vehicle in order to improve on the limited range of BEVs. The generator can be fed by various fuels: gasoline, diesel, ethanol, or even fuel cells [5].
In order to investigate the impact of charging PEVs as a new load on the distribution system, only Plug-in Electric Vehicles (PEVs) that have direct access to the electrical grid will be considered in this research. Charging points for these PEVs will be required in the distribution network, but different technical impacts can result due to FCS implementation, and so planning the distribution system and controlling these new loads deserves more attention. Battery sizes, charging times, and the movable nature of these loads should be considered in the planning process for these new types of loads. This type of load is mainly a battery type; therefore, a review of battery technologies is conducted to summarize the different properties of these technologies.
2.1.2 Battery Technologies
Electric vehicles have several components that comprise the electrical structure of the vehicle, regardless of the vehicle type. Battery packs, battery chargers, power converters, controllers, and electric motors are the key parts of any EV’s structure. The diversity in the major components of the vehicles affects EV performance and leads to different consequences of charging PEVs [4]. In addition, some similar types of EV have different electrical setups. For instance, PHEVs have two electrical structure types associated with them, parallel and series, and each type has its pros and cons [4]. The diversity of PEV structures is accompanied by different battery technologies, which means taking into consideration how these technologies work, the required specifications for using them, and their different properties.
In BEVs, the battery is the only energy source, and it is the component with the highest cost, weight, and volume. The battery should have a large energy capacity to meet the vehicle’s demand. In PHEVs, there is more than one energy source onboard the vehicle: a battery and some form of fossil fuel. In order to be more efficient, the volume and weight of PHEV batteries should be kept low. Although battery technology is advanced, applying it to automotive applications is considered a crucial challenge. A highway trip of EV requires that the battery contain a large amount of energy and can deliver high power for acceleration. For instance, a typical family car would need a battery capacity of about 50kWh to provide a one-way range of 350 km. The lead-acid battery is the traditional vehicle battery; however, a 50kWh lead-acid battery weighs 1.5 metric tons. The low energy density is the biggest obstacle limiting lead-acid batteries in driving applications. Table 2.1 shows a summary of the energy and power that can be delivered by different battery technologies [7].
Among all battery technologies, lead-acid is the most mature one, with a low initial cost; however, the limited lifecycle is the largest drawback. NiMH batteries have a high specific energy and are appropriate for HEVs. NiMH batteries are also used in PHEVs and BEVs; however, self-discharge is a drawback when the vehicle is not being used [7]. Lithium-ion (Li-ion) batteries have very high power and energy density. Li-ion battery technology is considered to be the next generation in PEV battery technology [4],
but faces a challenge in scaling up the size of the batteries while lowering costs [7]. The ZEBRA battery requires a high temperature of around 300°C to operate, but the energy density is high. It needs an energy supply for heating when it is not in use.
Table 2-1 Energy and Power Densities for Different Battery Technologies [7]
2.1.3 Charging Technologies
The Society of Automotive Engineers (SAE) describes charging technologies for electric vehicles in their publication Surface Vehicle Recommended Practice J1772 [8]. EV charging technologies are classified into three types: Level 1, Level 2, and Level 3. In Level 1 and Level 2 charging, the battery and converter are located onboard the vehicle, and the conversion from AC to DC occurs on-board in the converter. Power and data are delivered through the inlet, which is coupled to an off-board connector. PEVs are connected to the power grid via EV Supply Equipment (EVSE), which is located off-board. Level 1 charging uses single-phase 120V with a maximum rated current of 15-20A, and the supplied power is limited to about 1.9kW. No additional infrastructure is necessary for home or business usage [9]. Level 2 charging uses 240V single-phase, and the current is rated to 16-32 A. The vehicle charges faster with Level 2 charging than with Level 1 charging, and most PEV makers recommend Level 2 charging as the main charging method for PEVs [9]. Typically, the onboard charging system (for Level 1 and Level 2 charging) is fed by AC power. The PEV charger converts the AC power to DC on-board, so there is a limitation on the power due to the weight, size, and cost constraints of the converter [9]. Level 3 commercial fast charging can be installed in highway rest areas and city recharging points. The off-board charging system is controlled by a battery management system (BMS) in order to deliver the DC power to the vehicle. The charger type is supplied with a voltage ranging from 3-phase 230VAC to 600VAC, and the fast charging rate is limited to 250kW [10]
Lead-Acid NiCad NiMH Li-ion ZEBRA
Energy Density (Wh./kg) 30-35 50-60 60-70 60-150 125 Power Density (W/kg) 80-300 200-500 200-1500 80-2000 150
The diversity in battery sizes and charging power levels means that the charging time for PEVs can range from a few minutes to many hours. Table 2.2 shows the usage, expected power level, and charging time based on a 16 kWh battery size for different charging systems.
Figure 2-1 PEV Charging System Power Levels
Table 2-2 Charging Power Levels Based on [7 – 9]
Power level types Converter location Usage Expected power
level Charging time (16kWh) Level 1 120VAC Onboard Single-phase Home and Office 1.44 kW (15A) 1.92 kW (20A) 11 hours 8 hours Level 2 208VAC 240VAC Onboard Single-phase
Residential Outlet 3 kW (16A)
6 kW (32A)
5.5 hours 2.75 hours
Commercial outlet 15.5 kW (80A) 1 hour
Level 3 480VAC 600VDC Off-board three-phase Commercial Fast Charging Station (FCS) 50 kW 100 kW 250 kW 20 min 10 min 4 min Level 1 120 V (15 – 20 A) Home - Work Level 2 240 V (16 – 32 A) Home 240 V (32 – 80 A) Public Level 3 480 VAC Public CS 600 VDC FCS
2.2 Forecast PEV market sales
The charging load of PEVs is influenced by many factors: number of PEVs, trip purpose, PEV density, arrival time, arrival rate, State of Charge (SOC) level based on electric range, battery capacity, charging time, and travel patterns [11]. For many early adopters, power outlets at home are likely the primary charging facilities in the short term, but many emerging technologies and business models that are under rapid development may also reshape PEV market sales and people’s recharging behavior in the longer term. One of the key parameters that should be considered in estimating the extra demand of PEVs is the number of PEVs that will be consuming electrical energy from the distribution system in the future. Forecasting the future demand for PEVs will provide electrical utilities an estimation of extra loading that they should consider in their planning of distribution systems. In addition, forecasting PEV demand will enhance investment security, and it gives decision-makers and investors the ability to evaluate their investments over the long run.
In the face of the many challenges, forecast information for PEV sales and recharging demand is urgently needed to assess the long-term impacts of PEVs on the distribution system, which could be dramatically more significant than the current impact, which has been virtually unnoticeable. Several existing studies have addressed these issues. One of those studies, conducted by the Pacific Northwest National Laboratory (PNNL) [12], scrutinized PEV market penetration scenarios based on information obtained from the literature and interviews with industry representatives and technical experts. Three scenarios (hybrid technology-based assessment, R&D goals achieved, and the supply-constrained scenario) were presented for the period 2013 – 2045, and the annual market penetration rates for PEVs were forecast for that period. The results showed that PEV market penetration was expected to reach 9.7%, 9.9%, and 26.9% by 2023 in USA market, and 11.9%, 29.8%, and 72.7% by 2045 for the three scenarios, respectively. An Electric Power Research Institute (EPRI) report [13] estimated new vehicle market shares of conventional, hybrid, and plug-in electric vehicles using choice-based market modeling of customer preferences, and the results showed that PEVs will have market shares of 20%, 62%, and 80% by 2050 in the low-, medium-, and high-penetration scenarios respectively. An Oak Ridge National Laboratory (ORNL) study [14] forecast that the market for PEVs in the US will be approximately 1 million by 2015, which agrees with President Obama’s expectations [14]. The ORNL’s Market Acceptance of Advanced Automotive Technologies Model and UMTRI’s Virtual Automotive Marketplace Model were utilized in [14] to assess a list of policy options in terms of their potential for improving PEV sales in the next two decades. In a Morgan Stanley report [15], proprietary information was used to forecast sales of hybrid electric vehicles and PEVs, and its prediction was that market demand will reach 250,000 by 2015 and 1 million by 2020. In [16], Gallagher et al. used a Multiple Linear regression model to estimate how hybrid electric vehicle sales respond to various types of
incentives. Their results showed that: “a one thousand dollar tax waiver is associated with a 45% increase in hybrid vehicle sales, whereas a one thousand dollar income tax credit is associated with a 3% increase in hybrid vehicle sales.” A related recent study in [17] used a sales forecasting model that was based on information about consumer preferences between hybrid electric vehicles and internal combustion engine vehicles, which was extracted from hybrid electric vehicle historical data. A Multiple Logistic regression model was utilized in the study, and it considered some explanatory variables extracted from hybrid vehicle historical sales data with the assumption that PEV market sales would follow the pattern of HEV market sales. Since they used hybrid electric vehicle data, the correlation between charging infrastructure availability and PEV market sales was not addressed. According to [18], battery range is customers’ biggest concern, followed by cost, so considering charging infrastructure availability in forecasting PEV market sales will lead to a better estimation, since we forecast PEV sales rather than HEVs.
2.3 Siting and sizing charging facilities
One problem in siting and sizing public charging stations lies in connecting two different systems together: the electric distribution system and the transportation system. Each system has its own requirements and restrictions for choosing the best siting and sizing of charging infrastructure, and focusing on one system’s requirements and ignoring the other’s will lead to favoring places for one system, which might cause some concerns and difficulties for the other. For instance, if the problem of siting and sizing charging stations is solved based only on the electrical system’s requirements, and the diversity of travel patterns and traffic flow aspects are not considered, that may lead to locating charging stations at sites favorable for electrical utilities but not easy for drivers to access due to not including traffic flow aspects. As a result, the solution will not be sufficient to serve the demand of PEVs that move in the transportation network. On the other hand, locating charging stations based only on traffic flow might result in difficulty for the distribution system to supply a concentrated PEV demand in those locations due to local overload problem. Therefore, both systems have to be considered in order to obtain the best solution for siting and sizing charging stations. Figure 2.3 shows the interconnection between the distribution and transportation systems, using the Geographic Information System (GIS) [19].
Figure 2-2 Geographic Information System Layers [19]
Recently, more attention has been paid to the optimal siting and sizing of PEV charging stations. The placement and sizing of refueling and recharging stations has also been investigated recently in electrical as well as transportation publications, and the next two subsections present a review of the previous work to solve that problem on both the electrical and transportation systems.
2.3.1 Previous work in transportation field
In recent transportation research on siting refueling stations [20 – 23], Flow–Refueling Location Models (FRLMs) have been developed to site Alternative Fuel Vehicle (AFV) stations for vehicles that need refueling during trips. FRLMs are an extended form of Flow–Capturing Location Models (FCLMs), which have been used for siting convenience stores [24]. FRLM formulation is obtained by adding vehicle travel range as a constraint. All trips from the same Origin–Destination (OD) pair have been assigned to one path in [20] or for several detours in [21], but ignoring travelers’ habits and behaviors will lead to inappropriate locations for FCSs, especially in-city. Because the suitability of their model depends on the availability of trip destination data, the lack of PEV trip data will make their model inapplicable for in-city PEV – FCS locating.
The diversity of various vehicles’ ranges has not been considered in previous models [20 – 23]. In addition, they considered only fixed battery capacities and did not consider varying SOC levels during trips. The detours and alternative paths are assumed based only on a single scenario; however, considering different vehicle ranges – using different SOC levels and battery capacities – will accordingly
change those detours and alternative paths. As a result, the number of electric vehicle FCSs planned in the system will be inadequate in an in-city network due to discounting the diversity of PEV Remaining Electric Ranges (RERs).
2.3.2 Previous work in electrical field
Electrifying the transportation sector is projected to enhance energy efficiency. The key concern is with regard to the sufficiency and viability of the power infrastructure with large-scale PEV integration [25]. The diversity of travelers’ habits, behaviors, trip distances, and the ability of charging station networks to cover the demand sufficiently are not well demonstrated in the previous electrical research on siting and sizing charging stations, although a number of studies have considered aspects related to the site selection of charging stations and the overall planning of FCS networks [25 – 33].
The diversity of travel patterns and traffic flow aspects are not considered in [25 – 31], which may lead to locating charging stations at sites favorable for electrical utilities but not easy for drivers to access due to not including traffic flow aspects. In [32], the traffic flow and charging requirements are included as constraints in the model, but the diversity of trip mileages and the variety of PEV electric ranges are not considered. A study in [33] was done to look at charging station placement from a new perspective of FCS accessibility; however, the authors assumed that charging station service ranges are equal to the average of the electrical ranges available in the market. This assumption is questionable due to the high diversity in the ranges of PEVs (80 – 300 km), which is not addressed in the model. In the model, if most PEV ranges are not considered in relation to average battery capacity, the variations in ranges will have a real impact on the percentage of incomplete PEV trips due to insufficient energy in the PEVs batteries.
A few studies have focused on the problem of siting and sizing PEV charging stations to match the expected PEV demand [34 – 38]. A two-step screening method considering the environmental factors and the service radius of PEV charging stations is proposed in [34] to determine the optimal placement and sizing of PEV charging stations. In [35], a hierarchical clustering analysis is developed to identify the Battery Electric Vehicle (BEV) recharging demand clusters, and then the charging demands of these clusters are met by formulating a BEV charging station allocation model, but charging station capacity was not considered in the model. Similarly, in [36], a maximal covering model was developed in order to site only a fixed number of charging stations in central urban areas. In [37], a multi-objective planning strategy model maximizes the traffic flow to charging facilities and minimizes the investment and operational cost of the distribution system; however, the estimation of PEV demand is not addressed well in the model, and they considered only a fixed penetration level of PEVs. Their proposed model will choose the minimum number of FCSs that have high levels of traffic flows, but that number of FCSs may not be adequate to match PEV demand, which can lead to traffic network problems if the charging
facilities have insufficient sizing. In [38], the fast charging station siting and sizing are obtained using a developed P-center method using a Mixed Integer Program (MIP). The fast charging demand is considered in this study as an urgent demand, and the investment budget for matching this demand is fixed, which may lead to insufficient sizing when the budget is exceeded. It is important to consider the economic assessment and investment availability in studying the optimal deployment of fast charging stations, however, considering them should not limit the number of FCSs or their sizes in order to obtain a better solution.
2.4 Economics of implementing public charging stations
Many research efforts have been dedicated to the problem of PEV integration considering both alleviating the negative impacts of large-scale penetration of PEVs and covering the potential benefits obtained by integrating electric vehicles into the grid (V2G). The main research areas are in investigating the operational influences on the distribution network of using PEVs [39 – 42], the integration of PEVs with renewable energy generation [43 – 45], and coordinated charging and discharging strategies [46 – 48]. However, only a few studies have investigated the implementation planning of PEV public charging stations from economic aspects.
In literature, only a few papers have considered the implementation of fast charging stations from an economic perspective. The authors of [49] investigated the technical-economic factors for combining gas stations and PEVs fast chargers. The daily PEV demand in the study is assumed as being similar to gas station demand, which leads to overestimating the PEV load in the early adoption stage. The economic evaluation results are questionable due to ignoring fast charging service prices and ignoring the variety of charging unit capacities. A remarkable study has been done in [50], where the authors analyzed the economics of PEV fast charging infrastructure in Germany using a Return on Investment (ROI) model. The results of the study showed how the key parameters – PEV demand and markup price – influence the profitability of FCSs; however, the PEV demand is estimated in the study based on gasoline station data without considering the effect of having home and work charging (Levels 1 and 2 respectively) as substitutes. Hence, it leads to inaccurate estimations that will influence the economic evaluation negatively. In [51], a non-cooperative Stackelberg game is proposed to determine the optimal charging price that leads to the Stackelberg social equilibrium point. The Smart Grid (SG) is considered the leader, setting the charging price, and PEVs are the followers that choose their charging strategies. The study did not consider the infrastructure cost of both the SG and the FCS network in its model, which is required in the economic assessment. It is assumed in the study that electrical utilities own the charging stations, which is not generally the case in the FCS market. In [52], an FCS profit optimization model based on the fast charging service price is developed. The model uses the Net Present Value (NPV) approach to
determine the economic viability and the fast charging price. The PEV demand profile is not clearly mentioned in the study, and the electricity cost is assumed to be at the medium voltage tariff, which is not applicable for different FCS locations.
2.5 Chapter assessment and major research gaps
This chapter began by giving a brief review of EVs, and it then covered the classification of EVs, the recent battery technologies being applied for EVs, and the different PEV charging technologies. Anxiety over the limited driving range of EVs and long charging times are major obstacles that decrease public acceptance of EVs; however, spreading out public charging stations (for Level 3) will assist EV penetration. Therefore, the implementation planning of public charging stations has to be developed while also looking at the consequences to the reliability of the distribution network of using only the home-charging alternative.
The literature review included in this chapter reveals that a number of studies have been conducted in the area of forecasting PEV market sales (see Section 2.2). Despite the amount of research completed, major drawbacks are still unresolved and have provided the impetus for the work presented in this thesis. With respect to the PEV market sales methodologies described in the literature, these drawbacks can be summarized as follows:
The absence of PEV charging data presents a problem. The work presented in the area of estimating PEV charging demand must be enhanced using additional data that reflects charging characteristics and driver behaviors, but this information will not be available prior to significant PEV penetration.
Most of the forecasting models have used hybrid vehicle historical sales data with the assumption that PEV market sales would follow the HEV market sales pattern. Since they used hybrid electric vehicle data, the correlation between charging infrastructure availability and PEV market sales has not been addressed. However, the forecasting model for PEVs has to include the availability of public charging infrastructure due to its necessity for enhancing PEV adoption. It is also clear from the discussion in section 2.3 that the research published in the area of siting and sizing charging stations has some limitations, and that it has overlooked significant aspects that can increase the accuracy of the results. According to the authors’ best knowledge, most of the previous electrical and transportation research has not considered certain items, and these limitations can be summarized in the following:
![Figure 1-1 Distribution of greenhouse gas emissions by economic sector, Canada, 2013 [2]](https://thumb-us.123doks.com/thumbv2/123dok_us/10135988.2914625/20.918.140.798.212.582/figure-distribution-greenhouse-gas-emissions-economic-sector-canada.webp)


![Table 4-3 Comparison between MCLP model and MIP and Greedy methods proposed in [27]](https://thumb-us.123doks.com/thumbv2/123dok_us/10135988.2914625/68.918.159.763.545.942/table-comparison-mclp-model-mip-greedy-methods-proposed.webp)