Copyright © 2006 Boeing. All rights reserved.
Object Management Group Workshop
by
David E. Farrar
Associate Technical Fellow
Process Integration & Command Media
Program Management & Business Excellence
Global Mobility Systems
Precision Engagement & Mobility Systems
Integrated Defense Systems
OMG Workshop at Hyatt Regency SF Airport Hotel – Burlingame, CA
17 October 2006
Process-Based Management:
A Winning Strategy
The Global Mobility Systems Organization
Commercial
Airplanes
Boeing Capital
Corporation
Connexion by
Boeing
Integrated
Defense
Systems
The Boeing Company
Global
Mobility
Systems
Boeing
Technology
Shared
Services
Group
Network and
Space Systems
C-17 Program
767 Tankers
Program
Derivative
Airplane
Programs
Advanced
Mobility
Systems
Precision
Engagement
and Mobility
Systems
Support
Systems
Advanced
Defense and
Security
Systems
Global
Strike
Systems
Airborne Anti-Submarine
Warfare and Intelligence,
Surveillance and
Reconnaissance
Rotorcraft
Systems
Advanced Precision
Engagement and
Mobility Systems
3
Copyright © 2006 Boeing. All rights reserved.
The Global Mobility Systems Products
C-40A
C-32A
Next
Generation
C-40B
GMS Vision, Mission, and Values
•
Good Corporate Citizenship
•
Customer Satisfaction
•
A Diverse and Involved Team
•
Integrity
•
People Working Together
•
Leadership
A&T Values
A&T provides solutions that shape the future of mobility for our global military and commercial
customers. We will leverage our strengths, team-based culture, supplier partners, and
customer knowledge to achieve market leadership and provide unprecedented value to all
stakeholders.
A&T Mission
The world’s first choice for innovative mobility solutions – setting the standard for excellence
A&T Vision
People working together as a global enterprise for
aerospace leadership
Boeing Vision 2016
•
Good Corporate Citizenship
•
Customer Satisfaction
•
A Diverse and Involved Team
•
Integrity
•
People Working Together
•
Leadership
Global Mobility Systems Values
Global Mobility Systems provides solutions that shape the future of mobility for our
military and government customers. We will leverage our strengths, team-based culture,
supplier partners, and customer knowledge to achieve market leadership and provide
unprecedented value to all stakeholders.
Global Mobility Systems Mission
The world’s first choice for innovative mobility solutions – setting the standard for excellence
Global Mobility Systems Vision
People working together as a global enterprise for
aerospace leadership
Boeing Vision 2016
5
Copyright © 2006 Boeing. All rights reserved.
“The Law of Change” Drives Improvement
If you want a different outcome, you must change
either the process, the product, or both.
The Corollary
If you always do what you have always done, you will
get what you have always gotten!
Cultural Change Focused on Processes
$$, schedule, cost, quality
Product / service-oriented
Tribal work-knowledge
Directed solutions
Reward heroes
Quality, schedule, cost
Customer solution-oriented
Process management
Team-based solutions
Reward values / results
$$, schedule, cost, quality
Product / service -oriented
Tribal work -knowledge
Directed solutions
Reward heroes
Quality, schedule, cost
Customer solution -oriented
Process management
Team -based solutions
Reward values / results
Then
Now
Schedule, cost, quality
Product / service-oriented
Tribal work-knowledge
Directed solutions
Reward heroes
Quality, schedule, cost
Customer solution-oriented
Process management
Team-based solutions
Reward values / results
7
Copyright © 2006 Boeing. All rights reserved.
Adapted from
Applied Strategic Planning: A Comprehensive Guide
, page 330, published by Pleiffer and Company, 1992
Process Management Brings it Together
Planned
Journey
Strategic Direction
Work Group
Individual
Many Unaligned
Projects
Tactical Direction
Malcolm Baldrige
Principles
Baldrige Criteria Framework:
A Systems Perspective
3
Customer and
Market Focus
4
Measurement, Analysis, and Knowledge Management
1
Leadership
2
Strategic
Planning
5
Human Resource
Focus
6
Process
Management
7
Business
Results
9
Copyright © 2006 Boeing. All rights reserved.
Baldrige Category 6 : Process Management
STABLISHMENT: What are your key value creation and key
support processes and how does your organization determine
them?
EQUIREMENTS: How do you determine requirements for your
key value creation processes, incorporating input from
customers, suppliers, and partners?
EASURES: What are your key indicators or performance
measures to control and improve these processes?
REVENTION: How do you prevent rework and defects in these
processes?
Characteristics of a Process
Characteristics of a Process
-
-
Managed
Managed
Organization
Organization
•
Senior Leadership Buy-in
•
View business as a collection of processes
•
Strategic plans drive processes
•
Clear relationships between processes and
key business results and goals
•
Focuses on key customer-driven processes
•
Work Teams learn processes
11
Copyright © 2006 Boeing. All rights reserved.
Characteristics of a Process
Characteristics of a Process
-
-
Managed
Managed
Organization (cont’d)
Organization (cont’d)
•
Manage by data
•
Managerial patience
•
Emphasis on sustainable improvements
•
Improvement in processes across the
business
•
Integrated with other initiatives
•
Common processes and standardization
What is a Process?
What is a Process?
Resources
Inputs
Tasks
Requirements
Outputs
A set of sequential or concurrent tasks performed by a process team led by a
Process Owner…
that transforms inputs
from suppliers…
into useful outputs
for customers…
E.g., Requests, Raw
Materials, Parts, Tool
Designs, Planning
Documents, Maintenance
Schedule
E.g., Completed
Documents, Completed
Assemblies, Fabricated
Tools, Delivered Kits,
Functioning Equipment
13
Copyright © 2006 Boeing. All rights reserved.
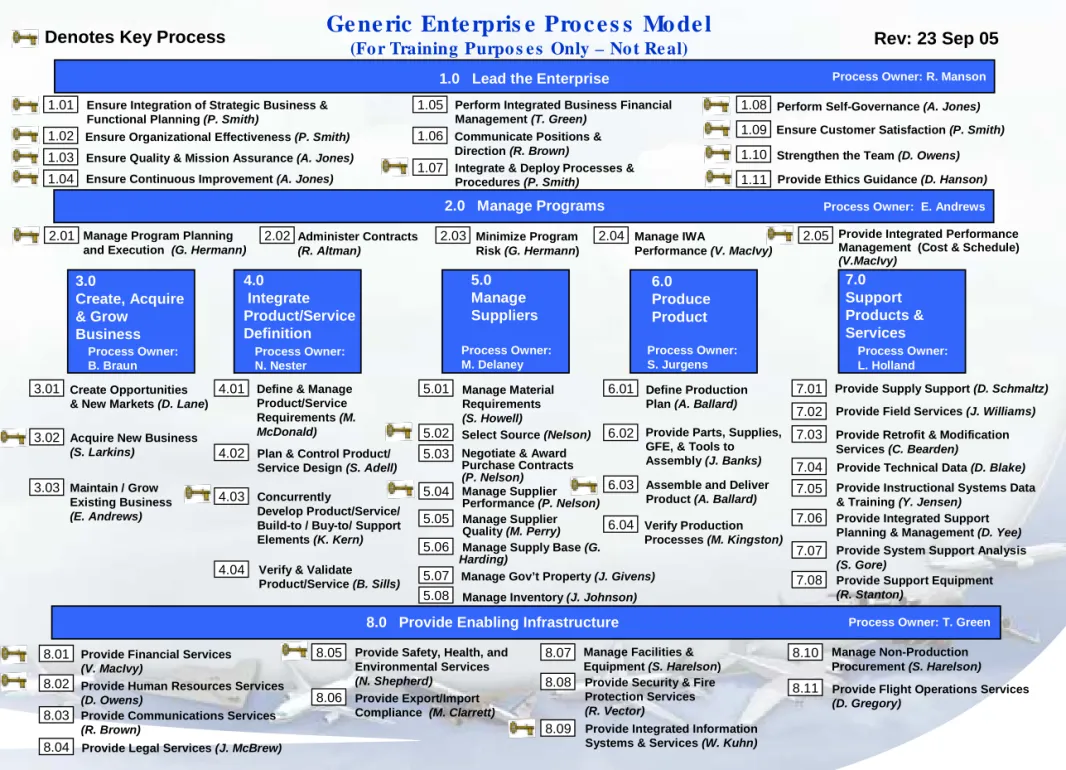
Generic Enterprise Process Model
Ge ne ric Ente rpris e Pro c e s s Mo de l
(Fo r Training Purpo s e s Only – No t Re al)
1.0 Enterprise Management
1.0 Lead the EnterpriseProvide Legal Services (J. McBrew)
Integrate & Deploy Processes & Procedures (P. Smith)
Ensure Quality & Mission Assurance (A. Jones)
Ensure Integration of Strategic Business & Functional Planning (P. Smith)
Ensure Organizational Effectiveness (P. Smith)
Ensure Continuous Improvement (A. Jones)
Perform Integrated Business Financial Management (T. Green)
2.0 Manage Programs
8.0 Provide Enabling Infrastructure
Perform Self-Governance (A. Jones)
Ensure Customer Satisfaction (P. Smith)
Manage IWA
Performance (V. MacIvy)
Minimize Program Risk (G. Hermann) Manage Program Planning
and Execution (G. Hermann)
Process Owner: E. Andrews Process Owner: R. Manson
Administer Contracts
(R. Altman)
Provide Financial Services
(V. MacIvy)
Provide Integrated Information Systems & Services (W. Kuhn)
Manage Facilities & Equipment (S. Harelson) Provide Human Resources Services
(D. Owens)
Provide Security & Fire Protection Services
(R. Vector)
Manage Non-Production Procurement (S. Harelson)
Provide Safety, Health, and Environmental Services (N. Shepherd) Provide Export/Import Compliance (M. Clarrett) 3.0 Create, Acquire & Grow Business Create Opportunities & New Markets (D. Lane) Acquire New Business
(S. Larkins) Maintain / Grow Existing Business (E. Andrews) Process Owner: B. Braun 4.0 Integrate Product/Service Definition
Plan & Control Product/ Service Design (S. Adell)
Define & Manage Product/Service Requirements (M. McDonald)
Verify & Validate Product/Service (B. Sills) Process Owner: N. Nester 5.0 Manage Suppliers Manage Material Requirements (S. Howell)
Select Source (Nelson)
Negotiate & Award Purchase Contracts (P. Nelson) Manage Supplier Performance (P. Nelson) Manage Supplier Quality (M. Perry)
Manage Supply Base (G. Harding) Process Owner: M. Delaney 6.0 Produce Product Define Production Plan (A. Ballard)
Assemble and Deliver Product (A. Ballard)
Verify Production Processes (M. Kingston)
Provide Parts, Supplies, GFE, & Tools to Assembly (J. Banks) Process Owner: S. Jurgens 7.0 Support Products & Services Process Owner: L. Holland
Provide Supply Support (D. Schmaltz)
Provide Technical Data (D. Blake)
Provide Retrofit & Modification Services (C. Bearden)
Provide Field Services (J. Williams)
Provide Instructional Systems Data & Training (Y. Jensen)
Provide Integrated Support Planning & Management (D. Yee)
Provide System Support Analysis
(S. Gore)
Provide Support Equipment
(R. Stanton)
Process Owner: T. Green
Provide Communications Services
(R. Brown)
Communicate Positions &
Direction (R. Brown) Strengthen the Team (D. Owens)
Provide Integrated Performance Management (Cost & Schedule)
(V.MacIvy)
Concurrently
Develop Product/Service/ Build-to / Buy-to/ Support Elements (K. Kern)
Manage Gov’t Property (J. Givens)
Manage Inventory (J. Johnson)
Provide Flight Operations Services
(D. Gregory)
Provide Ethics Guidance (D. Hanson)
Denotes Key Process
1.01 1.02 1.03 1.04 1.05 1.06 1.07 1.08 1.09 1.10 1.11 2.01 2.02 2.03 2.04 2.05 3.01 3.02 3.03 4.01 4.02 4.03 4.04 5.01 5.02 5.03 5.04 5.05 5.06 5.07 5.08 6.01 6.02 6.03 6.04 7.01 7.02 7.03 7.04 7.05 7.06 7.07 7.08 8.01 8.02 8.03 8.04 8.05 8.06 8.07 8.08 8.09 8.10 8.11
Rev: 23 Sep 05
Processes can be expanded to
lower, more-detailed levels
Levels of Processes: Owners at Each Level
Levels of Processes: Owners at Each Level
Level 1
Level 2
Enterprise Process Model
Level 0
Core Area
Executives
Executives
and others
15
Copyright © 2006 Boeing. All rights reserved.
Levels of Processes
Levels of Processes
(cont’d)
(cont’d)
Level 0 Process:
6.0 Produce Product
Tier 1 Process:
6.03
Assemble and
Deliver Product
Tier 2 Process:
6.03.02 Produce
Major Assemblies
.01
.03
.04
.05
.06
.07
.08
.02 Produce Major Assemblies
.01
.03
.04
.05
.06
.07
.08
Tier 3 Process:
6.03.02.02
Perform 17 A/N/Y
Subassemblies
and so on……...02 Perform 17 A/N/Y Subassemblies
Level 0
Process Model
Level 1 Level 1 Level 1 Level 2 Level 2 Level 2 Level 3 Level 3Level 3 and so on……..
Core Family
As one tier is defined the next
lower tier is identified
Executives
Executives
and others
Process Owners: What Do They Do?
•
Assigned at every level of the Process Model
•
Include Executive Leaders at Level 0 and at many
Level 1s
•
Qualifications:
•
May or may not be a manager
•
Usually a subject matter expert on the process
•
Uses the process to manage that piece of the
business
•
May be accountable for activities outside
functional control
17
Copyright © 2006 Boeing. All rights reserved.
Process Owners: What Do They Do?
•
Responsible for:
•
Implementing the steps of PBM
•
Documenting the process
•
Ensuring process performance
•
Ensuring both internal and external customer involvement
•
Involving suppliers of incoming processes
•
Improving the process
•
For certain processes, may manage the process jointly with
the Government Customer
•
Must ensure associated procedures are current and are
Step 1
Define the
Process
Step 3
Determine
Performance
Step 2
Establish
Metrics
Step 4
Analyze
Process
Stability
Step 5
Set Goals
Step 6
Analyze
and Plan
Improvements
Step 7
Implement
Improvements
Continuous Process
Improvement Loops
If Normal Monthly Performance Cycle
If Metric Change Required
If Process Change Required
I m p r o v e m e n t O p p o r t u n i t i e s
Gate 1
Gate 2
Gate 3
Gate 4
When the
process
has not
been
defined
When the
process has
been defined,
but no
metrics
When the
process is
defined, has
metrics, but
is not stable
When the process
is defined, has
metrics, is stable,
but still needs
improvement
The Seven Steps of Process-Based Management
Six to Ten Manageable Steps From Customer’s Perspective How You
Are Doing Predictable
Performance
Where You Are Going
and Why How and
Why You Will Get There
Get There!
Process Owners/Teams Use PBM Seven-Step
Methodology
Process Owners/Teams Use PBM Seven-Step
Methodology
19
Copyright © 2006 Boeing. All rights reserved.
Process Owners/Teams Document and Define
Processes, with Customer Agreement
Process Title:
Process No.:
Next-Higher-Level Process:
Creation Date:
Revision Date:
Process Objective:
Lead PBM Deployment
1.07 Integrate and Deploy Processes and Procedures
Lead PBM deployment across GMS Programs and IDS-LB Tenants as appropriate in
alignment with IDS business strategies
1.07.02
9-27-2005
• Strategies/Flow-Down Goals/Deployment Plans • Training Requests
• Consulting and Facilitation Requests • PBM Products and Data
• Gap Analyses
• Training Surveys/Suggestions • Internal/External Assessment Results
• Deployment Plan /IMP/IMS
• PBM Methodology / Command Media / Training Materials
• Systems to Manage PBM/Health and Deployment Reports
• PBM Expertise / Process Owner Consulting & Coaching / Process Team Facilitation
• Effective Resolution of Process Related Conflicts • Training
• Corrective/Preventive Actions
• TA-288M, Process Owners Manual
• TA-318, PBM
James Jones
Glen Green, DCMA
PBMS; Root Cause Corrective Action System
• Receive Inputs from Suppliers
.01 Define PBM Methodology/
Command Media
.02 Plan PBM Approach
.03 Implement PBM Deployment
.04 Analyze PBM Deployment
and Performance Results
.05 Capture Lessons Learned
and Improve PBM
• Deliver Outputs to Customers
Process Tasks
Beginning Boundary Task:
Ending Boundary Task:
Inputs
Suppliers
Customers
Process Requirement Sources:
Process Owner:
Process Customer(s):
Process Specialist:
Information
Systems
Outputs
Outputs
• 1.01.01, Assess and Understand Inputs
• Process Owners/Customers/Focals/Users • DCMA/SG
(Must have concurrence on file for all process changes. Use second page if necessary.)
John Smith
• 1.01.06, Flow Down Strategies and Deploy Plans • 1.02, Ensure Organizational Effectiveness • 1.04 Ensure Continuous Improvement • Process Owners/Customers/Focals/Users • DCMA/SG
• Executive Management/Program Management
10-12-2005
PROCESS DEFINITION
PROCESS DEFINITION
X31111 NEW (05 DEC 2005)Business:
Site:
Program(s):
Bus. Unit:
Business:
Site:
Program(s):
Bus. Unit:
IDS
PE&MS
Long Beach
GMS: C-17
Process Owners/Teams Define the Process
in a Flow Chart
Process Owners/Teams Define the Process
in a Flow Chart
Who
Responsible Organizations, Individuals or ProcessesInput
Output
Process Title:
Process Owner:
Process Number:
Creation Date:
Revision Date:
1.07.02
10-12-2005
1-24-2006
Lead PBM Deployment
John Smith
PROCESS FLOWCHART
PROCESS FLOWCHART
Business:
Bus. Unit
:
Site:
Program(s):
IDS
PE&MS
Long Beach
GMS: C-17
1.01.06, Flow Down Strategies and Deploy Plans SG/DCMA All Users Process Management Integration (PMI) 1.01.01 Assess and Understand Inputs Executive/ Program Management Strategies/Flowed Down Goals/Strategic Plans Requests Requests/ PBM Products and Data/ Gap Analyses Training Surveys/ Improvement Suggestions Internal/External Assessment Results Re ce iv e I nput s f rom S u p p li er s Define PBM Methodology and Command Media Plan PBM Approach Implement PBM Deployment Analyze PBM Deployment and Performance Results Capture Lessons Learned and Improve PBM D el iv er O u tput s t o C u st om er s PBM Deploy-ment Plan/ IMP/IMS/ PBM Method-ology/Command Media/Training Materials/ Systems to Manage PBM/ Health & Deployment Reports/ PBM Expertise/ PO Consulting & Coaching/ Process Team Facilitation/ Effective Resolution of Process-Related Conflicts/ Training PBM Deployment Plan/ IMP/IMSHealth & Deployment Reports Q1 Q2 T1 T2 T3 1.07.02.05 Capture Lessons Learned and Improve PBM Documented Lessons Learned/Improvement Suggestions/Reports Go to 1.03.07 Manage Corrective/ Preventive Actions All Level 3 Processes Under 1.07.02 Improve’t Projects/ Corrective/Preventive Actions/Requests
21
Copyright © 2006 Boeing. All rights reserved.
Process
Performance
Meet or Exceed
Customer
Expectations
Attain
Superior
Business
Results
Quality
Quality
Efficiency
Efficiency
Timeliness
Timeliness
Cycle
Cycle
-
-
Time
Time
Measure of conformance or
non-conformance (defects)
to requirements or expected
performance
Measure of success in
meeting a customer
commitment
Measure of output that a
process produces in relation
to costs
Measure of time between a
customer request and
delivery of the product or
service to the customer
Requirements
Requirements
Key Performance Categories
Key Performance Categories
Process Owners/Teams Use Metric Categories
to Establish Measures
Process Owners/Teams Define their Metrics
in a Process Performance Agreement
Process Owners/Teams Define their Metrics
in a Process Performance Agreement
(e.g., % Rework & Repair Hours/Total Hours)
(e.g., % On-Time to Manufacturing Schedule)
(e.g., Avg. Hours per Engineering Drawing)
(e.g., Total Days from Input to Delivery)
For Training Purposes Only
Process Title:
Process No.:
Creation Date:
Revision Date:
Next-Higher-Level Process:
PROCESS PERFORMANCE AGREEMENT
PROCESS PERFORMANCE AGREEMENT
Business:
Bus. Unit
:
Site:
Program(s):
Quality
Timeliness
Efficiency
Cycle Time
John Smith
James Jones
Glen Green
Minimum Acceptable Level (MAL) Annual / Multi-Year Goals Benchmark/ Comparative Data Weighting Factor (Must Have At Least One “1”)
Metric Definition
Metric Category
Process Measurement
Process Title (Verb + Noun)
0.00.00
MM/DD/YY
MM/DD/YY
Next-higher level process
Quality Metric Definition (list company/
organization/source benchmarked [if applicable])
Timeliness Metric Definition (list company/
organization/source benchmarked [if applicable])
Efficiency Metric Definition (list company/
organization/source benchmarked [if applicable])
Cycle Time Metric Definition (list company/
organization/source benchmarked [if applicable])
MAL
MAL
MAL
MAL
Annual Goals
(Multi-Year)
Benchmark/
Comparative
Data
Weight
Weight
Weight
Weight
Benchmark/
Comparative
Data
Benchmark/
Comparative
Data
Benchmark/
Comparative
Data
IDS
PE&MS
Long Beach
GMS: C-17
Annual Goals
(Multi-Year)
Annual Goals
(Multi-Year)
Annual Goals
(Multi-Year)
23
Copyright © 2006 Boeing. All rights reserved.
Process Owners/Teams Use Metrics to Measure
a Process
Process Owners/Teams Use Metrics to Measure
a Process
Good Good 100 90 80 70 60 50 40 30 20 10 0Quality (3X)
Efficiency (1X)
Process Performance Assessment
Assessment Assessment
Per
c
ent C
o
m
p
liant Or
d
e
rs
C
o
mp
le
te
d
Ite
ms per
M
an-h
our
03 04
J
F
M
A
M
J
J
A
S
O
N
D
2.2 1.8 1
2
1
2
2
2
04
J
F
M
A
M
J
J
A
S
O
N
D
03
2.5 2.9 2
2
2
1
1
1
1.3 2.0 1.3 1.8 1.8 1.8
03 04
J
F
M
A
M
J
J
A
S
O
N
D
2.4 2.5
1
2
2
2
3
4
2.3 2.8
1.3
10 9 8 7 6 5 4 3 2 1 0Legend:
Mo. Actuals
3-Period Avg
Min. Acceptable Level
Annual Goal
Benchmark
Weighting
Process Owners/Teams Use Tools to Analyze
Process Performance
Process Owners/Teams Use Tools to Analyze
Process Performance
!
FMEA
!
Check Lists
!
Graphs
!
Bar charts
!
5-Why Analysis
!
Cause-and-Effect (Fishbone)
Process TitleProcess Owner Revision Date Mirror Process
Task from Process Definition
Failure Effect 1 Cause 1 Detection 2 Actions Creation Date Process No. 11 2 Process No.: Creation Date: Revision Date: Process Title: Process Task Process Owner: Potential Failure Mode(s) Potential Effect(s) of Failure Potential Cause(s) of Failure Current Detection/ Verification Controls Recommended Actions S E V O C C D E T R P N 1-10 1-10 MD-1830-01 (04 Jun 2002) REVISED 1-10 1-10 2-20 Process Title
Process Owner Revision Date Mirror Process
Task from Process Definition
Failure Effect 1 Cause 1 Detection 2 Actions Creation Date Process No. 11 2 Process No.: Creation Date: Revision Date: Process Title: Process Task Process Owner: Potential Failure Mode(s) Potential Effect(s) of Failure Potential Cause(s) of Failure Current Detection/ Verification Controls Recommended Actions S E V O C C D E T R P N 1-10 1-10 MD-1830-01 (04 Jun 2002) REVISED 1-10 1-10 2-20
25
Copyright © 2006 Boeing. All rights reserved.
Process Owners/Teams Use Plans to Improve a
Process
Process Owners/Teams Use Plans to Improve a
Process
ACTIONS
TASKS
ACTION #1234 INITIATED: 01-May-05
INITIATOR: Adams, Art
ASSIGNEE: Adams, Art
PROCESS OWNER: Baker, Bill
PBM No: 5.02
Issue Orders
C/PA SOURCE: PBM Annual Process Improvement
STATUS: Open DATE: 07-Oct-05
SUBJECT:
Improve percentage of compliant documentation
PROBLEM STATEMENT:
Percentage of compliant procurement files is not acceptable.
VERIFICATION/ACCEPTANCE CRITERIA:
Percentage of compliant files improved by 20%
ROOT CAUSE ANALYSIS TOOLS USED:
FMEA, 5-Why
ROOT CAUSE STATEMENT:
Buyers are not trained to review files for compliance prior to sending to Procurement Analysis
VERIFICATION STATEMENT:
Task
1
2
3
4
5
6
7
Assignee
A. Adams
B. Baker
B. Baker
T. Trainer
T. Trainer
A. Adams
B. Baker
Subject
Develop file compliance checklist
Develop file compliance audit process
Revise file compliance procedure
Develop training course
Provide file compliance training
Implement compliance checklist
Conduct monthly compliance audits
Status
CLOSED
CLOSED
OPEN
OPEN
OPEN
OPEN
OPEN
Date
15-May-05
15-Jun-05
Systems House Process Data: PBMS and SSPI
Systems House Process Data: PBMS and SSPI
27
Copyright © 2006 Boeing. All rights reserved.
Strategy
Task
2005
Type
Metric
Description
Target
Jan
Feb
Mar
Apr
May
Jun
Jul
Aug
Sep
Oct
Nov
Dec
E-01 Execute on programs [IDS, AFS] G G G
E-01-A A&T Operating Earnings To Plan B B B
E-01-B A&T Cash Flow To Plan R B B
E-01-C On-time delivery - A&T Aircraft & Modifications 100% G G G
E-01-DA Mission Success: Non-Space Per Plan G G G
E-01-E RONA (Return on net assets) To Plan R R G
E-01-F CPARs or equivalent >/= 2.8 (Green) G G G E-01-G Award Fee Percent 80% - 89.9% of contracts
score >90% G P
E-01.11 Deploy and integrate effective Supplier Quality
process across IDS 84% G G G
E-02 Improve quality and cost G G Y
E-02-20AManage to Long Beach overhead composite
rate To plan Y G Y
E-02-B Productivity improvement [IDS, AFS] 5% G G G E-02-E**ACHIEVE/MAINTAIN A&T CMMI LEVEL 5
CERTIFICATION Per Plan G G G
E-02.01
Improve Quality (Key Quality metrics from the C-17, 767 Tanker, and DAP Programs along with A&T Common Quality Initiatives).
Roll-Up >/= Green Rating G G G
E-02.02 Improve cost Per Plan Y
E-03
Deploy use of the Baldrige framework (including the tools and initiatives that support the framework) across A&T to improve our business
To Plan G G G
E-03-20AStrengthen the process-based culture within
programs and across A&T Per plan G G G
E-03-20B[A&T] Become recognized as best-in-industry in
lean enterprise (including lean manufacturing) Green Rating (Roll Up) G G G
Execut
e F
lawlessl
y
Process Owner Discipline:
Process Owner Discipline:
Measured by Vision Support Plan (VSP)
Measured by Vision Support Plan (VSP)
Executive Process Owners:
•
Provide recognition to 1% of your Process
Owners (POs) per month for PBM efforts
•
Attend 75% of monthly PBM review meetings with
your Process Owners
Variability Reduction
for a micro-process
Six Sigma
for a macro-process
Variability Reduction
if more data analysis
is needed
Lean
if no more data analysis is needed
Lean
Quality
metric
Efficiency
metric
Timeliness/
Cycle Time
metric
If a process needs more
improvement
than PBM tools provide:
PBM is the framework for continuous process improvement
Micro-process
Macro-process
Variability Reduction
Six Sigma
If a process needs more
stability
than PBM tools provide:
Process Owners/Teams Use Improvement
Tools with PBM
29
Copyright © 2006 Boeing. All rights reserved.
Baldrige Categories
ISO Principles
Leadership
Strategic Planning
Customer and Market Focus
Information and Analysis
Human Resource Focus
Process Management
Business Results
Customer Focus
Leadership
Involvement of People
Process Approach
System Approach to
Management
Continual Improvement
Factual Approach to
Decision Making
Mutually Beneficial
Supplier Relationships
Process Management Leads to ISO Success
31
Copyright © 2006 Boeing. All rights reserved.
Process Management Leads to CMMI Success
•
The quality of a software product is governed by the
quality of the processes used to develop and maintain it.
•
To improve quality of the product, one must improve
the quality of the processes that create the product.
•
CMMI enables organizations that want to pursue
process improvement in multiple functional areas
(Software, Systems, Acquisition, Security etc. ) to do
so with less additional investment for each function.
•
CMMI supports process integration and product
improvement
•
CMMI integrates multiple disciplines into one
process-improvement framework
33
Copyright © 2006 Boeing. All rights reserved.