____________________________
Corresponding author: prof dr Jan Bocanski, Faculty of agriculture, Novi Sad, Serbia, email: bocanski@polj.ns.ac.rs
UDC 575:633:15 DOI:10.2298/GENSR0902145B Original scientific paper
GENETIC AND PHENOTYPIC RELATIONSHIP BETWEEN GRAIN YIELD AND COMPONENTS OF GRAIN YIELD OF MAIZE (Zea mays L.)
Jan BOĆANSKI1, Zorana SREĆKOV1, and Aleksandra NASTASIĆ2 1 Faculty of Agriculture, University of Novi Sad, Serbia 2 Institute of Field and vegetable Crops, Novi Sad, Serbia
Bočanski J., Z. Srečkov, and A. Nastić (2009): Genetic and phenotypic relationship between grain yield and components of grain yield of maize (Zea mays L.). - Genetika, Vol. 41, No. 2, 145 -154.
For efficient selection of grain yield, like the most importance economic trait, in regard to its on the great influence the environmental factors, has complex mode of inheritance and low heritability, is necessary to know genotypic and phenotypic coefficient of correlations between grain yield and morphological traits of the plant and ear which are influencing on the grain yield. The objective of this paper was to determine relationship between grain yield and morphological traits, in 8 inbred lines and their hybrids. Strong genetic and phenotypic correlations were found between grain yield and other studied traits, except between grain yield, on one side, and kernel row number where we found medium correlations. Between
other studied traits, the highest values of genotypic and phenotypic coefficient of correlations were found between ear length and cob weight.
Key words:correlations, grain yield, maize, morphological traits .
INTRODUCTION
The main goal of any maize breeding program is to obtain new hybrids that will outperform the existing hybrids with respect to a number of traits. Grain yield is a complex quantitative trait that depends on a number of factors. It’s within great influence of environmental conditions, has complex mode of inheritance and low heritability. Because of that during selection of grain yield, in order to select the best selection method, we need to determine mean values, components of variance and heritability of studied traits. Besides that, also is very important to confirm relationship between studied traits (DUDLEY and MOLL, 1969; HALLAUER and MIRANDA, 1988; MALVAR et al., 1996). For studying relationships between traits correlation analysis is used. Coefficient of correlations are the measure of level of the relationship two or more traits or the level where these traits are mutually different.
Causes of correlation can be of genetic nature (pleiotropic effects, linked genes) and can be affected by environmental factors. Phenotypic correlations are caused by both types of factors (genetic and environmental) and they can be seen on by measuring the phenotype. Genetic correlations are caused only with genetic factors. They are very important in plant breeding, especially additive genetic correlations, because they give us information about level of relationship between two traits which is caused by additive, i.e. breeding value of individual, which can be changed during selection (HALLAUER and MIRANDA, 1988). Difference between genetic and phenotypic correlations indicate on modification in level of relationship two traits under the environmental factors (BEKAVAC, 1996).
The objective of this paper was to submit correlative relationship between grain yield and morphological traits of plant and ear, in 15 hybrids and their parental inbred lines.
MATERIALS AND METHODS
For studying correlations between grain yield and morphological traits of plant and ear, 5 inbred lines, NSL 4026, NSL 4099, NSL 4065, B 73 Ht, A 632 Ht, were evaluated. They crossed with three testers (NSL 115-2, NSL 130-5 and NSL 221/I). During 2007, the parental lines and their hybrids were evaluated in field experiment in a single location (Rimski Sancevi) using a complete block design with three replication. Each plot consisted of one 5 m long row. The spacing was 0.70 m between the plots and 0.25 m between the plants. The standard growing technique was used and harvesting was done by hand. The data for plant (PH) and ear height (EH), ear length (EL), kernel row number (KRN), kernel number per row (KNR),
100-kernel weight (KW), cob weight (CW) and grain yield per plant (GY) were recorded on 10 randomly taken competitive plants and ears per replication.
Analysis of variance and covariance were done for completely block design (HADŽIVUKOVIĆ, 1991). In order to obtain relationship between studied traits we
calculated genetic and phenotypic correlation coefficient. Calculated were based on ratio of joint variation and summary of individual variation two traits (HALLAUER and MIRANDA, 1988). For testing significance of correlation coefficients we applicated t test.
RESULTS AND DISCUSSION
Picking suited genetic material is very important for success of plant breeding. Valuation of genetic potential of population can be done by determining genetic parameters of population, and one of the genetic parameter is mean value of the studied trait (HALLAUER and MIRANDA, 1988).
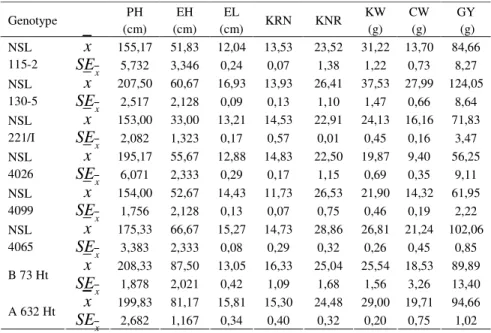
The mean values of the studied traits are shown in Table 1. Inbred line NSL 130-5 had the highest mean value for ear length, 100-kernel weight, cob weight and grain yield per plant.
Table 1. Mean values and standard errors of mean values for studied traits, for inbred lines
Genotype PH (cm) EH (cm) EL (cm) KRN KNR KW (g) CW (g) GY (g)
x
155,17 51,83 12,04 13,53 23,52 31,22 13,70 84,66 NSL 115-2 xSE
5,732 3,346 0,24 0,07 1,38 1,22 0,73 8,27x
207,50 60,67 16,93 13,93 26,41 37,53 27,99 124,05 NSL 130-5 xSE
2,517 2,128 0,09 0,13 1,10 1,47 0,66 8,64x
153,00 33,00 13,21 14,53 22,91 24,13 16,16 71,83 NSL 221/I xSE
2,082 1,323 0,17 0,57 0,01 0,45 0,16 3,47x
195,17 55,67 12,88 14,83 22,50 19,87 9,40 56,25 NSL 4026 xSE
6,071 2,333 0,29 0,17 1,15 0,69 0,35 9,11x
154,00 52,67 14,43 11,73 26,53 21,90 14,32 61,95 NSL 4099 xSE
1,756 2,128 0,13 0,07 0,75 0,46 0,19 2,22x
175,33 66,67 15,27 14,73 28,86 26,81 21,24 102,06 NSL 4065 xSE
3,383 2,333 0,08 0,29 0,32 0,26 0,45 0,85x
208,33 87,50 13,05 16,33 25,04 25,54 18,53 89,89 B 73 Ht xSE
1,878 2,021 0,42 1,09 1,68 1,56 3,26 13,40x
199,83 81,17 15,81 15,30 24,48 29,00 19,71 94,66 A 632 Ht xSE
2,682 1,167 0,34 0,40 0,32 0,20 0,75 1,02The highest mean value for plant and ear height, and kernel row number, were recorded in B 73 Ht line, while inbred line NSL 4065 had the highest mean value for kernel number per row. The lowest value of plant and ear height had inbred line NSL 221/I, and for ear length inbred line NSL 115-2. Inbred line NSL 4026 had the lowest mean values, for other studied traits.
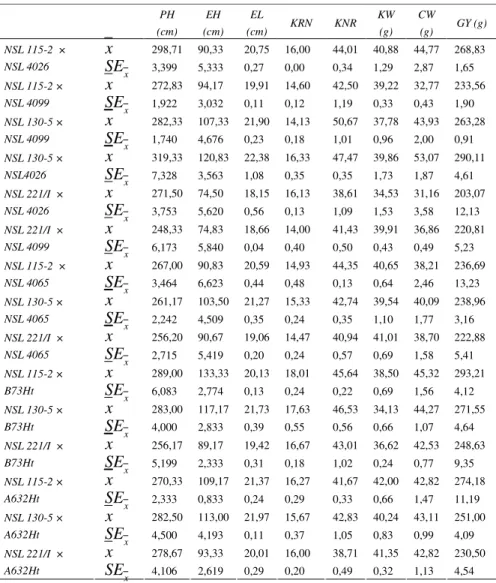
In hybrid combinations, the maximal mean value for plant height, ear length and cob weight, were recorded in hybrid NSL 130-5×NSL 4026 (Tab. 2), and for kernel number per row in hybrid combination NSL 130-5×NSL 4099. Other studied traits (ear height, kernel row number, 100-kernel weight and grain yield) had the highest mean values in hybrid combination NSL 115-2×B73Ht. Hybrid NSL 221/I×NSL 4026 had the lowest mean values for almost all studied traits, except for plant height, kernel row number and kernel weight. Minimal value for 100-kernel weight was recorded in combination NSL 130-5×B73Ht, and for plant height and kernel row numbers in hybrid combination NSL 221/I×NSL 4099.
In order to obtain the level of relationship between studied traits, we calculated genetic and phenotypic coefficient of correlation.
Grain yield had the strongest genetic correlation with cob weight (rg =
0.979**, Tab. 3). This correlation was high significant. High significant, strong relationship, also was found between grain yield, on one side, and plant height (rg =
0.953**), ear height (rg = 0.867**), ear length (rg = 0.959**), kernel number per row
(rg = 0.974**) and 100-kernel weight (rg = 0.881**), on the other side. Medium,
positive correlations were found between, grain yield and kernel row number (rg =
0.594). Medium and strong correlation between grain yield and morphological traits of plant and ear, were found by many authors. Our results are partly agreed with results of AZIZ ET AL (1998). They found strong, positive correlations between grain yield and plant height, kernel number per row and 100-kernel weight, but between grain yield, on one side, and ear length and kernel row number, on the other side, they found week, negative relationship. Also, in its work, AHSAN (1999) obtained strong genetic correlations between grain yield and plant height. ALVI et al. (2003) studied hybrid and their parental lines. They found strong relationship between grain yield and plant height, kernel number per row and ear length. Contra to our study, they found medium correlations between grain yield and ear height, and strong correlations between grain yield and kernel row number. Our results are also partly agreed with results of SUMATHI et al. (2005). Studding genetic parameters of 47 genotypes, they found strong genetic correlations between grain yield, on one side, and ear height and kernel row number, on the other side, and medium strong correlations between grain yield and number of kernel per row. But, contra to our study, SUMATHI et al. (2005) found low correlations between grain yield and plant height, and negative, medium strong correlations between grain yield and 100-kernel weight.
Table 2. Mean values and standard errors of mean values for studied traits, for hybrid combinations PH (cm) EH (cm) EL (cm) KRN KNR KW (g) CW (g) GY (g)
x
298,71 90,33 20,75 16,00 44,01 40,88 44,77 268,83 NSL 115-2 × NSL 4026 xSE
3,399 5,333 0,27 0,00 0,34 1,29 2,87 1,65x
272,83 94,17 19,91 14,60 42,50 39,22 32,77 233,56 NSL 115-2 × NSL 4099 xSE
1,922 3,032 0,11 0,12 1,19 0,33 0,43 1,90x
282,33 107,33 21,90 14,13 50,67 37,78 43,93 263,28 NSL 130-5 × NSL 4099 xSE
1,740 4,676 0,23 0,18 1,01 0,96 2,00 0,91x
319,33 120,83 22,38 16,33 47,47 39,86 53,07 290,11 NSL 130-5 × NSL4026 xSE
7,328 3,563 1,08 0,35 0,35 1,73 1,87 4,61x
271,50 74,50 18,15 16,13 38,61 34,53 31,16 203,07 NSL 221/I × NSL 4026 xSE
3,753 5,620 0,56 0,13 1,09 1,53 3,58 12,13x
248,33 74,83 18,66 14,00 41,43 39,91 36,86 220,81 NSL 221/I × NSL 4099 xSE
6,173 5,840 0,04 0,40 0,50 0,43 0,49 5,23x
267,00 90,83 20,59 14,93 44,35 40,65 38,21 236,69 NSL 115-2 × NSL 4065 xSE
3,464 6,623 0,44 0,48 0,13 0,64 2,46 13,23x
261,17 103,50 21,27 15,33 42,74 39,54 40,09 238,96 NSL 130-5 × NSL 4065 xSE
2,242 4,509 0,35 0,24 0,35 1,10 1,77 3,16x
256,20 90,67 19,06 14,47 40,94 41,01 38,70 222,88 NSL 221/I × NSL 4065 xSE
2,715 5,419 0,20 0,24 0,57 0,69 1,58 5,41x
289,00 133,33 20,13 18,01 45,64 38,50 45,32 293,21 NSL 115-2 × B73Ht xSE
6,083 2,774 0,13 0,24 0,22 0,69 1,56 4,12x
283,00 117,17 21,73 17,63 46,53 34,13 44,27 271,55 NSL 130-5 × B73Ht xSE
4,000 2,833 0,39 0,55 0,56 0,66 1,07 4,64x
256,17 89,17 19,42 16,67 43,01 36,62 42,53 248,63 NSL 221/I × B73Ht xSE
5,199 2,333 0,31 0,18 1,02 0,24 0,77 9,35x
270,33 109,17 21,37 16,27 41,67 42,00 42,82 274,18 NSL 115-2 × A632Ht xSE
2,333 0,833 0,24 0,29 0,33 0,66 1,47 11,19x
282,50 113,00 21,97 15,67 42,83 40,24 43,11 251,00 NSL 130-5 × A632Ht xSE
4,500 4,193 0,11 0,37 1,05 0,83 0,99 4,09x
278,67 93,33 20,01 16,00 38,71 41,35 42,82 230,50 NSL 221/I × A632Ht xSE
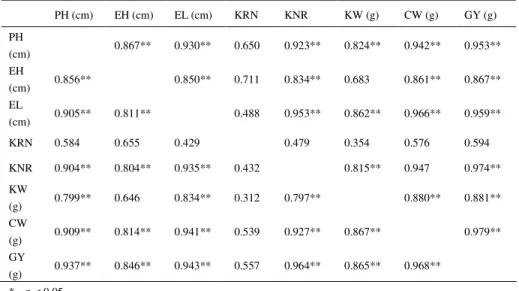
4,106 2,619 0,29 0,20 0,49 0,32 1,13 4,54Table 3. Genetic (above diagonal) and phenotypic (below diagonal) correlation coefficient between morphological traits of plant and ear
PH (cm) EH (cm) EL (cm) KRN KNR KW (g) CW (g) GY (g) PH (cm) 0.867** 0.930** 0.650 0.923** 0.824** 0.942** 0.953** EH (cm) 0.856** 0.850** 0.711 0.834** 0.683 0.861** 0.867** EL (cm) 0.905** 0.811** 0.488 0.953** 0.862** 0.966** 0.959** KRN 0.584 0.655 0.429 0.479 0.354 0.576 0.594 KNR 0.904** 0.804** 0.935** 0.432 0.815** 0.947 0.974** KW (g) 0.799** 0.646 0.834** 0.312 0.797** 0.880** 0.881** CW (g) 0.909** 0.814** 0.941** 0.539 0.927** 0.867** 0.979** GY (g) 0.937** 0.846** 0.943** 0.557 0.964** 0.865** 0.968** * p < 0.05 ** p < 0.01
Between other studied traits, the strongest correlations, which showed high significant, was found between ear length and cob weight (rg = 0.966**, Tab. 3).
High significant, strong relationship also was found between ear length, on one side, and plant height (rg = 0.930**), ear height (rg = 0.850**), kernel number per row (rg
= 0.953**) and 100-kernel weight (rg = 0.862**), on the other side. Ear length was in
medium correlation with kernel row number (rg = 0.488). Our results are partly
agreed with the results which were obtained by ALVI et al. (2003). In their research medium correlation between ear length and kernel row number, and strong correlations between ear length, on one side, and plant height and kernel number per row, on the other side, were also found. However, between ear length and ear height and 100-kernel weight, they found strong correlations, and our results are contra to that. Also, our results are contra to the results of AZIZ et al. (1998), which are determined medium correlation between ear length, and kernel row number, and weak genetic correlation between ear length, on one side, and kernel number per row and 100-kernel weight, on the other side. Our results are also different from the results of SOFI (2007) and SOFI and RATHER (2007) who found weak correlation between ear length and height.
The greatest value of phenotypic coefficient of correlation was obtained between grain yield and cob weight (rp = 0.968**, Tab. 3). Highly significance,
positive values of phenotypic coefficient also were determined between grain yield, on the one side, and plant (rp = 0.937**) and ear height (rp = 0.846**), ear length (rp
= 0.943**), kernel number per row (rp = 0.964**) and 100-kernel weight (rp =
0.865**), on the other side. With kernel row number, grain yield was in medium relationship (rp = 0.557). Results which we obtained in our research are in agreement
with the results of BOCANSKI et al. (2004, 2005). Doing the genetic analysis of hybrid and their parental lines, they found strong relationship between grain yield, on one side, and plant and ear height, cob weight and 100-kernel weight, on the other side. Also, our results are similar to the results of ALVI et al. (2003). In their study they found strong phenotypic correlation between grain yield and plant and ear height, ear length, kernel row number and kernel number per row. AZIZ et al (1998) determined strong phenotypic correlation between grain yield, on one side, and plant height, kernel number per row and 100-kernel weight, on the other side. Results which we obtained in this paper are partly in agreement with results of previous authors, because they found negative correlation between grain yield and ear length and kernel row number. Our results were contra to the results which were found by SRECKOV et al (2007). In their research low correlation between grain yield, on the one side, and plant and ear height, and kernel row number, on the other side, and medium correlation between grain yield and ear length and 100-kernel weight, were found.
Between other studied traits, the highest value of phenotypic coefficient of correlation, was determined between ear length and cob weight (rp = 0.941**, Tab.
3). High significant, strong relationship was found between ear length and other studied traits, except kernel row number, where we obtained medium correlation (rp
= 0.429).Kernel row number also was in medium correlation with plant height (rp =
0.584), kernel number per row (rp = 0.432) and 100-kernel weight (rp = 0.312), while
between other studied traits strong relationship was found. Strong relationship between cob weight and 100-kernel weight also was found by BOCANSKI et al. (2004, 2005). Our results are partly in agreement with results of ALI et al. (2003). They found medium relationship between kernel row number and plant and ear height. However, results which we found in this paper for relationship between ear length, kernel row number, kernel number per row and 100-kernel weight are contra to their results, because they fount low value of correlation coefficient between kernel row number and 100-kernel weight, and strong correlation between kernel row number, on one side, and kernel number per row and ear length, on the other side.
CONCLUSION
Based on the results which we get in this research conclusions are: The highest mean value for plant and ear height, and kernel row number were determined in B73Ht, and for kernel number per row in NSL 4065. For other studied traits, maximum values were measured in line NSL 130-5. Inbred line NS 4026 had the greatest number of minimum mean values (kernel row number, kernel number per row, 100-kernel weight, cob weight and grain yield).
Maximum value for plant height, ear length and cob weight were measured in hybrid NSL 130-5×NSL 4026, and for kernel number per row in NSL 130-5×NSL 4099. For other studied traits, the highest mean values were found in hybrid combination NSL 115-2×B73Ht. Hybrid NSL 221/I×NSL 4026 had the lowest values almost for all traits, except for plant height, kernel row number and 100-kernel weight.
Grain yield had strong, genetic and phenotypic correlations, with all traits, except with kernel row number. The highest correlation was calculated between grain yield and cob weight. Between other studied traits, the highest value of correlation coefficient was found between ear length and cob weight.
Received April 15th, 2009
Accepted June 18th, 2009
REFERENCES
AHSAN, M. (1999): Performance of six maize (Zea mays L.) inbred lines and their all possible and well as reciprocal cross combinations. Pakistan Journal of Biological Science, 2:222-224.
ALVI, M. B., M. RAFIQUE, M. S. TARIQ, A. HUSSAIN, T. MAHMOOD,and M. SARWAR (2003): Character association and path coefficients analysis of grain yield and yield components maize (Zea mays L.). Pakistan Journal of Biological Science, 6:136-138.
AZIZ, K., A. REHMAN,and A. RAUF (1998): Heritability and interrelationships for some plant traits in maize single crosses. Pakistan Journal of Biological Science, 1:313-314.
BEKAVAC, G. (1996): Genetičke korelacije za prinos zrna i dužinu trajanja lisne površine sintetičkih
populacija kukuruza (Zea mays L.). Doktorska disertacija, Poljoprivredni fakultet, Novi Sad.
BOĆANSKI, J., Z. SREĆKOV,and A. NASTASIĆ (2005): Genetička analiza mase oklaska i prinosa zrna
kukuruza (Zea mays L.). Letopis naučnih radova, 29 (1):113-121.
BOĆANSKI, J., Z. SREĆKOV,and N. VASIĆ (2004): Nasleđivanje mase 100 zrna i prinosa zrna kukuruza.
Selekcija i Semenarstvo, X (1-4):75-82.
BROCCOLI, A. M.,and R. BURAK (2000): Association between yield components, grain morphological traits and volume expansion in popcorn hybrids cultivated in Argentina. MNL, 74:43-44.
DUDLEY, J. W.,and R. H. MOLL (1969): Interpretation and use of estimates of heritability and genetic variances in plant breeding. Crop Sci., 9:257-262.
HADŽIVUKOVIĆ, S. (1991): Statistički metodi, drugo prošireno izdanje. Poljoprivredni fakultet, Institut za
ekonomiku poljoprivrede i sociologiju sela, Novi Sad.
HALLAUER, A. R.,and J. B. MIRANDA (1988): Quantitative genetics in maize breeding. Iowa State Univ. Press. Ames, IA, pp. 468.
MALVAR, R. A., A. ORDÁS, P. REVILLA,and M. E. CARTEA (1996): Estimates of genetic variances in two Spanish population of maize. Crop Sci., 36:291-295.
SOFI, P. A. (2007): Genetic analysis of tassel and ear characters in maize (Zea mays L) using triple test cross. Asian Journal of Plant Science, 6 (5):881-883.
SOFI, P.,and A. G. RATHER (2007): Studies on genetic variability, correlation and path analysis. (accessed on www.agron.missouri.edu/mnl/81/04sofi.htm)
SREĆKOV, Z., J. BOĆANSKI,and M. IVANOVIĆ (2007): Genetic and phenotypic correlations between oil
content and morphological traits in high oil maize population NSU1. Genetika, 39:103-112.
SUMATHI, P., A. NIRMALAKUMARI, and K. MOHANRAJ (2005): Genetic variability and traits interrelationship studies in industrially utiliyed oil rich CYMMIT lines of maiye (Yea mays L.). Madras Agric. J., 92)10-12:612-617.
GENETIČKA I FENOTIPSKA MEĐUZAVISNOST PRINOSA ZRNA I KOMPONENTI PRINOSA ZRNA KUKURUZA (Zea mays L.)
Jan BOĆANSKI1, Zorana SREĆKOV1 i Aleksandra NASTASIĆ2
1 Poljoprivredni fakultet, Univerzitet Novi Sad, Srbija 2Institut za ratarstvo i povrtarstvo, Novi Sad, Srbija
I z v o d
Za efikasnu selekciju prinosa zrna, kao najvažnije ekonomske osobine, s obzirom na to da je pod jakim uticajem faktora spoljašnje sredine, ima veoma kompleksno nasleđivanje i uglavnom nisku heritabilnost, neophodno je poznavati
genotipske i fenotipske korelacije prinosa i ostalih osobina biljke koje utiču na
formiranje prinosa. Cilj ovog istraživanja je bio da se utvrde korelativni odnosi koji vladaju između prinosa zrna i morfoloških osobina biljke i klipa, kod 8 inbred linija i
15 hibrida, dobijenih njihovim međusobnim ukrštanjem. Jaki genetički i fenotipski
korelacioni koeficijenti ustanovljeni su između prinosa zrna i svih ostalih
proučavanih osobina, izuzev između prinosa i broja redova zrna na klipu, gde je
ustanovljena srednje jaka korelacija. Između ostalih proučavanih osobina, najveća
vrednost, i genotipskog, i fenotiopskog korelacionog koeficijenta, ustanovljena je između dužine klipa i mase oklaska.
Primljeno 15. IV. 2009. Odobreno 18. VI. 2009.