By FRANCIS A. LONGSTAFF, JUN PAN, LASSE H. PEDERSEN, AND KENNETH J. SINGLETON∗
We study the nature of sovereign credit risk using an extensive set of sovereign CDS data. We find that the majority of sovereign credit risk can be linked to global factors. A single principal component accounts for 64 percent of the variation in sovereign credit spreads. Furthermore, sovereign credit spreads are more related to the U.S. stock and high-yield markets than they are to local economic measures. We decompose credit spreads into their risk-premium and default-risk components. On average, the risk premium represents about a third of the credit spread. (JEL F34, G12, G15)
Is sovereign credit risk primarily a country-specific type of risk? Or is sovereign credit driven primarily by global macroeconomic forces external to the country? Understanding the nature of sovereign credit risk is of key importance given the large and rapidly-increasing size of the sovereign debt markets. Furthermore, the nature of sovereign credit risk directly affects the ability of financial market participants to diversify the risk of global debt portfolios and may play a central role in determining both the cost and flow of capital across countries.
We study sovereign credit risk from a novel perspective by using an extensive new data set of sovereign credit default swap (CDS) contracts on the external debt of 26 developed and less-developed countries. Sovereign CDS contracts function as insurance contracts that allow investors to buy protection against the event that a sovereign defaults on or restructures its debt.1 An important advantage of using sovereign CDS data (rather than sovereign bond data) is that the sovereign CDS market is typically more liquid than the corresponding sovereign bond market, resulting in more accurate estimates of credit spreads and returns.2
∗ Longstaff: UCLA Anderson School, 110 Westwood Plaza, Los Angeles, CA 90095 and National Bu-reau of Economic Research (email: francis.longstaff@anderson.ucla.edu); Pan: MIT Sloan School of Man-agement, 50 Memorial Drive, E52-435, Cambridge, MA 02142 and National Bureau of Economic Research (email: junpan@mit.edu); Pedersen: New York Univerity Stern School of Business, 44 West 4th Street, Suite 9-190, New York, NY 10012-1126, Centre for Economic Policy Research, and National Bureau of Economic Research (email: lpederse@stern.nyu.edu); Singleton: Stanford Graduate School of Business, Stanford, CA 94305 and National Bureau of Economic Research (email: kenneths@stanford.edu). We are grateful for valuable comments and suggestions received from Andrew Atkeson, Paulo Cacella, Engelbert Dockner, Sebastian Edwards, Robert Engle, Campbell Harvey, Don Morrison, Alex Reyfman, Stephen Schaefer, Marcelo Takami, Walter Torous, and seminar participants at Barclays Global Investors, Im-perial College, the International Monetary Fund, the Moody’s and Copenhagen Business School Credit Conference, New York University, UCLA, and the University of Vienna. We thank Xiaolong Cheng, Priyank Gandhi, Brent Longstaff, and Scott Longstaff for capable research assistance. All errors are our responsibility.
1Typically, sovereign financial distress results in a restructuring or rescheduling of debt. For
conve-nience, we refer to this process simply as sovereign default throughout the paper.
2Although CDS spreads generally approximate the spreads of the underlying 1
Four important results emerge from the analysis. First, we find that there is a sur-prisingly high level of commonality in sovereign credit spreads. In particular, the first principal component explains 64 percent of the variation in sovereign credit spreads dur-ing the 2000–2010 sample period. Furthermore, this value increases to 75 percent durdur-ing the 2007–2010 crisis period in the global financial markets. This first principal compo-nent has a correlation of−74 percent with U.S. stock market returns, and a correlation of 61 percent with changes in the VIX index.3 In contrast, the first principal component of stock index returns for these same countries explains only about 46 percent of the variation in stock returns during the entire sample period, and 62 percent during the 2007–2010 period. Thus, sovereign credit risk appears to be much more linked to global factors than are equity returns.
Second, we find that sovereign credit risk is driven more by global market factors, risk premiums, and investment flows than by country-specific fundamentals. Specifically, we regress changes in CDS spreads on four categories of explanatory variables: local eco-nomic variables, global financial market variables, global risk premium measures, and global market liquidity variables. In general, all four categories have significant explana-tory power for CDS spread changes. However, the most significant variables for CDS credit spreads are the U.S. stock and high-yield markets, and the volatility risk premium embedded in the VIX index.
Third, we apply the affine sovereign credit model of Pan and Singleton (2008) to the term structure of sovereign CDS spreads. This approach allows us to decompose the CDS spreads for each country into risk-premium and default-risk components. We find that there is a significant risk premium embedded in sovereign credit spreads. On average, this risk premium represents about one-third of the total credit spread.
Fourth, we investigate whether the strong relation between sovereign CDS spreads and global macroeconomic factors is attributable more to the default-risk component or to the risk-premium component of spreads. Although both components are related to the global factors, we find that the link between the global factors and the default-risk component is significantly stronger than is the case for the risk-premium component.
In summary, the relation between sovereign credit spreads and global risk premiums and investment flows supports a view of the market in which global investors play a predominant role. In particular, the commonality in risk premiums across countries is consistent with risk pricing by a marginal investor with a global portfolio. Similarly, the impact of global liquidity on the market is consistent with models such as Markus Brunnermeier and Lasse H. Pedersen (2009) in which funding shocks experienced by institutional investors translate into shocks in the liquidity of financial assets. Thus, bonds, there are several reasons why the two need not be identical. For example, there are cash flow differences between bonds and CDS contracts that can induce differences in spreads (see Darrell Duffie and Jun Liu 2001, Duffie and Kenneth J. Singleton 2003, and Francis A. Longstaff, Sanjay Mithal, and Eric Neis 2005). Furthermore, there can be bond- or contract-specific liquidity effects that create time-varying differences or basis risk between CDS and sovereign bond spreads. Also, CDS spreads are often implicitly spreads on bonds that are less encumbered by covenants and guarantees.
3Jun Pan and Singleton (2008) document a similar strong relation between
an important source of commonality in sovereign credit spreads may be their sensitivity to the funding needs of major investors in the sovereign credit markets. Furthermore, the results also suggest that the very nature of sovereign default risk itself is heavily influenced by global macroeconomic factors.
Despite the importance of sovereign credit risk in the financial markets, relatively little research about the sources of commonality has appeared in the literature. Previous theoretical work focuses primarily on the incentives faced by sovereign debtors to repay their debt. Examples include Jonathan Eaton and Mark Gersovitz (1981), Hershel I. Grossman and John B. Van Huyck (1988), Jeremy Bulow and Kenneth Rogoff (1989a, b), Andrew Atkeson (1991), Michael P. Dooley and Lars E. O. Svenson (1994), Harold L. Cole and Timothy J. Kehoe (1996, 2000), Dooley (2000), and many others. A number of empirical studies focus on the factors that determine individual sovereign credit spreads. These include Sebastian Edwards (1984, 1986), Andrew Berg and Jeffrey Sachs (1988), Ekkehart Boehmer and William L. Megginson (1990), Duffie, Pedersen, and Singleton (2003), and Frank X. Zhang (2008). Other important empirical work focuses on the investment returns associated with Brady bonds and emerging market debt, such as Claude B. Erb, Campbell R. Harvey, and Tadas Viskanta (1996, 1999), and Sandeep Dahiya (1997). Some recent research provides evidence that sovereign credit spreads are related to common global factors.4 In particular, Pan and Singleton (2008) show that the credit spreads for Mexico, Turkey, and Korea share a strong common relation to U.S. stock market volatility as measured by the VIX index. This result is important since it demonstrates how common dependence of this type could induce significant correlations among sovereign credit spreads.
This paper is most closely related to Remolona, Scatigna, and Wu (2008) and Pan and Singleton (2008). Remolona, Scatigna, and Wu calibrate a model in which Standard and Poor’s and Moody’s ratings announcements for sovereigns are mapped into estimated default losses. This mapping is then used to provide a decomposition of sovereign credit spreads into default-risk and risk-premium components. Their approach is applied to the CDS spreads for 24 emerging market sovereigns for the 52-month period from February 2002 to May 2006. Our paper differs from theirs in several important respects. First, we study the 111-month period from October 2000 to January 2010. The advantage of using this longer sample period is that it covers the peaks and troughs of two major business cycles, rather than just the relatively uneventful mid-decade period. Second, our approach identifies the components of spreads directly from the market prices of the term structure of sovereign CDS contracts, rather than from ratings announcements. Many recent papers have raised questions about the quality of the ratings provided by the ratings agencies, particularly in light of their role during the current financial crisis. Third, our analysis is conducted at the level of individual sovereigns rather than at an aggregate level as in Remolona, Scatigna, and Wu. This allows us to identify
cross-4For example, see Steven Kamin and Karsten von Kleist (1999), Barry Eichengreen and Ashoka Mody
(2000), Paolo Mauro, Nathan Sussman, and Yishay Yafeh (2002), Alois Geyer, Stepha Kossmeier, and Stefan Pichler (2004), Martin Rozada and Eduardo Yeyati (2005), and Eli Remolona, Michela Scatigna, and Eliza Wu (2008).
sectional differences in how sovereign credit spreads respond to local and global factors. Our paper complements and extends Pan and Singleton by applying their framework to a much large sample of sovereigns. Furthermore, we explore the links between the risk premiums and a much broader set of both local and global macroeconomic variables than is included in Pan and Singleton.
The remainder of the paper is organized as follows. Section I describes the data. Section II describes the commonality in sovereign credit spreads. Section III studies the sources of commonality in sovereign credit. Section IV uses the Pan and Singleton (2008) model to identify the risk-premium and default-risk components of sovereign credit spreads and studies their relation to global macroeconomic factors. Section V summarizes the results and presents concluding remarks.
I. THE DATA
As discussed in Duffie (1999), Longstaff, Mithal, and Neis (2005), Pan and Singleton (2008), and others, a CDS contract functions as an insurance contract against the event that an entity such as a firm or a sovereign defaults on its debt. To illustrate how a CDS contract works, consider the case of the People’s Republic of China. On January 31, 2010, the market premium or spread for a five-year CDS contract on China was 83 basis points. This means that a buyer of credit protection would pay 83 basis points a year (paid semiannually on an actual/360 daycount basis). If there was no default, the buyer would pay this annuity for the full five-year horizon of the contract. If there was a default, however, the buyer of credit protection (after paying any accrued premium) could sell the defaulted debt to the protection seller at its par value of 100, after which the contract would terminate. In general, this default-linked cash flow is triggered by the default of a specific reference obligation of the underlying entity. Upon default, however, the protection buyer typically has the right to put to the protection seller any of a list of bonds or loans with equivalent seniority rights.5
The pricing data for five-year sovereign credit default swaps used in this study are obtained from the Bloomberg system which collects CDS market quotation data from industry sources. The sample covers the period from October 2000 to January 2010. Not every country is included in the sample for the full period, however, since new sovereign CDS contracts were routinely added to the Bloomberg system throughout this period. To be included in the sample, we require that sovereign CDS data be available in the Bloomberg system no later than August 2004. This criterion results in a total of 26 different countries in the sample. In each case, the reference obligation for the CDS contract is designated as senior external or international debt of the sovereign.6
5For a detailed discussion of the contractual provisions of sovereign CDS contracts (such as physical
delivery, standard specified currencies, credit events triggering payments, etc.), see Pan and Singleton (2008).
6Specifically, the reference obligation is a U.S. dollar-denominated issue for 23 of the sovereigns and
a Euro-denominated issue for two of the sovereigns. No information is available about the reference obli-gation for the CDS contract for China. The contract, however, explicitly references Chinese Government international debt, and the only current Chinese international bond issues for the five-year horizon are
Table 1 provides summary information for the sovereign CDS premiums. All premiums are denominated in basis points and are, therefore, free of units of account.7 The average values of the premiums range widely across countries. The lowest average is 17.73 basis points for Japan; the highest average is 737.79 basis points for Venezuela. Both the standard deviations and the minimum/maximum values indicate that there can also be significant time-series variation in the sovereign CDS premiums. For example, the cost of credit protection for Brazil ranges from 62.92 to 3,790.00 basis points during the sample period.
II. COMMONALITY IN SOVEREIGN CREDIT SPREADS
In this section, we study the commonality in sovereign credit spreads. In particular, we conduct a principal components (PC) analysis of the changes in sovereign CDS spreads and contrast the results with those for equity index returns for the same countries.
First, we compute the correlation matrix of monthly spread changes. Since the time series of observations for the sovereign CDS contracts are not always equal in length, the correlation between each pair of countries is based on the months for which the data overlap. Next, we use this correlation matrix in estimating the principal components (the correlation matrix is shown in the online appendix).
Many of the pairwise correlations of sovereign credit spreads are large. In fact, correla-tions in excess of 80 percent are frequent. For example, the correlation between Croatia and Romania is 91 percent, the correlation between Chile and Mexico is 87 percent, and the correlation between Korea and Malaysia is 82 percent. All of the pairwise correlations are positive. The average pairwise correlation taken over all countries is just under 62 percent.
As discussed by Andrew Ang and Geert Bekaert (2002) and others, there is a tendency for correlations in financial markets to increase during crisis periods. In light of this, we recompute the CDS spread change correlations for the 2000–2006 pre-crisis period as well as the 2007–2010 period encompassing the current financial crisis. There there is a large difference in the average correlations. The average correlation is about 39 percent for the 2000–2006 period, and 73 percent for the 2007–2010 period.
To provide additional perspective, we also compute the correlations between local cur-rency equity index returns for the same sovereigns. The correlations of equity index returns across countries tend to be significantly smaller than those for sovereign CDS spread changes. In particular, the average pairwise equity return correlation is only about 41 percent for the 2000–2010 sample period, 28 percent for the 2000–2006 pre-crisis period, and 56 percent for the 2007–2010 period. Thus, there are major differences in the correlation structure of sovereign credit spreads across countries relative to that for the equity returns of the same countries. These simple results suggest that sovereign U.S. dollar-denominated issues.
7The actual cash flows are paid in U.S. dollars based on U.S. dollar-denominated notional amounts
for the CDS swap contracts. The currency that cash flows are paid in, however, does not affect the pricing of the CDS contract.
credit spreads may be much more influenced by global macroeconomic factors than are equity returns.8
Turning now to the principal components analysis, Table 2 reports summary results for the 2000–2010 sample period as well as the 2000–2006 and 2007–2010 subperiods. The results show that there is strong commonality in the behavior of sovereign CDS spreads. In particular, the first PC explains 64 percent of the variation in sovereign CDS spreads during the entire sample period. In addition, the first three PCs explain nearly 80 percent of the variation over the entire sample period.
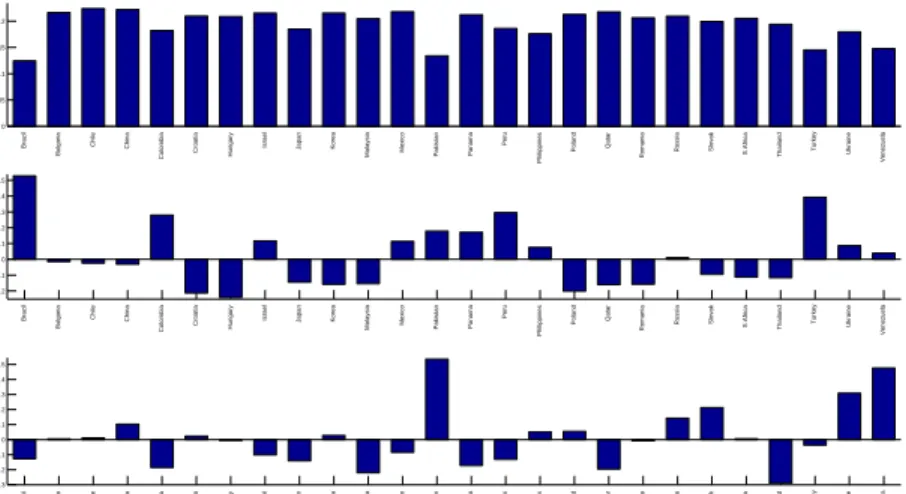
Figure 1 plots the loadings or weighting vectors for the first three PCs. As shown, the first PC consists of a roughly uniform weighting of the credit spreads for most of the sovereigns in the sample. In essence, the first PC resembles a “parallel shift” factor in the (standardized) spreads of sovereign CDS.
0 0.05 0.1 0.15 0.2 1st Component Brazil Bulgaria Chile China
Colombia Croatia Hungary
Israel Japan Korea
Malaysia Mexico Pakistan Panama
Peru
Philippines
Poland Qatar Romania Russia
Slovak S Africa Thailand Turkey Ukraine
Venezuela −0.2 −0.1 0 0.1 0.2 0.3 0.4 0.5 2nd Component Brazil Bulgaria Chile China Colombia Croatia Hungary
Israel Japan Korea
Malaysia Mexico Pakistan Panama
Peru
Philippines
Poland Qatar
Romania Russia Slovak S Africa Thailand Turkey Ukraine
Venezuela −0.3 −0.2 −0.1 0 0.1 0.2 0.3 0.4 0.5 3rd Component Brazil Bulgaria Chile China
Colombia Croatia Hungary
Israel Japan Korea
Malaysia Mexico Pakistan Panama
Peru
Philippines
Poland Qatar Romania Russia
Slovak S Africa Thailand Turkey Ukraine
Venezuela
Figure 1. Principal Components of Monthly Changes in CDS Spreads
To explore further the interpretation of the first PC, we compute a time series for the first PC. The correlation of this first PC index with U.S. stock market returns is −74 percent, and the correlation with changes in the VIX index is 61 percent. The correlation between stock market returns and changes in the VIX index is −75 percent. Thus, the principal source of variation across almost all sovereign credit spreads appears to be very highly correlated with the U.S. market as measured by U.S. stock market returns or by U.S. equity market volatility. These results are consistent with Pan and Singleton (2008) who likewise find a strong relation between sovereign credit spreads and the VIX index. The second PC places substantial positive weight on Brazil, Columbia, Peru, and Turkey, and significant negative weight on a number of European and Asian coun-tries. Thus, this PC could be viewed roughly as a spread between Latin-American and
8Equity index correlations are for the 25 countries for which equity index returns are available from
non-Latin-American countries. The third PC is heavily weighted toward Pakistan and Venezuela, which are both countries that have experienced significant recent political turmoil.
These high levels of commonality contrast with those given by a PC analysis of the equity index returns for the same countries. The lower part of Table 2 shows that the first PC for equity index returns explains a little more than 46 percent of the variation, while the first three PCs explain just under 58 percent. Thus, there is roughly a 20 to 25 percent difference between the amount of variation explained by the first several PCs for the two sets of variables.
The differences in the properties of the sovereign CDS spreads and equity index returns are also seen in the subperiods. For example, the first PC for the sovereign CDS spread changes explains about 75 percent for 2007–2010 period, but only about 62 percent for the equity index returns. Similar differences are seen for the 2000–2006 period as well.
III. WHAT ARE THE SOURCES OF COMMONALITY?
Given the evidence of strong patterns of commonality in sovereign credit spreads, a logical next step is to explore the reasons for this commonality. In this section, we study the extent to which sovereign credit spreads can be explained by local factors as well as a common set of global macroeconomic variables.
A. The Variables
In this analysis, however, it is important to be somewhat selective in the variables considered. This is simply because there is virtually an unlimited number of variables that could be related to sovereign credit risk. Accordingly, we will adopt the more parsimonious approach of focusing primarily on market-determined variables since, in theory, they should aggregate much of the economic information relevant to investors in the sovereign credit markets.
Local Variables. — There are a number of possible economic forces that might
determine the credit spread of a sovereign nation. Foremost among these is the state of the local economy. This theme appears throughout the literature in papers such as Grossman and Van Huyck (1988) which seek to explain why defaults are associated with bad states of the economy, and why defaults are often partial rather than complete.
To capture information about the state of the local economy, we include the local stock market return (denominated in units of the local currency), percentage changes in the exchange rate of the local currency against the dollar, and percentage changes in the dollar value of the sovereign’s holdings of foreign reserves. Details about the definitions, timing, and source of the data for these variables are provided in the Appendix (and similarly for all of the other explanatory variables described in the paper).
Global Financial Market Variables. — Far from being autarkies, the sovereigns
included in the study typically have extensive economic relationships with other countries. Thus, the ability of one of these sovereigns to repay its debt may depend not only on local variables, but also on the state of the global economy. Furthermore, this dependence could become increasingly more important as the trend towards globalization continues. In addition, shifts in the relative liquidity of markets over time as shocks induce investors to reallocate capital across different asset classes (for example, from stock to bonds, from investment grade to high yield, from developed to emerging markets, etc.) could create correlations between asset class prices even in the absence of correlated fundamentals.
To capture broad changes in the state of the global economy and/or shifts in the relative performance of different asset classes, we include a number of measures from the U.S. equity and fixed income markets.9 There are several reasons for this approach. First, the U.S. is not one of the sovereigns included in our sample. Second, there is extensive evidence that shocks to the U.S. financial markets are transmitted globally. For example, Richard Roll (1988) shows that of 23 stock markets around the world, 19 declined by more than 20 percent during the October 1987 U.S. stock market crash. This is also consistent with the evidence in William Goetzmann, Lingfeng Li, and Geert Rouwenhorst (2005) and others. Thus, the prices of securities in U.S. financial markets presumably incorporate information about economic fundamentals or market liquidity that is relevant to a broad cross-section of countries. Finally, as the largest economy in the world, the U.S. has direct effects on the economies and financial markets of many other sovereigns.
As the equity market variable, we include the excess return on the CRSP value-weighted portfolio. To reflect variation in the U.S. fixed income markets, we include the change in the five-year constant maturity Treasury (CMT) yield reported by the Federal Reserve. Including this variable in the study is important since changes in the CMT yield can signal changes in U.S. economic growth, and in turn, the global business cycle. Furthermore, these changes may also incorporate a flight-to-liquidity element due to the variation in the perceived safety of U.S. Treasury bonds as a “reserve” asset in international financial crises. Thus, this variable might also reflect variation in a liquidity component if it were incorporated into sovereign credit spreads.
We also include changes in the spreads of U.S. investment-grade and high-yield corpo-rate bonds as additional financial market variables. Specifically, we include the change in the spreads between five-year B and AAA-rated bonds and between five-year BB-and BBB-rated bonds. The former captures the range of variation in investment-grade bond yields, while the latter reflects the variation in the spreads of high-yield bonds.10
9In addition to these measures, we also explored whether global oil or commodity prices have
ex-planatory power. In particular, we included percentage changes in oil prices and the Standard and Poors Goldman Sach Commodity Index (as reported by the Bloomberg system). With the exception of several Latin American countries such as Venezuela, these measures had little explanatory power for sovereign credit spread changes during our sample period after conditioning on the other explanatory variables.
10An alternative to using these corporate yield spreads might be to use the well-known CDX index of
Global Risk Premiums. — Recent research on corporate credit spreads suggests
that these spreads may include premiums for bearing risks such as jump-to-default risk, recovery risk, the risk of variation in spreads or distress risk, liquidity risk, etc. Although sovereign credit risk differs in many respects from corporate credit risk, sovereign spreads could include similar components.
Based on this, we adopt the approach of using risk premium estimates from other global markets as explanatory variables. Intuitively, one might expect that there would be some commonality in the properties of risk premiums across markets. This is because, in principle, risk premiums arise from investor’s attitudes towards bearing risk and the covariance of those risks with their consumption streams. Thus, assets with similar covariance properties might well have correlated risk premiums.
As a proxy for the variation in the equity risk premium, we use monthly changes in the earnings-price ratio for the S&P 100 index. Although admittedly simplistic, this proxy does have the important advantage of providing a model-free measure and is often used in asset-pricing contexts.
As another risk premium proxy, we use monthly changes in the spreads between implied and realized volatility for index options. As discussed by Mark Britten-Jones and Anthony Neuberger (2000), Pan (2002), and many others, the difference between implied and realized volatility may represent a premium for bearing the volatility risk of an option position. Specifically, we compute a rolling 20-day estimator of the realized return on the S&P 100 index using the Mark Garman and Michael J. Klass (1980) open-high-low-close estimator applied to daily index data. We subtract the month-end value of this estimator from the month-end VIX index value. Differencing the two series gives the monthly change in the volatility risk premium proxy.11 Finally, we use monthly changes in the expected excess returns of five-year Treasury bonds as a proxy for changes in the term premium. These expected excess returns are based on the model estimates presented in John H. Cochrane and Monika Piazzesi (2005), but updated through the end of our sample period using Fama-Bliss and Bloomberg discount-bond term structure data.
Global Investment-Flow Variables. — Another potential influence on the credit
spreads of sovereign debtors is the flow of investment capital around the world. To illustrate this, suppose that investors choose to increase their diversification by holding more foreign equity and debt securities in their portfolios. The resulting investment flows could be associated with significant valuation effects for international assets such as sovereign debt because of enhanced risk sharing, the local economic benefits of improved access to global sources of capital, or simply the improvement in the liquidity of these securities.
There is an extensive literature discussing the potential effects of investment flows on se-curity values. In a sovereign debt context, Yulia Sinyagina-Woodruff (2003) considers the
11As a robustness check, we also perform the analysis using the volatility risk premium estimator
of Tim Bollerslev, George Tauchen, and Hao Zhou (2009) and Bollerslev, Michael Gibson, and Zhou (Forthcoming). The results from this estimation are very similar to those we report. We are grateful to Hao Zhou for providing the volatility risk premium data to us.
effects of shifts in investor confidence and their willingness to supply capital (herding be-havior). Others such as Maurice Obstfield (1986), Sachs, Aaron Tornell, Andres Velasco, Francesco Giavazzi, and Istvan Szekela (1996), and Craig Burnside, Martin Eichenbaum, and Sergio Rebelo (2000) describe the role that speculative attacks by strategic investors may play in currency crises (such as the 1997 Asian crisis).
As measures of the flow of investment capital to foreign markets, we use the net new flows (inflow minus outflow) into mutual funds investing primarily in bonds and equity, respectively. This data is obtained from the Investment Company Institute and described in the Appendix.
Spreads of Other Sovereigns. —As proxies for any other external economic factors
that might influence the credit spread for a particular sovereign, we also include in the regression two measures of the changes in the CDS spreads of the other sovereigns in the sample. Specifically, we divide the countries in the sample into four categories based on their geographical location: Latin America, Asia, Europe, and the Middle East/Other (details provided in the Appendix). For each of the sovereigns in the sample, we compute the average CDS spread for the other countries in the same region (the regional spread), and the average CDS spread for the countries in the other three regions (the global spread, but excluding the specific region). We regress the changes in these spreads on the other explanatory variables and use the orthogonalized residuals from these regressions as additional explanatory variables in the analysis.
B. Regression Analysis
For each of the 26 sovereigns in the sample, we regress the monthly changes in the CDS spread on the explanatory variables described above. Table 3 reports thet-statistics (based on the Halbert White (1980) heteroskedasticity-consistent estimate of the covari-ance matrix) and adjustedR2 for each of the regressions.
Focusing first on the local variables, Table 3 shows that the state of the local economy definitely affects the sovereign’s credit risk. For example, the local stock market returns is significant (at the five-percent level) for 11 of the sovereigns in the sample. The sign of the local stock return coefficient is almost uniformly negative across countries, indicating that good news for the local stock market is also good news for sovereign credit spreads. The exchange rate is likewise important in explaining variation in sovereign credit risk. In particular, seven of the coefficients are significant. Of these, six of the coefficients are positive in sign, indicating that the sovereign’s credit spread increases as the sovereign’s currency depreciates relative to the U.S. dollar. The coefficient for the change in for-eign currency reserves is only significant for five of the countries, and these significant coefficients are typically negative in sign.
The results for the global financial market variables are striking. Table 3 shows that the most significant financial market variables in the regressions are the U.S. stock market return and the U.S. high-yield spread. The U.S. stock market return is significant for 17 of the sovereigns, while the high-yield spread is significant for 14 countries. Thus, the
U.S. stock market return is more often significant in explaining variation in sovereign credit spreads than is the local stock market return. Interestingly, the high-yield variable is not just significant for the sovereigns with high CDS spreads (which are generally rated below investment grade), but is significant for a number of investment-grade sovereigns with relatively small CDS spreads. The sign of the U.S stock market coefficients are uniformly negative, while the signs for the high-yield variable are almost all positive.12 The other two global financial market variables appear to have only modest explanatory power for sovereign CDS spreads.
The regression results also indicate that there is a very strong relation between the sovereign CDS spreads and the global risk premiums included as explanatory variables. In particular, the volatility risk premium is significant for 18 of the sovereigns, making it the most significant of all of the variables in the regression. The significant coefficients are all negative in sign. The equity premium proxy is significant for eight of the sovereigns. These results are consistent with the view that common time-varying risk premiums represent an important component of sovereign credit spreads, and thus, may contribute towards their correlation structure.
Turning next to the global investment-flow variables, Table 3 shows that the global equity-flow variable is significant for two of the countries, while the global bond-flow variable is significant for four of the countries. The significant coefficients are all negative in sign, suggesting that an increase in the amount of global capital allocated to these financial investments translates into a decline in sovereign credit spreads.
These investment-flow results have many interesting implications. In a recent paper, Brunnermeier and Pedersen (2009) present a model in which leveraged investors may experience funding shocks. In turn, these funding shocks translate into declines in the market liquidity of securities. From an empirical perspective, these types of funding-induced liquidity shocks could represent a common factor driving the values of affected securities. Specifically, if the marginal investor holding sovereign debt were subject to these funding shocks, then sovereign credit spreads might display a common liquidity-related pattern. The results in Table 3 are consistent with this scenario.
As evidence that sovereign credit may be subject to these types of funding-related liquidity shocks, we note that the Russian default of 1998 was accompanied by shocks to the credit spreads of many other sovereigns even though these sovereigns were not directly linked to Russia (see Duffie, Pedersen, and Singleton (2003)). In particular, the sovereign credit returns (implied by five-year CDS contracts) for the month of August 1998 for Brazil, Bulgaria, Mexico, Peru, Panama, and Poland were −39,−32, −18,−12,−9, and
−6.5 percent, respectively. Although only anecdotal evidence, these large negative returns are at least consistent with the hypothesis that the Russian Default/LTCM crisis resulted in a major funding event in the hedge-fund industry that then translated into common liquidity-related contagion in sovereign credit spreads.
12We are grateful to a referee who points out that the relation between sovereign spreads and high
yield corporate spreads may have evolved over time. In particular, the correlation of log changes in U.S. high-yield spreads and the JP Morgan EM spread was 0.11 during the 1990s, and 0.68 during the 2000s. Thus, one should be careful about extrapolating our results beyond the sample period and data set that we study in this paper.
Finally, Table 3 shows that there are strong interrelationships between sovereign credit spreads even after including the local economic, and global financial market, risk pre-mium, and investment-flow variables in the regression. The coefficient for the regional credit spread is significant for 16 of the countries. Of these significant coefficients, 14 are positive in sign. Similarly, the coefficient for the global credit spread is significant for 18 of the countries, and 15 of these significant coefficients are positive in sign. These results are consistent with the presence of regional or global factors that affect all sovereign credit spreads, but are not captured by the other explanatory variables. As one possibility, the regional and global spreads could reflect the variation in a liquidity component present in the CDS spreads for all sovereigns.13
The adjusted R2s for the regressions are also intriguing. In general, these R2s are fairly high, indicating that the explanatory variables capture much of the variation in sovereign credit spreads. The mean and median values of the adjusted R2s are 68.7 and 68.6 percent, respectively. The adjustedR2s range from 46 to 89 percent.
Finally, the last column of Table 3 reports a measure of what fraction of the total variation explained by the regression is due solely to the local variables. To calculate this ratio, we first regress the changes in spreads on just the local variables, and then divide the R2 from this regression by the R2 from the full regression. Since the local variables are not orthogonal to the remaining variables, this ratio likely overstates the proportion of the total variation due solely to the local variables. Thus, this local ratio should be viewed more as an upper bound. As shown, the fraction of the total explanatory power of the regression due solely to the local variables varies significantly across sovereigns. Of the 26 local ratios, 16 (or nearly two-thirds) are less than 50 percent.14 On average, the local ratio is only about 0.43. Similarly, the median value of the ratio is 0.42. Thus, at most, the local variables provide only a little more than 40 percent of the total explanatory power of the regression.15
IV. THE COMPONENTS OF SOVEREIGN CREDIT SPREADS
The results in the previous section indicate that global factors play a predominant role in driving sovereign credit spreads. Credit spreads, however, can be expressed as the sum of a default-related component and an associated risk premium. In this section, we use the Pan and Singleton (2008) framework to decompose sovereign CDS credit spreads into these components. We then examine whether the relation between sovereign credit
13One referee raised the intriguing question of whether counterparty credit risk in the CDS market
might account for some of the commonality in sovereign CDS spreads. We note that recent research by Navneet Arora, Priyank Gandhi, and Longstaff (2010) shows that the effects of counterparty credit risk on corporate CDS spreads are very small, largely because of the standard industry practice of requiring full collateralization. Thus, the effect of counterparty credit risk on our results is likely to be negligible.
14Many of the countries with local ratios in excess of 50 percent have experienced significant
idiosyn-cratic economic or political shocks. The countries with local ratios in excess of 50 percent are Brazil, Hungary, Japan, Korea, Mexico, Peru, the Philippines, Russia, South Africa, and Turkey.
15These results are consistent with the evidence that closed-end country fund premiums are closely
tied to movements in the U.S. equity markets. For example, see James N. Bodurtha, Dong-Soon Kim, and Charles M. C. Lee (1995) and Eduardo Levy-Yeyati and Angel Ubide (2000).
spreads and global macroeconomic factors is attributable more to the default-related component or to the risk-premium component.
A. The Model
In this section, we review briefly the Pan and Singleton (2008) model of sovereign CDS spreads. In doing so, we follow closely the discussion in their paper. In this model, the spread CDSt(M) for aM-year sovereign CDS contract is given by the expression,
(1) CDSt(M) = 2(1−RQ)t+M t E Q t λue− u t (rs+λs)dsdu 2M j=1EtQ e−tt+j/2(rs+λs)ds ,
whereRQdenotes the constant risk-neutral fractional recovery of face value on the under-lying cheapest to deliver bond if there is a relevant credit event,rtis the riskless rate, and
λt denotes the risk-neutral intensity or arrival rate of a credit event. The numerator of
(1) is the present value of the contingent payment by the protection seller upon a credit event. The denominator is the present value of a M-year semiannual annuity, where payments are made contingent upon a credit event not having occurred. Discounting by
rt+λtcaptures the survival-dependent nature of the payments.
To fix notation, we use the superscript P to denote the parameters of the intensity processλunder the data-generating process, what we will refer to as the objective process. As part of the process of estimating risk premiums, we will need to take expectations with respect to the probability distribution implied by the objective process. For pricing, we will also need to take expectations with respect to the distribution of λassociated with a hypothetical investor who is neutral towards the risk associated with unpredictable variation in this intensity. This risk-neutral distribution will be implied from what is designed the risk-neutral process forλ, and which may differ from the objective process in its parameters. We will use the superscript Q to denote the parameters of the risk-neutral process forλ. Under the objective processP,λis assumed to follow a lognormal process,
(2) dlnλt=κP(θP −lnλt)dt+σλdBPt . Similarly, under the risk-neutral process Qwe assume that
(3) dlnλt=κQ(θQ−lnλt)dt+σλdBtQ, These two processes are connnected by the “market price of risk”
(4) ηt=δ0+δ1lnλt,
as the change of probability distribution fromP toQimplies that the parameters satisfy
κQ =κP +δ
1σλ andκQθQ =κPθP −δ0σλ. Thus, the market price of risk specification
defines how the parameters of the risk-neutral process differ from those of the objective process, and, therefore, how the probability distributions implied by the risk-neutral and objective processes differ. Note that, when δ0 = 0 and δ1 = 0, the market price of “distress” riskηtassociated with unpredictable variation inλtis zero and theQ proba-bility distribution associated with a risk-neutral investor coincides with theP probability distribution implied by the objective or data-generating process.
As in Pan and Singleton, we assume that rt and λt are independent. Then, in the absence of arbitrage opportunities, the market CDS spread can be represented in terms of the expectations of a risk-neutral investor as
(5) CDSt(M) = 2(1−RQ)t+M t D(t, u)E Q t λue− u t λsds du 2M j=1D(t, t+j/2)E Q t e−tt+j/2λsds ,
whereEQt denotes expectations based onλtfollowing the risk-neutral process in Equation (3) and D(t, u) is the price of a default-free zero-coupon bond (issued at date t and maturing at date u). The expectations in the above expressions cannot be expressed in closed form. Thus, these expectations are computed numerically using an implicit finite-difference method to solve the associated Feynman-Kac partial differential equation.
B. Risk Premiums in Sovereign CDS Markets
There are two distinct risk premiums that are of interest to investors in sovereign bonds: the “distress” risk premium associated with unpredictable variation in the arrival rate
λ of a credit event, and the “jump-at-event” risk premium associated with the surprise jump (usually down) in price at the moment of a credit event that triggers the CDS insurance contract. We follow Pan and Singleton (2008) and focus on the distress risk premium. After introducing our measure of risk premiums in the sovereign CDS market, we briefly compare our approach to other measures of risk premiums in the literature.
ThoughλandRQ enter the expression (1) for the CDS spread in a seemingly complex
way, it turns out that (at least for newly written, at-market insurance contracts)CDSt(M) is approximately equal to λt(1−RQ). Thus, unpredictable variation in market spreads
is approximately proportional to the unpredictable variation inλ. Investors will demand compensation for bearing this risk in the form of a risk premium. Since this risk is effectively that future arrival rates of credit events will differ from consensus expectations in the CDS market, we view this risk premium as compensation for unforecastable distress risk, an unexpected increase in the probability that a sovereign issuer will experience a
credit event (e.g., a restructuring of its debt or a missed interest payment).
To quantify the magnitude of this risk premium, we compute the value of the CDS spread using the probability distribution implied by the risk-neutral process (which in-cludes a market price of risk) and then using the probability distribution implied by the objective process (which is equivalent to setting the market priceηtof lnλtrisk to zero). The size of the risk premium can be inferred by then simply taking the difference be-tween the CDS spreads computed in this way. The CDS spreadCDSt(M) implied by the risk-neutral process is given taking expectations in Equation (5) using the risk-neutral probability distributionQimplied by Equation (3). The CDS spreadCDSP
t (M) implied
by the objective process (which can be termed the pseudo spread) is given by taking expectations in Equation (5) but using the probability distribution P implied by the objective process in Equation (2),
(6) CDStP(M) = 2(1−RQ)t+M t D(t, u)EPt λue− u t λsds du 2M j=1D(t, t+j/2)EtP e−tt+j/2λsds .
If ηt = 0, then the objective and risk-neutral processes for λcoincide (since, from the above discussion, they would have the same parameters) CDSt(M) = CDStP(M), and distress premiums are zero. On the other hand, if ηt = 0, then the parameters of the objective and risk-neutral processes will differ, implying that expectations taken with respect to the P and Q distributions will differ, implying in turn that CDSt(M) and
CDSP
t (M) will differ. Accordingly, we measure the impact of the distress risk premium on
market prices asCDSt(M)−CDStP(M). The impact on a proportional basis is [CDSt(M)−
CDSP
t (M)]/ CDSt(M), the ratio of the effect on the level of spreads to the market CDS
spread.
The risk premium we are measuring is distinct from the “jump-at-default” premium that has received considerable attention in the literature on corporate bonds. This pre-mium, which is typically measured as the ratioλ/λP, where λP is the objective arrival rate of credit events (see Duffie and Singleton 1999, 2003, Antje Berndt, Rohan Douglas, Duffie, Mark Ferguson, and David Schranz 2008). The jump-at-default premium cannot be inferred from market prices of corporate or sovereign bonds alone, because we can only extract information on the risk-neutral intensity λfrom bond yield spreads.16 The literature on corporate bonds has used information on company-specific equity prices and balance sheets to estimate, issuer by issuer, the probabilities of a credit event based on historical experience.
In a complementary study to ours, Remolona, Scatigna, and Wu (2008) provide es-timates of the jump-at-event premiums for sovereign issuers using the approximation
CDSt(M)≈λt(1−RQ) to extractλ, and using information about ratings to extractλP.
However, as they emphasize, ratings are often stale measures of credit risk for sovereign issuers, and predicting the timing of a credit event for a country is a very different exercise
than predicting the default of a corporation.17
We have chosen to avoid these challenging measurement problems altogether by focus-ing on distress risk (as defined above), a risk that is at least as pertinent to investors since it is directly linked to the mark-to-market risk they face on their sovereign bond positions. Extracting a measure of the distress risk premium for sovereign issuers re-quires a formal pricing model, and this is a distinctive feature of our analysis. Remolona, Scatigna, and Wu (2008), for example, base all their analysis on spreads alone—they do not have a dynamic pricing model—and, as such, their analysis is silent about the nature and quantitative importance of distress risk premiums implicit in sovereign CDS markets.
C. Maximum Likelihood Estimation
Following Pan and Singleton (2008), we apply the model to sovereign CDS prices and estimate the model via maximum likelihood. To be able to identifyλand the parameters of the model, however, it is necessary to have a term structure of CDS prices for each country. To this end, we collected CDS spread from Bloomberg for one-year and three-year contracts on a subset of 15 of the countries in the sample. Thus, for these 15 countries, we have a term structure of one-year, three-year, and five-year CDS contracts from which to estimate the model.18
We focus on this subset of 15 countries since there was not enough CDS term structure data available for the other countries in the sample.
The parameters of the model are estimated via maximum likelihood using the condi-tional distribution of the observed spreads implied by the lognormal distribution of λ. Similar to Pan and Singleton (2008), we assume that the three-year CDS contract is priced perfectly, so that the pricing function can be inverted for λ. The one-year and five-year contracts are assumed to be priced with normally distributed errors with mean zero and standard deviationsσ(1) andσ(5), respectively. The values of the zero-coupon bondsD(t, u) that appear in the valuation formula are bootstrapped from the Treasury constant maturity curve published by the Federal Reserve Board using a standard cubic spline interpolation algorithm.19 As in Pan and Singleton, we assume that the recovery rateRQ is 0.25.
17Since state-dependent measures ofλ
P are not available, Remolona, Scatigna, and Wu (2008) make the strong assumption that the dynamic properties of λP are determined by the dynamic properties of CDS spreads. Implicitly, this approach amounts to imposing strong restrictions on the properties of jump-at-event premiums in sovereign markets.
18One referee raised the issue of whether the liquidity of sovereign CDS contracts is the same across the
maturity spectrum. We spoke with several sovereign CDS traders to investigate this issue. These traders indicated that the liquidity and bid-ask spreads of the one-year, three-year, and five-year contracts are all reasonably similar, although the five-year contract typically has higher trading volume. In light of this, we do not believe that our results are likely to be affected by differential liquidity across the sovereign CDS curve.
19An alternative approach would be to extract zero-coupon bond prices from Libor rates and the swap
curve. The results, however, are not sensitive to the choice of the discounting curve. Intuitively, this is because the discounting curve is applied symmetrically to the cash flows from both legs of the CDS contract. Thus, changing from the Treasury curve to the swap curve for discounting has little effect on the CDS spread.
Table 4 reports the results from the maximum likelihood estimation. Focusing first on the pricing errors, we see that the model fits most of the term structures quite closely. The median values of σ(1) and σ(5) are 12 and 10 basis points, respectively. Recall from Table 1 that many of these sovereigns have CDS spreads measured in hundreds and even thousands of basis points. Thus, these pricing errors are relatively small from a percentage perspective.
As in Pan and Singleton, almost all of the sovereign term structures imply that the credit environment is worse under the Qdistribution than under the P distribution. In particular, θQκQ > θP
κP, so even at low arrival rates of credit events, λ will tend to
be larger under Qthan under P. In addition, there is generally much more persistence under Qthan underP as measured by the mean reversion parameters κQ andκP.
D. How Large is the Risk Premium?
The differences in the parameters governingλunder the risk-neutral and actual pro-cesses indicates that there is a systematic distress-risk premium in sovereign CDS spreads. To quantify this risk premium, we calculate the difference between the CDS spread and the pseudo-spread defined in (6) as discussed above.
To provide some perspective on the size of the risk premium, Table 5 reports summary statistics for the time series of estimated risk premiums for each country. The table reports summary statistics both for the risk premium itself measured in basis points as well as the percentage risk premium which is defined by the ratio of the risk premium to the total CDS spread.
As shown, the average risk premiums are all positive. The means range from a low of 2.55 basis points for Bulgaria to a high of 233.02 basis points for Brazil. The overall average of the individual averages is 69.01 basis points.
The percentage risk premiums are particularly interesting. The average values of the percentage risk premiums range for less than zero to about 65 percent. The overall mean of these averages is 34.45 percent, implying that the average risk premium represents about one-third of the total value of sovereign CDS spreads.
E. The Relation to Global Macroeconomic Factors
These results now allow us to partition sovereign CDS spreads into both a risk-premium component and a residual distress component (given simply as the CDS spread less the risk-premium component). For purposes of discussion, however, we will simply designate these components the risk-premium and default-risk components.20 This then allows us to explore the question of whether the strong common relation between sovereign CDS spreads and the global macroeconomic factors is due to sovereign default or distress risk itself, or to the risk premiums embedded in CDS spreads.
20This is consistent with an expected return interpretation of the risk premium. For example, see the
In doing this, we will adopt the straightforward approach of simply regressing the monthly changes in the two components of the CDS spread on the key global macroe-conomic variables used in the previous section. The results from these regressions are reported in Table 6. Panel A presents the results for the risk-premium component; Panel B presents the results for the default-risk component.
The issue of which component is more related to the global macroeconomic factors can be resolved by comparing the adjusted R2s from the regressions. As shown, theR2s for both components are generally very large in magnitude. In particular, 9 of the 15R2s for the risk-premium components are in excess of 50 percent. Similarly, 11 of the 15R2s for the default-risk component are in excess of 50 percent. Thus, the global macroeconomic factors generally explain the majority of the variation in the sovereign CDS components. These results are consistent with the previous results shown in Table 3 indicating that global factors are the primary drivers of sovereign CDS spreads.
A direct comparison of the R2s, however, indicates that the macroeconomic factors explain a significantly larger proportion of the variation in the default-risk component. Specifically, the adjusted R2 for the default-risk component is larger than that for the risk-premium component for 12 of the 15 countries. This proportion is significantly higher than 50 percent based on a standard binomial test. The average adjusted R2 for the default-risk component is 58.4 percent, while the average adjusted R2 for the risk-premium component is 45.4 percent.21
What economic forces might explain the strength of the relation between the default-risk component and the global macroeconomic factors? There are many possible answers to this question. It is tempting to attribute much of this to increasing economic inte-gration across countries and the emergence of the global economy. While this may be an important aspect, however, we cannot rule out other possibilities such as a common increasing dependence on global capital markets, thereby making sovereigns more sus-ceptible to systematic financial shocks. The strong relation between the risk-premium component and the macroeconomic factors is consistent with a view of the market in which global investors play a major role. In particular, the shared relation of risk pre-miums to global factors across countries is consistent with risk pricing by a marginal investor with a global portfolio.
It is also interesting to compare the relation between the components of the CDS spread and the individual factors. The most significant factor affecting both the risk-premium and default-risk components is the U.S. stock market. Of the 15 countries, 12 have significant coefficients for the U.S. stock market return in both the risk-premium and default-risk regressions. The significant coefficients are uniformly negative in sign.
Where the risk-premium and default-risk component differ the most is in their relation to global risk premiums. Curiously, the default-risk component appears to be more related to the global risk premiums than the risk-premium component of the individual sovereign CDS spreads. Specifically, the equity risk premium is significant at the
five-21We also repeated this analysis but with some of the local factors included in the regression. The
results were similar in that the adjustedR2for the default-risk component was larger than that for the risk-premium component for 12 of the 15 countries.
percent level for five of the risk-premium regressions and for seven of the default-risk regressions. Similarly, the volatility risk premium is significant at the five-percent level for six of the risk-premium regressions and for nine of the default-risk regressions.
The relation between investment-grade and high-yield corporate credit spreads is also stronger for the default-risk component than for the risk-premium component. In particu-lar, the investment-grade spread is not significant for any of the risk-premium regressions, but is significant for three of the default-risk regressions. The high-yield spread is signif-icant for three of the risk-premium regressions and for five of the default-risk regressions.
V. CONCLUSION
We study the nature of sovereign credit risk using credit default swap data for an exten-sive cross-section of developed and emerging-market countries. We show that sovereign credit risk tends to be much more correlated across countries than are equity index returns for the same countries. Our results suggest that the source of these higher correlations is the dependence of sovereign credit spreads on a common set of global market factors, risk premiums, and liquidity patterns. Specifically, we find that the sovereign spreads are driven primarily by U.S. equity and high-yield factors. Also, sovereign spreads are significantly related to the volatility risk premium embedded in the VIX index.
Following Pan and Singleton, we use an affine sovereign credit valuation model to decompose sovereign CDS spreads into their risk-premium and default-risk components. We find that on average, about one-third of the CDS spread is due to the risk premium associated with the default intensity process. We find that both the risk-premium and default-risk components of CDS spreads are strongly related to global macroeconomic factors. The link between these factors and the default-risk component, however, is significantly stronger than is the case for the risk-premium component of the spread.
Our results, however, apply to a sample period during which there was considerable global liquidity and reaching for yield, suggesting that comovements were induced partly by changes in risk premiums, perhaps arising through funding liquidity issues similar to those discussed earlier. In different periods, it could well be the case that such liquid-ity factors might be much less important. During those periods, country-specific factors might be relatively more important and correlations lower. Thus, it is important to pro-vide the caveat that our results are for a period characterized by excess global liquidity, prevalence of carry trades, and reaching for yield in the sovereign and high yield mar-kets. In particular, the 2000s may have been a fairly unique period in financial markets (and especially the year 2008) and, therefore, not necessarily reflective of longer term experience in sovereign credit markets.
REFERENCES
Ang, Andrew, and Geert Bekaert. 2002. “International Asset Allocation with Regime Shifts.” Review of Financial Studies, 15(4): 1137-1187.
Arora, Navneet, Priyank Gandhi, and Francis A. Longstaff. 2010. “Coun-terparty Credit Risk and the Credit Default Swap Market.” http://www.anderson.
ucla.edu/documents/areas/fac/finance/longstaff corporate3.10.pdf.
Atkeson, Andrew. 1991. “International Lending with Moral Hazard and Risk of Repudiation.” Econometrica, 59(4): 1069-1089.
Berg, Andrew, and Jeffrey Sachs. 1988. “The Debt Crisis: Structural Explana-tions of Country Performance.” Journal of Development Economics, 29(3): 271-306.
Berndt, Antje, Rohan Douglas, Darrell Duffie, Mark Ferguson, and David Schranz. 2008. “Measuring Default Risk Premia from Default Swap Rates and EDFs.” http://www.andrew.cmu.edu/user/aberndt/Beetal08.pdf.
Bodurtha, James N., Dong-Soon Kim, and Charles M. C. Lee. 1995. “Closed-End Country Funds and U.S. Market Sentiment.” Review of Financial Studies, 8(3): 879-918.
Boehmer, Ekkehart, and William L. Megginson. 1990. “Determinants of Sec-ondary Market Prices for Developing Country Syndicated Loans.” Journal of Finance, 45(5): 1517-1540.
Bollerslev, Tim, Michael Gibson, and Hao Zhou. Forthcoming. “Dynamic Estimation of Volatility Risk Premia and Investor Risk Aversion for Option-Implied and Realized Volatilities.” Journal of Econometrics.
Bollerslev, Tim, George Tauchen, and Hao Zhou. 2009. “Expected Stock Returns and Variance Risk Premia.” Review of Financial Studies, 22(11): 4463-4492.
Britten-Jones, Mark, and Anthony Neuberger. 2000. “Option Prices, Implied Price Processes and Stochastic Volatility.” Journal of Finance, 55(2): 839-866.
Brunnermeier, Markus, and Lasse H. Pedersen. 2009. “Market Liquidity and Funding Liquidity.” Review of Financial Studies, 22(6): 2201-2238.
Bulow, Jeremy, and Kenneth Rogoff. 1989a. “A Constant Recontracting Model of Sovereign Debt.” Journal of Political Economy, 97(1): 155-178.
Bulow, Jeremy, and Kenneth Rogoff. 1989b. “Sovereign Debt: Is to Forgive to Forget?” American Economic Review, 79(1): 43-50.
Burnside, Craig, Martin Eichenbaum, and Sergio Rebelo. 2001. “Prospective Deficits and the Asian Currency Crises.” Journal of Political Economy, 109(6): 1155-1197.
Cochrane, John H., and Monika Piazzesi. 2005. “Bond Risk Premia.” American Economic Review, 95(1): 138-160.
Cole, Harold L., and Timothy J. Kehoe. 1996. “A Self-Fulfilling Model of Mexico’s 1994-95 Debt Crisis.” Journal of International Economics, 41(3-4): 309-330.
Cole, Harold L., and Timothy J. Kehoe. 2000. “Self-Fulfilling Debt Crises.” Review of Economic Studies, 67(1): 91-116.
Dahiya, Sandeep. 1997. “The Risk and Returns of Brady Bonds in a Portfolio Context.” Financial Markets, Institutions, and Instruments, 6(5): 45-60.
Dooley, Michael P.2000. “A Model of Crisis in Emerging Markets.” The Economic Journal, 110(460): 256-272.
Dooley, Michael P., and Lars E. O. Svensson. 1994. “Policy Inconsistency and External Debt Service.” Journal of International Money and Finance, 13(3): 364-374.
Duffie, Darrell. 1999. “Credit Swap Valuation.” Financial Analysts Journal, 55(1): 73-87.
Duffie, Darrell, and Jun Liu. 2001. “Floating-Fixed Credit Spreads.” Financial Analysts Journal, 57(3): 76-87.
Duffie, Darrell, and Kenneth J. Singleton. 1999. “Modeling Term Structures of Defaultable Bond Yields.” Review of Financial Studies, 12(4): 687-720.
Duffie, Darrell, and Kenneth J. Singleton. 2003. Credit Risk, Princeton, NJ: Princeton University Press.
Duffie, Darrell, Lasse H. Pedersen, and Kenneth J. Singleton.2003. “Model-ing Sovereign Yield Spreads: A Case Study of Russian Debt.” Journal of Finance, 58(1): 119-159.
Eaton, Jonathan, and Mark Gersovitz. 1981. “Debt with Potential Repudiation: Theoretical and Empirical Analysis.” Review of Economic Studies, 48(2): 289-309.
Edwards, Sebastian. 1984. “LDC Foreign Borrowing and Default Risk: An Empir-ical Investigation, 1976-80.” American Economic Review, 74(4): 726-734.
Edwards, Sebastian. 1986. “The Pricing of Bonds and Bank Loans in International Markets: An Empirical Analysis of Developing Countries’ Foreign Borrowing.” European Economic Review, 30(3): 565-589.
Eichengreen, Barry, and Ashoka Mody.2000. “What Explains Changing Spreads on Emerging-Market Debt?” in The Economics of International Capital Flows, ed. Se-bastian Edwards, 107-136. Chicago, IL: University of Chicago
Erb, Claude B, Campbell R. Harvey, and Tadas E. Viskanta. 1996. “Political Risk, Economic Risk, and Financial Risk.” Financial Analysts Journal, 52(6): 29-46.
Erb, Claude B, Campbell R. Harvey, and Tadas E. Viskanta. 1999. “New Perspectives on Emerging Market Bonds.” The Journal of Portfolio Management, 25(2): 83-92.
Garman, Mark, and Michael J. Klass. 1980. “On the Estimation of Security Price Volatilities from Historical Data.” Journal of Business, 53(1): 67-78.
Geyer, Alois, Stephan Kossmeier, and Stefan Pichler. 2004. “Measuring Sys-tematic Risk in EMU Government Yield Spreads.” Review of Finance, 8(2): 171-197.
Goetzmann, William, Lingfeng Li, and Geert Rouwenhorst. 2005. “Long-Term Global Market Correlations.” Journal of Business, 78(1): 1-38.
Grossman, Herschel I., and John B. Van Huyck. 1988. “Sovereign Debt as a Contingent Claim: Excusable Default, Repudiation, and Reputation.” American Eco-nomic Review, 78(5): 1088-1097.
Kamin, Steven, and Karsten von Kleist.1999. “The Evolution and Determinants of Emerging Market Credit Spreads in the 1990s.” Bank for International Settlements Working Paper 68.
Levy-Yeyati, Eduardo, and Angel Ubide. 2000. “Crises, Contagion, and the Closed-End Country Fund Puzzle.” International Monetary Fund Staff Papers, 47: 54-89.
Longstaff, Francis A., Sanjay Mithal, and Eric Neis. 2005. “Corporate Yield Spreads: Default Risk or Liquidity? New Evidence from the Credit Default Swap