American University in Cairo American University in Cairo
AUC Knowledge Fountain
AUC Knowledge Fountain
Theses and Dissertations2-1-2015
The expression pattern of circulating miR-590-3p as a promising
The expression pattern of circulating miR-590-3p as a promising
diagnostic biomarker for early detection of epithelial ovarian
diagnostic biomarker for early detection of epithelial ovarian
cancer
cancer
Heba ShawerFollow this and additional works at: https://fount.aucegypt.edu/etds
Recommended Citation Recommended Citation
APA Citation
Shawer, H. (2015).The expression pattern of circulating miR-590-3p as a promising diagnostic biomarker for early detection of epithelial ovarian cancer [Master’s thesis, the American University in Cairo]. AUC Knowledge Fountain.
https://fount.aucegypt.edu/etds/224
MLA Citation
Shawer, Heba. The expression pattern of circulating miR-590-3p as a promising diagnostic biomarker for early detection of epithelial ovarian cancer. 2015. American University in Cairo, Master's thesis. AUC Knowledge Fountain.
https://fount.aucegypt.edu/etds/224
This Thesis is brought to you for free and open access by AUC Knowledge Fountain. It has been accepted for inclusion in Theses and Dissertations by an authorized administrator of AUC Knowledge Fountain. For more information, please contact mark.muehlhaeusler@aucegypt.edu.
School of Sciences and Engineering
The expression pattern of circulating miR-590-3p
as a promising diagnostic biomarker for early
detection of epithelial ovarian cancer
A Thesis Submitted to the
Biotechnology Master’s Program
In partial fulfillment of the requirements for theDegree of Master of Science
By
Heba Shawer
Under the supervision of
Dr. Asma Amleh
Associate Professor
Department of Biology
The American University in Cairo School of Sciences and Engineering (SSE)
The expression pattern of circulating miR-590-3p as a promising diagnostic biomarker for early detection of epithelial ovarian cancer
A Thesis Submitted by Heba Shawer
Submitted to the Biotechnology Master’s Program January 2016
In partial fulfillment of the requirements for the degree of Master of Science in Biotechnology
Has been approved by Thesis Committee Supervisor/Chair
_______________________________________________ Affiliation ______________________________________ Thesis Committee Reader/Examiner
______________________________________________ Affiliation _____________________________________ Thesis Committee Reader/Examiner
______________________________________________ Affiliation ______________________________________ Thesis Committee Reader/External Examiner
______________________________________________ Affiliation _____________________________________
_______________ ____________ _____________ _____________ Dept. Chair/Director Date Dean Date !
DEDICATION
! ! ! ! ! ! ! ! ! ! ! !This thesis work is dedicated
to my beloved Mother, Nagwa El-Hennawi and my advisor, Dr. Asma Amleh
for their love and support ! ! ! ! ! ! ! ! ! ! ! ! ! ! ! ! ! ! ! ! ! ! ! !
ACKNOWLEDGEMENTS
!! ! !
My deepest gratitude is to my advisor, Dr. Asma Amleh for her support, guidance, patience and encouragement. I hope that one day I would become as good to my students as Dr. Asma Amleh has been to me, and I deeply appreciate her belief in me.
I would like to acknowledge Dr. Basel Refky who provided and collected the specimens that were examined in this study. My extended appreciation is to Dr. Khaled Abou Aisha who opened his lab to me to perform the real-time PCR experiments.
I am also thankful to the members of Dr. Amleh’s research group. Particularly, Aya El Serw, who performed the semi-quantitative PCR experiments in this work. I am grateful to Aya for her support, care and for bearing with all my ups and downs. I would like to thank Eman El Zeneini and Mai Omar.
I would like to thank my father, Mahmoud Shawer and my mother, Nagwa El-Hennawi for supporting me through my graduate studies. I am thankful to my husband and my brothers for their support and encouragement and my son, Adam Amal for inspiring me. Finally, I would also like to thank the AUC for financially supporting this work.
! ! ! ! ! ! ! ! ! ! ! ! ! ! ! ! ! ! ! !
The expression pattern of miR-590-3p is a promising diagnostic biomarker for early detection of epithelial ovarian cancer
ABSTRACT
Epithelial ovarian cancer (EOC) is the most common type of ovarian tumors. The biomarkers, which are being used for EOC screening, have low sensitivity and specificity leading to late diagnosis and high mortality rate. Thus, identification of effective biomarkers for early diagnosis of ovarian cancer has become a high priority in research. Here we aim to address this problem by studying the expression of a potential molecular marker, miR-590-3p, in EOC. We examined the mRNA steady-state levels of various acknowledged biomarkers including cancer antigen-125 (CA125) which is being used for EOC screening, c-reactive protein (CRP) which expression was correlated with EOC stage and paired homeobox 2 gene (PAX2) whose expression is correlated with the histological grade to characterize the histo-pathological features of the specimens at the molecular level. We examined the expression of miR-590-3p in EOC patients’ serum and EOC tissues, using real-time PCR. The levels of circulating miR-590-3p showed to be significantly elevated in 84.6% of the EOC patients’ serum, with 76.92% sensitivity and 85.7% specificity at its optimal cutoff value. Tissue miR-590-3p showed to be upregulated in EOC tissues compared to normal ovarian tissues and highly correlated with high-grade poorly differentiated EOC. The adoption of the epithelial-mesenchymal transition biomarkers was enriched in EOC with high miR-590-3p levels. The potential downstream target genes, SOX2, LEF1 and PAX2, were predicted using miRanda and Targetscan in silco tools and their expression profiles were in silco examined using Oncomine data-mining platform and StarBase Pan-cancer analysis. We examined the levels of SOX2, LEF1 and PAX2 at the RNA and the protein levels via semi-quantitative PCR and western blot, respectively. Among the investigated potential target genes, only PAX2 showed negative correlation with the levels of miR-590-3p in EOC tissues, suggesting that miR-590-3p could acquire its role in EOC carcinogenesis through regulation of cellular differentiation in EOC.
TABLE OF CONTENTS
DEDICATION!...!iii! ACKNOWLEDGEMENTS!...!iv! ABSTRACT!...!v! TABLE OF CONTENTS!...!vi! LIST OF FIGURES!...!viii! LIST OF TABLES!...!ix! LIST OF ABBREVIATIONS!...!x! CHAPTER 1:!Introduction!...!1! 1.1 Ovarian Cancer!...!1!1.2 Epithelial ovarian cancer!...!1!
1.3 Biomarkers and screening methods for ovarian cancer!...!2!
1.3.1.!Current!biomarkers!...!2! 1.3.2!MicroRNA!potential!biomarker!...!3! 1.3.2.a!MiRNA!biogenesis!...!3! 1.3.2.b!MiRNA!gene!expression!regulation!...!5! 1.3.3!Circulating!miRNAs!are!emerging!cancer!biomarkers!...!5! 1.3.4!Circulating!miRNAs!in!ovarian!cancer!...!7!
1.4 Scope of the study and Study objectives!...!10!
CHAPTER 2:!Materials and Methods!...!13!
2.1 Study participants and sampling!...!13!
2.2 Total RNA extraction from serum and tissue samples!...!14!
2.3 Semi-quantitative reverse transcription-polymerase chain reaction (RT-PCR)!...!15!
2.4 Quantitative real-time RT-PCR!...!16!
2.5 Western blot analysis!...!17!
2.6 Target gene prediction and miRNA functional analysis!...!18!
2.7 Statistical analysis!...!19!
CHAPTER 3:!Results!...!20!
3.1 Clinico-pathologic Characteristics!...!20!
3.2 Histo-pathological characterization at the molecular level!...!23!
3.3 Upregulation of serum miR-590-3p in EOC patients!...!26!
3.4 Serum miR-590-3p level is a promising diagnostic marker for epithelial ovarian cancer!...!29!
3.5 Upregulation of miR-590-3p in EOC tissues!...!30!
3.6 The correlation between miR-590-3p levels and epithelial–mesenchymal transition (EMT) in EOC!...!32!
3.8 The expression of the predicted target genes and its correlation with miR-590-3p in
EOC tissues!...!40!
3.9 MiR-590-3p expression profiles in different cancer types!...!43!
CHAPTER 4:!Discussion, Conclusions and Future directions!...!45!
References!...!51!
Appendix A: Real-time PCR Amplification Plot!...!59!
Appendix B: Quantitative real-time RT-PCR Comparative CT Analysis!Serum Samples!...!60!
Appendix C: Quantitative real-Time RT-PCR!Comparative CT Analysis!Tissue samples!...!63!
Appendix D: IRB Approval!...!67!
Appendix E: Patient’s Consent Forms!...!68!
LIST OF FIGURES
Figure 1: MicroRNA biogenesis and post-transcriptional gene expression regulation. .... 4!
Figure 2: Circulating miRNA packaging and release into blood stream. ... 6!
Figure 3: Schematic flow chart of the Taq-man quantitative real-time PCR experiments. ... 12!
Figure 4: Histological grade of EOC samples. ... 22!
Figure 5: RT-PCR analysis of tissue CA125/Mucin16 shows elevated levels in EOC relative to control tissues (P=0.0001). ... 24!
Figure 6: Higher levels of CRP were associated with advanced stages of EOC. ... 25!
Figure 7: The level of PAX2 mRNA in EOC samples is a marker for EOC histological grade. ... 26!
Figure 8: miR-590-3p is significantly elevated in EOC patients' serum. ... 27!
Figure 9: The correlation between serum miR-590-3p levels and EOC clinicopathological features. ... 28!
Figure 10: Receiver-operator characteristics (ROC) curve analyses of circulating miR-590-3p for EOC patients versus healthy controls. ... 29!
Figure 11: MiR-590-3p expression in EOC tissues. ... 31!
Figure 12: The mRNA steady state levels of EMT markers in EOC and control ovarian tissues. ... 33!
Figure 13: Downregulation of SOX2 in ovarian cancer relative to normal ovarian tissues. ... 36!
Figure 14: Computational analysis depicts LEF1 as a potential target gene for miR-590-3p... 37!
Figure 15: In silco analysis of PAX2 as a potential downstream target of miR-590-3p. . 38!
Figure 16: SOX2 expression is not significantly correlated to miR-590-3p levels in EOC tissues.. ... 41!
Figure 17: The correlation between LEF1 expression and miR-590-3p in EOC. ... 42!
Figure 18: The correlation between the expression of PAX2 and miR-590-3p. ... 43!
Figure 19: Expression profiles of miR-590-3p among different cancer types. ... 44! !
! ! !
LIST OF TABLES
Table 1: Summary of the dysregulated extracellular miRNAs in ovarian cancer. ... 8!
Table 2: Summary of the clinical characteristics of patients in the study. ... 13!
Table 3: Primers used for semi-quantitative PCR. ... 15!
Table 4: Taq-Man MicroRNA Assays ... 17!
Table 5: Clinical characteristics of EOC patients in the study. ... 20!
Table 6: The levels of tissue CRP in different stages of EOC ... 21!
Table 7: The levels of tissue PAX2 in different histological grades. ... 22!
Table 8: The alignment features of the putative miR-590-3p targets. ... 39! ! ! ! ! ! ! ! ! ! ! ! ! ! ! ! ! ! ! ! ! ! ! ! ! ! ! !
LIST OF ABBREVIATIONS
Ago2 ! AIMP3 ! ANOVA AUC ! Bta! CA125! cDNA ! Cfa! CI ! Cpo! CRP ! Dno! dsRBD ! EIF4H ! EMT ! EOC Fca! FIGO ! GAPDH ! GBM ! HCC ! HE4 ! Argonaute 2 proteinAminoacyl- tRNAsynthetase-Interacting Multifunctional Protein-3 Analysis of Variance
Area Under the receiver-operating characteristic Curve Bos Taurus Cancer antigen 125 Complementary DNA Canis familiaris Confidence Interval Cavia porcellus C-Reactive Protein Dasypus novemcinctus
Double-stranded RNA-binding protein Eukaryotic Initiation Factor 4H gene Epithelial–Mesenchymal Transition Epithelial Ovarian Cancer
Felis catus
International federation of Gynecology and Obstetrics Glyceraldehyde-3-Phosphate Dehydrogenase
Glioblastoma
HepatoCellular Carcinoma Human Epididymal protein4 !
hnRNPs HNSC Hsa! Hsa-miR-590-3p IRB ! LEF1 ! Mdo! mESCs ! mins ! MiRNA ! Mml! Mmu! mRNA ! MV ! MVB ! Ng! Oga! ORF! OVCA! OVCA-432 ! OVCAR-3 ! P-value ! PAX2 ! PBS !
Heterogeneous nuclear ribo-nucleoproteins Head-Neck Squamous Cell Carcinoma Homosapiens
Homosapians microRNA-590-3p Institutional Review Board
Lymphoid Enhancer-binding Factor1 Monodelphis domestica
Mouse Embryonic Stem Cells Minutes MicroRNA Macaca mulatta Mus musculus Messenger RNA Microvesicles Multivascular bodies Nano gram Otolemur garnetti Open Reading Frame Ovarian Cancer
Ovarian serous adenocarcinoma cell line
High-grade ovarian serous adenocarcinoma cell line Probability value
Paired homeobox 2 gene Phosphate-buffered saline
! PCR ! Pre-miRNA Pri-miRNA ! Ptr! QRT-PCR ! RISC ! RNA Rno ROC! rpm ! RT-PCR ! SDS ! secs! snRNA ! SOX2 ! TCGA ! THCA ! Tov21g! TRBP ! µl 3’UTR ! !
Polymerase chain reaction miRNA precursor
Primary miRNA transcript Pan troglodytes
Quantitative Reverse transcription-polymerase chain reaction RNA-induced silencing complex
Ribonucleic acid Rattus norvegicus
Receiver Operating Characteristic Revolutions per minute
Reverse transcription-polymerase chain reaction Sodium Dodecyl Sulfate
Seconds
Small nuclear RNA
Sex determining region-Y-related high mobility group box 2 The Cancer Genome Atlas
Thyroid carcinoma
Malignant ovarian clear cell adenocarcinoma cell line Transactivation-responsive RNA-binding protein Micro-litters
CHAPTER 1
Introduction
1.1 Ovarian CancerOvarian cancer (OVCA) is the most lethal cancer in the female reproductive system (Howlader N, 2015). In developing countries, ovarian cancer represents 18.8% of all types of gynecological cancers (Jemal et al., 2011). The worldwide ovarian cancer deaths in 2008, was estimated to be 140,200 deaths out of 225,500 ovarian cancer cases, with 54% of the worldwide ovarian cancer deaths and 55% of the worldwide ovarian cancer cases found in the developing countries (Jemal et al., 2011). Moreover, the five-year survival among ovarian cancer cases is less than 50% (Sankaranarayanan & Ferlay). This high mortality is mainly due to the diagnosis of ovarian cancer at advanced stages. About 70% of the patients are diagnosed at late stages and that is mainly due to the absence of effective screening methods (Gang et al., 2012). Thus, OVCA is called the “silent killer”, as the symptoms are not very beneficial for diagnosis because they are similar to that of gastrointestinal and gynecological disorders (Gang et al., 2012). The most common type of ovarian cancer is the epithelial ovarian cancer (EOC) that accounts for about 90% of the ovarian cancer cases. EOC is a highly heterogeneous disease and its etiology is still not fully understood.
1.2 Epithelial ovarian cancer
The origin of EOC and its etiology are not clear and are strongly debated. Early studies used to believe that EOC was derived from the mesothelium, which is the ovarian surface epithelium, as reviewed by (Dubeau, 2008). Nonetheless, recent studies proposed that EOC was originated from müllerian-type tissues (Bast et al., 2009). EOC is classified into various histological subtypes, which are serous, mucinous, endometrioid, transitional (Brenner), and clear cell, as reviewed by (V. W. Chen et al., 2003). The morphological features of the serous type are similar to that of the fallopian tube epithelium. Mucinous and endometrioid types have similar morphology to that of the endocervical epithelium and endometrium, respectively. The cervix, endometrium and fallopian tubes are originated from müllerian-type tissue. Therefore, EOC shows müllerian phenotype,
There are three histological grades of EOC based on the degree of tumor cell differentiation. Grade-I is characterized by its well-differentiated cellular appearance. Grade-II tumor is characterized by having moderately differentiated tumor cells and grade-III tumors are made up of poorly differentiated cells. EOC can be classified into four stages depending on the degree of the tumor spread. The stage of the tumor can be determined by radiologic evaluation and surgically (Heintz et al., 2006). The EOC staging is classified based on the International Federation of Gynecology and Obstetrics (FIGO) criteria (Heintz et al., 2006). In stage-I tumors, the tumor is limited to the ovaries, could be one (IA) or both of the ovaries (IB). Stage-II tumors are more spread involving both of the ovaries and uterus (IIA) and could have extension to the pelvic area (IIB/IIC). Stage-III tumors involving the ovaries, with confined intra-peritoneal metastases outside the pelvis (IIIA/IIIB) and/or extinction to the peritoneal lymph nodes (IIIC). Finally, stage-IV tumors spread beyond the ovaries to reach distant organs as the lungs (Heintz et al., 2006).
1.3 Biomarkers and screening methods for ovarian cancer 1.3.1. Current biomarkers
Cancer antigen (CA) 125 is the most popular biomarker for ovarian cancer diagnosis. CA125 is a glycoprotein that was found to be elevated in the blood of about 80% of EOC patients and in only 50% of patients at early stages (Havrilesky et al., 2008; Rosen et al., 2005). CA125 gives indication to ovarian cancer progression and response to chemotherapy. Also, its levels were found to be elevated in benign cases as in pregnancy or fibroids. Therefore, CA125 blood test is being used for ovarian cancer diagnosis along with vaginal examination and along with other biomarkers, as the Human Epididymal Protein 4 (HE4), in order to increase the sensitivity and specificity of the test (Gadducci et al., 2009; Gang et al., 2012; Rosen et al., 2005).
The Human Epididymal Protein 4 (HE4) is a glycoprotein normally expressed in the female reproductive system and is elevated in ovarian cancer cases (Ławicki et al., 2013). The specificity and sensitivity of HE4 as a biomarker for ovarian cancer is enhanced, when used in conjugation with CA125 blood test (Havrilesky et al., 2008; Ławicki et al., 2013). The use of HE4 along with CA125 can differentiate between benign conditions
and ovarian cancer, which can’t be distinguished by CA125 alone (Gang et al., 2012). However, their low sensitivity and low specificity necessitate the development of a new efficient biomarker.
1.3.2 MicroRNA potential biomarker
MicroRNAs (miRNAs) expression and their use as biomarkers for EOC is a promising field of study. Circulating miRNAs are remarkably stable and easily detected. The dysregulation of extracellular miRNAs was observed in various diseases, including cancer.
1.3.2.a MiRNA biogenesis
MiRNAs are mainly transcribed by RNA Polymerase II, producing primary miRNA transcript (pri-miRNA) (Y. Lee et al., 2004). RNA Polymerase III transcribes certain miRNA genes, located within Alu- repetitive elements in chromosome 19 (Borchert et al., 2006). Several miRNA genes are located close to each other and are transcribed as long polycistronic primary miRNA (pri-miRNA) transcripts (Y. Lee et al., 2004). Pri-miRNAs are stem-loop transcripts with length from hundreds to thousand of nucleotides with poly-adenylated 3’ end, and 5’cap structures (Y. Lee et al., 2002). In the nucleus, the pri-miRNA is processed into hairpin-shaped intermediate 60 to 70 nucleotides in length called miRNA precursor (pre-miRNA) by microprocessor multi-protein complex (Gregory et al., 2004). The microprocessor complex consists of Drosha nuclear RNase III enzyme, a double-stranded RNA-binding protein (dsRBD) called DGCR8/Pasha and co-factors, such as RNA helicases and heterogenous nuclear ribo-nucleoproteins (hnRNPs). DGCR8/Pasha protein binds to pri-mRNA at the single stranded RNA- double stranded RNA junction in order to direct the Drosha RNase III enzyme to cut the strands of the stem at the base of the stem loop. Drosha cleavage generates pre-miRNA with 5’ mono-phosphate and 2 nucleotides 3’ overhang which is characteristic for RNase III cleavage (Y. Lee et al., 2002).
The pre-miRNA is then transported in the presence of GTP from the nucleus to the cytoplasm by exportin-5 that recognizes the 3’overhang (Gregory et al., 2004). The pre-miRNA undergoes further processing in the cytoplasm by Dicer RNase III enzyme and
Argonaute 2 (Ago2) protein and the transactivation-responsive RNA-binding protein (TRBP). The Ago2 binds to the pre-miRNA and cleaves its 3’end through exo-nucleolytic trimming and then Dicer induce further cleavage of the Ago2-cleaved pre-miRNA to generate mature pre-miRNA duplex (Hutvágner et al., 2001). The pre-miRNA mature strand is loaded into the RISC complex and guides the miRNA-RISC complex to the complementary sequence in the target mRNA. It mainly represses gene expression by inducing mRNA degradation through the endonuclease activity of the Ago protein that can cleave miRNA-mRNA double stranded complex (Hutvágner & Zamore, 2002) or through mRNA destabilization via inducing mRNA deadenylation (Behm-Ansmant et al., 2006; Wu et al., 2006) or can inhibit the translation of the target mRNA (Nottrott et al., 2006; Petersen et al., 2006). MiRNA biogenesis encompasses various complexes that cleave, export and generate the mature miRNA. They themselves are regulated by diverse mechanisms to ensure the proper miRNA regulation. Each step in the miRNA biogenesis, from transcription till binding to the target mRNA, plays a regulatory function that controls the production level of miRNAs and regulates the miRNA-mediated gene expression regulation.
! Figure 1: MicroRNA biogenesis and post-transcriptional gene expression regulation. In the nucleus, miRNAs are transcribed by RNA polymerase II/III and producing primary
miRNA transcript (pri-miRNA), which is cleaved by Drosha-DGCR8 endonuclease complex to produce miRNA precursors (pre-miRNA). The pre-miRNA is exported to the cytoplasm through exprotin-5 and then undergoes further processing in the cytoplasm by ribonuclease Dicer generating miRNA duplex. The duplex unwinds producing a single stranded mature miRNA that is incorporated into RISC complex and serve as a guide for mRNA targeting resulting mainly in translation inhibition or mRNA degradation. The figure was generated using OmniGraffle 6.4.1.
1.3.2.b MiRNA gene expression regulation
MiRNAs, which are small noncoding single stranded RNA of around 20 to 25 nucleotides in length, regulate the expression of more than 30% of the human protein-coding genes (Xiaohui et al., 2005). They regulate various biological processes including cell proliferation, tissue differentiation and developmental timing. The abnormal expression of miRNAs is involved in various types of cancers and can be used in diagnostic and prognostic analyses (Thomson et al., 2006). Alterations in miRNA expression are associated with abnormal cell development in cancer. MiRNAs may act as oncogene or tumor suppressor depending on their target gene. MiRNAs mainly act by imperfect base pairing with the target mRNA. It mainly represses gene expression by destabilization of the transcript or by translational inhibition (Figure 1). A single miRNA targets more than one mRNA and the disruption in the miRNA mediated gene regulation affects tissue differentiation and is associated with various diseases, including cancer. 1.3.3 Circulating miRNAs are emerging cancer biomarkers
Secretory miRNAs were detected in various body fluids, including plasma, serum, urine, breast milk and saliva (Hunter et al., 2008; Kosaka et al., 2010). Unexpectedly, miRNAs in body fluids showed to be remarkably stable, even under harsh conditions as in repeated freezing and thawing, prolonged storage at room temperature, as well as being resistant to RNase activity and resistant to extreme pH levels (Mitchell et al., 2008). This high stability mainly accounts to miRNA inclusion in microvesicles, exosomes, lipoproteins, RNA-binding protein complexes or apoptotic bodies (El-Hefnawy et al., 2004; Hunter et al., 2008) (figure-2). Exosomes are double lipid layer 50-90 nm vesicles that are released from the donor cells by fusion of multivascular bodies (MVB) with the plasma membrane (Février & Raposo, 2004). Microvesicles (MV) are larger vesicles (0.1-1 µm) released through outward shedding of the plasma membrane (Hunter et al., 2008). Also, miRNA
(Zernecke et al., 2009). Valadi and colleagues showed that exosomal miRNAs are secreted from donor cells to the blood stream and are uptaken by endocytosis to regulate gene expression in the recipient cell as a form of cell-cell communication (Valadi et al., 2007).
! Figure 2: Circulating miRNA packaging and release into blood stream. Mature miRNAs are released from the cell through various mechanisms, including sorting into MVB that are discharged by exosomes, outward shedding of microvesicles that encompass miRNA, miRNA may also be released by incorporation into RNA-binding proteins or high-density lipoproteins (HDL). Also, apoptotic bodies could convey miRNAs into the blood stream. Circulating miRNAs also serve in cell-to-cell communication. The figure was generated using OmniGraffle 6.4.1.
The levels of circulating miRNAs are highly affected by various diseases including cancer. Therefore, they are considered as minimally invasive potential biomarkers for the diagnosis and prognosis of cancer. Selected cellular miRNAs showed be designated for extracellular release via exosomes. Where, Pigati and colleagues reported that only 66% of the cellular miRNA are released to the extracellular space at levels corresponding to
the cellular miRNA levels (Pigati et al., 2010) and 21% of the cellular miRNAs were found at excessively higher levels in the cell-derived exosomes than that of the mother cells. The remaining 13% of the miRNAs were selectively kept inside the cell without extracellular release. Moreover, the selection of the secreted miRNAs was significantly affected by malignancy (Pigati et al., 2010). The selective miRNA release could also reflect the stage of cancer, the response to treatment, metastasis and cancer prognosis. This infers that the cell employs certain mechanisms to designate certain miRNAs to be released via the vesicles to the body fluids. These mechanisms of secretory miRNAs selection and the role of these circulatory miRNAs are still not fully understood.
1.3.4 Circulating miRNAs in ovarian cancer
Taylor and Gercel-Taylor showed that the levels of circulating tumor-derived exosomes were significantly elevated in ovarian cancer patients relative to patients with benign ovarian tumor and healthy females. (Taylor & Gercel-Taylor, 2008). Several miRNAs were identified to be dysregulated in the serum of ovarian cancer patients. Resnick and colleagues identified five miRNAs, miR-21, miR-92, miR-93, miR-126 and miR-29a, elevated in the serum of ovarian cancer patients and another three downregulated miRNAs, miR-155, miR-127 and miR-99b (Resnick et al., 2009). Serum miR-145 was described to be downregulated in ovarian cancer patients compared to healthy controls (Table 1) (Liang et al., 2015). In another study, the combination of the elevated plasma miR-205 levels and reduced plasma let-7f levels in ovarian cancer patients were proposed as a potential diagnostic tool (Table 1) (Kan et al., 2012; Zheng et al., 2013). Serum miR-200 family were found to be elevated in other cancer types including colorectal cancer (Toiyama et al., 2014), gastric cancer (Valladares-Ayerbes et al., 2012), breast cancer (Antolin et al., 2015) and hepatocellular carcinoma (Dhayat et al., 2015).
Table 1: Summary of the dysregulated extracellular miRNAs in ovarian cancer. Differentially expressed miRNAs The body
fluid Approach AUC* Sensitivity Specificity Population Reference
Combination of miR-205 (Up) +
Let-7f (Down) Plasma
TaqMan low-density array Real-time- PCR 0.831 62.4% 92.9% EOC (n=260), Healthy controls (n=200) (Zheng et al., 2013) miR-200c (Up)
miR-141 (Up) Serum Real-time PCR
0.79 0.75 72% 69% 70% 72% EOC (n=74), Healthy controls (n=50) (Gao & Wu, 2015) 21, 92, 93,
miR-126 and miR-29a (Up)
miR-155, miR-127 and miR-99b (Down) Serum TaqMan Array Human MicroRNA panel Real-time PCR
n/a** n/a n/a
EOC (n=28), Healthy
controls (n= 15) (Resnick et al., 2009)
miR-145 (Down) Serum Real-time PCR 0.82 n/a n/a
Malignant OVCA (n=84), Healthy control (n=135)
(Liang et al., 2015) miR-106b, miR-126, miR-150,
miR-17, miR-20a, and miR-92a
(Up) Plasma Taqman Open Array MicroRNA pools <0.8 >0.8 n/a n/a Serous EOC (n=42), Healthy controls (n=23) (Shapira et al., 2014)
miR-92 (Up) Serum Real-time PCR 0.8 80.7% 75% EOC (n=50), Healthy
controls (n-50)
(Guo et al., 2013)
miR-30a-5p (Up) Urine
miRNA microarray Real-time PCR
0.862 n/a n/a Serous EOC (n=39), Healthy controls (n=30)
(Zhou, 2015)
miR-221 (Up) Serum Real-time PCR n/a n/a n/a EOC (n=96), Healthy
controls (n=35)
(Hong et al., 2013)
miR-21 (Up)
Serum Real-time PCR n/a n/a n/a EOC (n=94), Healthy controls (n=40)
(Yun-Zhao Xu1, 2013)
U2-1 snRNA (Up) Serum
Microarray
Real-time PCR n/a n/a n/a
OVCA (n=119),
Healthy controls (n=35)
(Kuhlmann et al., 2014) *AUC: area under the receiver operating characteristic curve.
1.4 Scope of the study and Study objectives
Various miRNAs were reported to have a role in EOC development. However, the role of miR-590-3p in EOC was not studied before. Here, we employed various bioinformatics analysis to identify the potential role of miR-590-3p in EOC development. Our initial analysis suggested that miR-590-3p could have a role in tumor initiation, through regulating vital cellular pathways including cell differentiation processes. Additionally, the diagnostic potential of the circulating miR-590-3p was never investigated in cancer patients, despite being listed among the twenty most abundant miRNAs in most of the body fluids (Weber et al., 2010). Our aim is to study the levels of circulating miR-590-3p in the serum as a potential minimally invasive biomarker for the diagnosis of EOC, as well as investigating its potential role in EOC carcinogenesis. The human miR-590-3p (hsa-miR-590-3p) is an intragenic intronic miRNA, 21 nucleotides in length, located within intron number 5 of the eukaryotic initiation factor 4H (EIF4H) gene and is located at chromosome 7: 73605528-73605624 [+]. The basic expression of miR-590-3p was detected at its highest levels in the heart, followed by the testes and the kidneys; nonetheless minimal levels were detected in the brain and the cerebellum.
Previous studies described the role of miR-590-3p in stem cells. In normal human mesenchymal stem cells, miR-590-3p ectopic expression increased cell proliferation and clonogenicity, as well as reducing cellular senescence via the direct downregulation of aminoacyl- tRNAsynthetase-interacting multifunctional protein-3 (AIMP3/p18), which is also a tumor suppressor gene (S. Lee et al., 2014). Also, miR-590 plays a role in DNA repair of the double strand breaks and the single strand breaks that could occur during the rapid proliferation of the mouse embryonic stem cells (mESCs), without affecting its stemness features (Liu et al., 2014). In adult cardiomyctes that have limited low proliferation ability, miR-590-3p induced-expression resulted in cell cycle re-entry and promoted adult cardiomyocytes proliferation (Eulalio et al., 2012).
In previous studies, altered expression of miR-590-3p was detected in bladder cancer, glioblastoma and hepatocellular carcinoma. Nevertheless, the published studies about miR-590-3p in cancer reached opposing or inconsistent conclusions. In bladder cancer, miR-590-3p was downregulated relative to the normal and adjacent tumor tissues and
induced-overexpression of miR-590-3p in bladder cancer cell lines inhibited cell proliferation, migration and colony formation (Mo et al., 2013). On the other hand, miR-590-3p was significantly upregulated in in hepatocellular carcinoma (HCC) tissues and cell lines, and the ectopic expression of miR-590-3p promoted HCC cell proliferation (H. Yang et al., 2013). Yan and colleagues examined miRNA expression in 116 samples of low-grade gliomas, anaplastic gliomas and secondary glioblastomas using microarray and quantitative real-time PCR analysis and they reported that miR-590-3p was significantly upregulated in anaplastic gliomas and secondary glioblastomas relative to low-grade gliomas, in both the microarray screening cohort and the qPCR validation cohort (Yan et al., 2014). However, in a recent study that was also about glioma, Pang and colleagues reported that miR-590-3p was downregulated in glioma tissues and cell lines compared to non-neoplastic brain tissues and primary normal human astrocytes (Pang et al., 2015). The differing data about the expression pattern of miR-590-3p in cancer suggests that miR-590-3p could play its role in a certain stage of tumor development, thus further studies need to be conducted to clarify the role of miR-590-3p in carcinogenesis.
The specific objectives of the study are:
1. Studying the diagnostic ability of the circulating miR-590-3p by examining its levels in EOC patients’ serum, as well as the levels of miR-590-3p in EOC tissues relative to healthy controls. The experimental design of the real-time PCR experiments is illustrated in Figure 3.
2. Studying the potential association of miR-590-3p levels with epithelial-mesenchymal transition.
3. Investigating the potential role of miR-590-3p in EOC through studying its potential downstream targets in EOC.
4. Studying the expression profiles of miR-590-3p in different cancer types, through utilizing the expression data available at The Cancer Genome Atlas (TCGA) Data Portal.
!
Figure 3: Schematic flow chart of the Taq-man quantitative real-time PCR experiments. A) Whole blood collection by venipuncture and serum separation, followed by RNA extraction and synthetic spike-in control was used as internal control. B) EOC tissues were snap frozen in liquid nitrogen directly after being dissected from patients, and then, placed in RNAlater-ICE Frozen tissue transition solution, followed by total RNA extraction using Triazol reagent. C) MiRNA reverse-transcription using miRNA-specific stem-loop primers and quantitative real-time PCR using TaqMan MicroRNA Assays. Figure generated using OmniGraffle 6.4.1.
!
! ! !
CHAPTER 2
Materials and Methods
2.1 Study participants and samplingThe blood samples were collected from 13 patients with EOC prior to surgery. One blood sample from patient with benign ovarian tumor and six blood samples from age-matched healthy females with no history of cancer, were obtained as controls. The whole blood was collected by venipuncture, and then serum was separated by centrifugation at 10,000 rpm for 10 min and stored at -80OC (Figure 3).
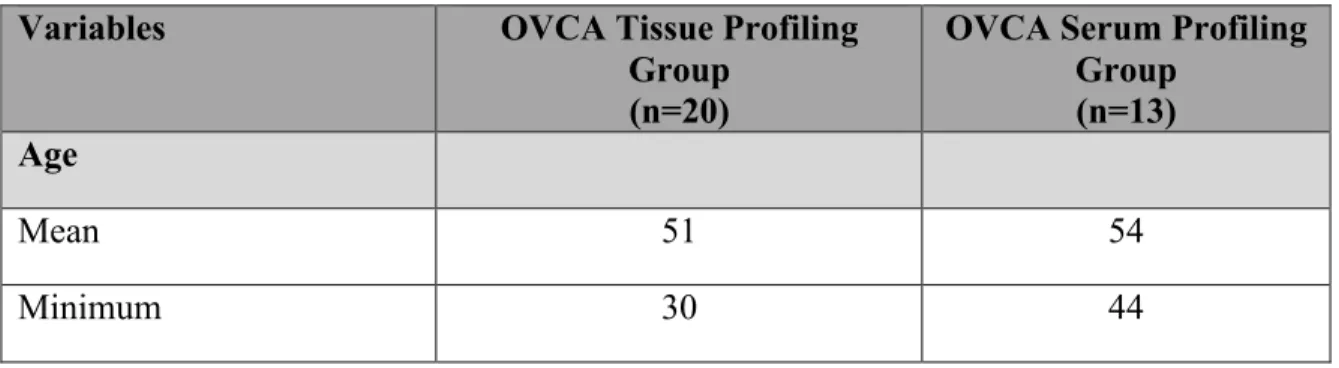
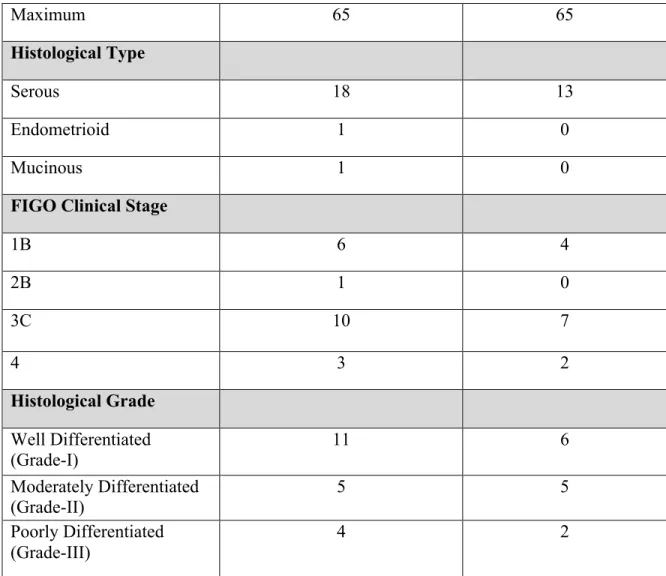
Twenty EOC tissue samples were obtained from tumor dissection surgeries at the Oncology Center of Mansoura University starting from December 2013 till June 2015. International Federation of Gynecology and Obstetrics (FIGO) staging was used for clinical staging of the tumor. Imaging scans was obtained before surgery to determine the stage of ovarian cancer. The tumor grade was assessed through histo-pathological examination. The histo-pathological examination was performed at the oncology Center of Mansoura University. The EOC tissues were fixed with fixative solution and embedded in paraffin, then sectioned with a microtome. Dewaxed sections were stained using hematoxylin and eosin (H&E). Six healthy ovarian tissues from hysterectomy surgeries and one benign ovarian tumor were included in the study. The clinical characteristics of the patients are summarized in Table 2. The excised tissues were snap frozen, in liquid nitrogen, directly after being dissected from the patients. The snap frozen tissues were placed in RNAlaterICE Frozen tissue transition solution and stored at -800C. The Institutional Review Board (IRB) of the American University in Cairo approved the protocols followed in this study. All patients provided informed consents. Table 2: Summary of the clinical characteristics of patients in the study.
Variables OVCA Tissue Profiling
Group (n=20)
OVCA Serum Profiling Group
(n=13) Age
Mean 51 54
Maximum 65 65
Histological Type
Serous 18 13
Endometrioid 1 0
Mucinous 1 0
FIGO Clinical Stage
1B 6 4 2B 1 0 3C 10 7 4 3 2 Histological Grade Well Differentiated (Grade-I) 11 6 Moderately Differentiated (Grade-II) 5 5 Poorly Differentiated (Grade-III) 4 2
2.2 Total RNA extraction from serum and tissue samples
RNA from the serum samples was extracted using Qiagen miRNeasy Serum/Plasma Kit (Qiagen). Frozen serum samples were allowed to thaw completely on ice and were mixed gently by inversion. Serum samples were filtered through 0.22µm filter to remove any remaining cellular contents that were not removed by centrifugation. One part of each serum sample was mixed with 5 parts of Qiazol. MiRNeasy Serum/Plasma Spike-In Control (1.6 x 10⁸ copies/µl of synthetic C. elegans Cel_miR-39-3P miRNA mimic 5’-UCACCGGGUGUAAAUCAGCUUG-3’) was used as internal control by adding 3.5 µl of the spike-in control prior to the addition of chloroform to normalize the variation in RNA extraction and amplification efficiency between samples. The RNA extraction for serum was resumed following the manufacturer's instructions.
Total RNA was extracted from the frozen tissue samples using Triazol reagent (Invitrogen, USA) according to the manufacturer's instructions. In 1.5 ml Rnase-free Eppendorf tubes, frozen sections of the tissues were mechanically homogenized in Triazol using sterile pestles. Then after addition of chloroform, the aqueous phase was transferred into clean tube. Total RNA was precipitated using ice-cold isopropyl alcohol and pelleted by centrifugation. The formed pellet was washed, twice, with 75% ethanol. Then, the pellet was air-dried, and then re-suspended in DEPC-treated water.
The RNA concentration was assessed using the Nanodrop RiboGreen assay kit (Molecular Probes Cat. # R11490) using NanoDrop-3300 Fluoro-spectrometer (Thermo Scientific, USA). The A260/A280 ratio was measured by using spectrophotometer UV-1800 (Shimadzu, Japan) to assesse the RNA purity.
2.3 Semi-quantitative reverse transcription-polymerase chain reaction (RT-PCR) First Strand cDNA was synthesized using random primers from 1 µg RNA by RevertAid First Strand cDNA synthesis Kit (Thermo Scientific, USA) according to the manufacturer’s instructions. The PCR reaction was carried out by mixing 1 µl cDNA template, 2.5 µl 10X DreamTaq PCR buffer, 0.5 µl 10mM dNTPs, 0.25 µl Dream Taq Polymerase, 0.75 µl primers (forward and reverse primers) and nuclease-free water for a total volume of 25 µl. The expression level of the genes was normalized using GAPDH as endogenous control. The thermo-cycler program is 95°C for 5 mins, followed by cycles of (95°C for 30 secs, annealing temp for 30 secs and 72°C for 45 secs). The annealing temperatures and cycle number is indicated in Table 3. We ran the PCR products on a 1.5% agarose gel then visualized using Gel Doc EZ System (Bio-Rad, USA).
Table 3: Primers used for semi-quantitative RT-PCR.
Primer Sequence Annealing
temperature Number of cycles
GAPDH F*: 5'-CCACCCATGGCAAATTCCATGGCT-3' R**: 5'-TCTAGACGGCAGGTCAGGTCCACC-3' 60.5°C 30 cycles MUCIN16/ CA125 F: 5’-ACATCAACTCCTGCCTTCCCAGAA-3’ 57°C 30 cycles
ACCAGTGGGCATTCCAGAAAGAGA-3’ CRP F: 5’-TCGTATGCCACCAAGAGACAAGACA-3’ R: 5’-AACACTTCGCCTTGCACTTCATACT-3’ 58 °C 38 cycles PAX2 F: 5’-GTACTACGAGACCGGCAGCATC-3’ R: 5’-CGTTTCCTCTTCTCACCATTGG-3’ 58°C 35 cycles Vimentin F: 5’-GAACGCCAGATGCGTGAAATG-3’ R: 5’-CCAGAGGGAGTGAATCCAGATTA-3’ 60 °C 35 cycles E-Cadherin F: 5'-CCTTCCTCCCAATACATCTCCC-3' R: 5'-TCTCCGCCTCCTTCTTCATC-3' 58°C 33 cycles LEF1 F: 5'-ACAGCGGAGCGGAGATTACAGAG-3' R: 5'-TCCCTTGTTGTAGAGGCCTCCATC-3' 60°C 35 cycles SOX2 F: 5'-TTACCTCTTCCTCCCACTCC-3' R: 5'-CCTCCCATTTCCCTCGTTT-3' 57°C 37 cycles *Forward primer, **Reverse primer.
2.4 Quantitative real-time RT-PCR
MicroRNA-590-3p levels in the serum and tissues were analyzed using Taq-Man MicroRNA Assays (Applied Biosystems, USA). Ten ng of the total RNA was reverse-transcribed using miRNA-specific stem-loop primers and Taq-Man miRNA Reverse Transcription Kit in a scaled down 5µl reaction. The RT reactions were incubated for 30 min at 16 °C, then for 30 min at 42 °C, and then for 5 min at 85 °C. The RT products were stored at -20 °C till running the real-time PCR reaction. The real-time PCR reaction was performed using Taq-Man MicroRNA Assays (Table 4) (Reporter dye: FAM and reporter quencher: NFQ) on Mx3005P QPCR System (Stratagene). The cDNA was mixed with the PCR primers and probes (5'-FAM and 3'-TAMRA), and Taq-Man Universal Master Mix, No AmpEraseH UNG (Applied Biosystems), then incubated at 95 °C for 10 min, followed by 40 cycles of 95°C for 15 sec and 60°C for 1 min. Automatic setting for assigning the baseline and threshold for Ct determination was used. A Ct of 35 was set as cut-off value to be considered as non-detected (Caraguel et al., 2011). For the serum samples, Synthetic C. elegans Cel_miR-39 miRNA mimic was used as internal control (validated control by (Zhang et al., 2013). The expression level of the tissue miR-590-3p was normalized to U6 snRNA. Each measurement was performed in duplicates including the no-template controls and the no-reverse transcriptase controls. The relative
quantification of miR-590-3p was estimated using the comparative ΔΔCT method (Livak & Schmittgen, 2001).
Table 4: Taq-Man MicroRNA Assays MicroRNA Accession Number MicroRNA Assay Name Assay ID MicroRNA sequence MIMAT000 4801 Hsa-miR-590-3p 002677 UAAUUUUAUGUAUAAGCUAGU NR_004394 U6 snRNA 001973 GTGCTCGCTTCGGCAGCACATAT ACTAAAATTGGAACGATACAGAG AAGATTAGCATGGCCCCTGCGCA AGGATGACACGCAAATTCGTGAA GCGTTCCATATTTT MIMAT000 0010 Cel-miR-39 000200 UCACCGGGUGUAAAUCAGCUUG
2.5 Western blot analysis
Protein lysates were prepared by mechanical homogenization of the tissues in 2X ice-cold Laemmle lysis buffer (50mM Tris pH6.8, 2% sodium dodecyl sulfate (SDS), and 10% glycerol) with freshly added 1X Halt Protease Inhibitor Cocktail (ThermoScientific, USA). Then, the samples were incubated at 4°C for 2 hours, followed by centrifugation at 12,000 rpm at 4°C for 20 minutes. The supernatant protein lysates were transferred into fresh Eppendorf tubes and quantified using Pierce BCA Protein Assay Kit (Pierce Biotechnology, USA) according to the manufacturer's instructions. Serial dilution of the standard bovine serum albumin (BSA) of known concentration was prepared to generate the standard curve. Optical density was taken at 562nm using spectrophotometer and the working reagent was used as a blank.
Equal concentrations of the protein lysates (30µg) were mixed with 6X SDS-Laemmli loading dye (60% Glycerol, 360 mM Tris-HCl pH 6.8, 12% SDS, 0.06% bromophenol blue, 30% beta-mercaptoethanol) and boiled at 99°C for 5 minutes. The samples were loaded on 12% SDS- polyacrylamide gel, and then plotted on a PVDF membrane. After
hour, the membrane was incubated with anti-SOX-2 rabbit polyclonal antibody (0.5µg/ml), or anti-LEF1 goat polyclonal antibody (2µg/ml) overnight at 4°C. After washing, we incubated the membrane in goat anti-rabbit or mouse anti-goat alkaline phosphatase-conjugated secondary antibody (KPL) (1:10000 dilution in 5% non-fat dry milk in PBS-T). After washing, the protein bands were detected using Phosphatase Chemiluminescent Substrate.
To examine the loading control on the same membranes, the membranes were incubated with harsh stripping buffer (0.5 M Tris-HCl, 10% SDS and beta-mercaptoethanol) for 15 minutes at 65°C, then washed thoroughly with water to remove any traces of beta-mercaptoethanol. The membranes were blocked with blocking solution for one hour, then incubated with anti-β-Tubulin mouse monoclonal antibody (Sigma, T7816) (1:20,000 in 5% non-fat dry milk) overnight at 4°C. After washing, we incubated the membrane in goat anti-mouse alkaline phosphatase-conjugated secondary antibody (KPL) (1:10000 in 5% non-fat dry milk in PBS-T). After washing, the protein bands were detected using Phosphatase Chemiluminescent Substrate.
2.6 Target gene prediction and miRNA function prediction analysis
MiR-590-3p potential target genes were predicted using TargetScan (Agarwal et al., 2015) (www.targetscan.org), and miRanda-mirSVR (Betel et al., 2010; Betel et al., 2008; John et al., 2004) (www.microrna.org). The thermodynamic stability between miR-590-3p and the 3’UTR of LEF1 mRNA and PAX2 mRNA was predicted using miRmap (http://mirmap.ezlab.org/ app/). The expression profiles of the potential target genes were examined using Oncomine data-mining platform (http://www.oncomine.org) (Rhodes et al., 2004) that covers cancer microarrays. StarBase Pan-cancer analysis platform (http://starbase.sysu. edu.cn/pan Cancer.php) (Li et al., 2014; J.-H. Yang et al., 2011) was used to compile the expression profiles of miR-590-3p and LEF1 utilizing the data available at The Cancer Genome Atlas (TCGA) Data Portal and to study the correlation between their expression levels in ovarian cancer.
We used FAME (Functional Assignment of MicroRNAs via Enrichment) software (Ulitsky et al., 2010) (http://acgt.cs.tau.ac.il/fame/) to predict the potential function of miR-590-3p through analyzing its downstream target genes.
2.7 Statistical analysis
The relative expression of miR-590-3p was calculated using the comparative ΔΔCT method (Livak & Schmittgen, 2001). The relative levels of miR-590-3p were presented as log transformed log10 (2-ΔΔCT) of the relative levels of 3p. Serum miR-590-3p levels were used to generate the receiver operating characteristic (ROC) area under the curves (AUC) to study the ability of miR-590-3p to distinguish between the EOC patients and healthy females. Linear regression analysis was used to analyze the correlation between miR-590-3p levels and the levels of the potential down-stream target genes. ImageJ software (http://www.imagej.nih.gov/ij) was used for densitometric analysis to analyze the results of the semi-quantitative PCR and the western blot and for normalization to the endogenous control. Data are presented as mean ± standard Deviation (SD). For statistical comparisons, the The Mann–Whitney test was carried out. A probability value (P-value) <0.05 was considered to indicate statistical significance. One-way ANOVA (with Bonferroni post-test) was carried out to analyze the difference between multiple experimental groups with a single variable. Statistical analyses were performed using GraphPad Prism 6 statistical packages.
!
CHAPTER 3
Results
3.1 Clinico-pathologic CharacteristicsThe blood samples were collected from 13 patients prior to surgery, four patients at early stage (stage I/II) and nine patients at advanced stage (stage III/IV) (Table 2). Six blood samples were collected from healthy females with no history of cancer and one obtained from a patient with benign ovarian tumor. The EOC tissue samples were collected from 20 patients. The clinical characteristics of the patients are summarized in Table 2 and 5. The clinical stage distribution among the enrolled patients for tissue sampling is six patients (30%) at stage-I, one patient (5%) at stage-II, ten patients (50%) at stage-III and three patients (15%) at stage-IV. We examined the histological grade of the EOC tissues. Eleven samples (55%) were characterized as well differentiated grade-I, five (25%) as moderately differentiated grade-II and four (20%) EOC samples as poorly differentiated grade-III (Figure 4). Different histological subtypes of EOC were involved including serous EOC, which represents 18 cases, and also endometrioid and mucinous EOC were included. The mean age of EOC patients is 51 (age range 30-65) years. The control ovarian tissues were collected from 6 healthy controls with no history of cancer from hysterectomy surgeries, and one patient with benign ovarian tumor, with mean age of 55 years (age range 50-63).
Table 5: Clinical characteristics of EOC patients in the study. Sample ID FIGO Stage Histological Grade CA 125 (U/ml) Pre-operative chemotherapeutic treatment Metastasis at diagnosis
C1 III C Grade-I 430 Treated Metastasis to lymph
C2 IIB Grade-III 220 Treated N
o M
etastasis
C3 III C Grade-I >600 Not Treated
C4 IB Grade-I 470 Not Treated
C6 IB Grade-III >600 Treated No M
eta
sta
sis
C7 1B Grade-I 6.15 Not Treated
C8 IV Grade-III 7 Not Treated
C9 IB Grade-I 10 Not Treated Metastasis No
C10 IV Grade-III 533 Treated Metastasis to lymph
C11 IIIC Grade-II 97 Treated
N
o
Metastasis
C12 IB Grade-I 79 Treated
C13 IB Grade-I 48 Not Treated
C14 IIIC Grade-II >600 Treated Metastasis
C15 IV Grade-II >600 Not Treated
N
o M
eta
sta
sis
C16 IIIC Grade-I 90 Not Treated
C17 IIIC Grade-II 70 Not Treated
C18 IIIC Grade-II 110 Not Treated
C19 IIIC Grade-I >600 Not Treated
C20 IIIC Grade-I >600 Not Treated
CS*-1 IIIC Grade-III >600 Treated Metastasis
CS-2 IB Grade-I >600 Not Treated No Metastasis
*!Cancer!serum!(Serum!specimens!only)!!!!!!!!!!
Table 6: The levels of tissue CRP in different stages of EOC
FIGO Stage! Tissue CRP mRNA Levels! EOC$Samples$
IB$ Absent!! A! Low! C6,!C7,!C9,!C4! High! C12,!C13! IIB$ Absent!! A! Low! C2! High! A! IIIC$ Absent!! C20! Low! C5,!C14,!C16,!C19!
IV$ Absent!! A!
Low! C8!
High! C10,!C15!
!
Table 7: The levels of tissue PAX2 in different histological grades.
Histological Grade$ Tissue PAX2 mRNA Levels$ EOC$Samples$
Grade2I$ Absent!! C3,!C7,!C9,!C12,!C13,!C16,!C20! Low! C4,!C19! High! C1,!C5! Grade2II$ Absent!! C11,!C14,!C15,!C17,!C18! Low! A! High! A! Grade2III$ Absent!! C2,!C6,!C8,!C10! Low! A! High! ! A! ! !
Figure 4: Histological grade of EOC samples. The figure shows representative samples from each histological grade A) A well-differentiated grade-I sample with uniform, small, and round to oval nuclei. B) The grade-II sample was characterized by uniform nuclei that are larger than that of the low-grade but smaller than the high-grade nuclei. C)
The high-grade nuclei are larger with greater pleomorphism and increased nuclear-to-cytoplasmic ratio. The insets at higher magnification highlight the nuclear features at different grades (indicated by an arrow). (Hematoxylin and Eosin stains).
3.2 Histo-pathological characterization at the molecular level
Intra-tumoral heterogeneity of cellular phenotypes is a challenging factor in the assessment of the histo-pathological characters of the tumor and correlating the levels of biomarkers to the tumor features. The heterogeneity of cellular phenotype within the tumor mainly stems from the gradient level of differentiation within neoplasms, the different levels of interactions between tumor cells via intercellular vesicles (exosomes), and the effect of the microenvironment on the tumor cells (Fidler & Hart, 1982). To perform a reliable correlation between miR-590-3p levels and the tumor characteristics, we analyzed the histo-pathological features at the molecular level via examining the mRNA steady-state levels of molecular biomarkers using RT-PCR. So that, the same aliquot is being examined for the levels of biomarkers related to the histo-pathological status of the tumor, as well as the levels of miR-590-3p. We examined the expression of various acknowledged biomarkers including CA125/Mucin16 which is being used for EOC screening (Høgdall et al., 2007) and C-reactive protein (CRP) which expression was correlated with the stage of the disease, as higher expression of CRP was associated with late stages of EOC (Hefler-Frischmuth et al., 2009). And, paired homeobox 2 (PAX2) gene expression, which was found to show different expression levels in low-grade versus high grade EOC, was used as a marker for the EOC grade (Tung et al., 2009). The average CA125/Mucin16 blood level of the cases in the study is ≈ 290 U/ml (n=20). 85% of patients exhibited high CA125/Mucin16 blood levels (above the normal threshold 35U/ml), whereas the other 15% of patients (C7, C8 & C9) had normal levels of blood CA125/Mucin16, despite being diagnosed with OVCA (Table 5). At the level of tissue expression, the tissue mRNA steady-state levels of CA125/Mucin16 were elevated in about 70% of the EOC tissue samples. Its levels were low in six EOC samples including four samples from patients subjected to platinum-based combination chemotherapy (C1, C2, C6, C10) (Figure 5). As expected the tissue mRNA steady-state level of CRP were associated with the clinical stages of EOC. Higher levels of CRP were observed at
samples (C12&C13) that showed high levels of CRP (Table 6) (Figure 6). In agreement with what has been reported in the literature (Tung et al., 2009), high PAX2 tissue mRNA levels were observed in the majority of low-grade EOC (C1, C4, C5 and C19) and PAX2 expression was completely diminished in high-grade EOC (C2, C6, C8, C10, C11, C14, C15, C17, and C18) (Table 7) (Figure 7). The abolished PAX2 expression in the ovarian mucinous carcinoma (C7) is in accord with previous studies that detected PAX2 expression in ovarian serous and endometrioid carcinoma, but not in the ovarian mucinous carcinoma (Schaner et al., 2003; Wang et al., 2015).
!
Figure 5: RT-PCR analysis of tissue CA125/Mucin16 shows elevated levels in EOC relative to control tissues (P=0.0001). The intensities of the semi-quantitative PCR bands were normalized to the endogenous control GAPDH using ImageJ. N1 –N6 represent healthy ovarian tissues, B1 is benign tumor and C1-C20 represent EOC samples. (***P<0.0005) Normal(n=7) EOC(n=20) 0 5 10 15 20 Tis s ue M uc in-1 6 N or m a liz e d m R N A Le v e ls
***
P value 0.0001
A
! Figure 6: Higher levels of CRP were associated with advanced stages of EOC. The early-stage EOC samples are C2, C4, C6, C7, C9, C12, and C13. However, C1, C3, C5, C8, C10, C11, C14, C15, C16, C17, C18, C19 and C20 are late-stage EOC. The intensities of the semi-quantitative PCR bands were normalized to the endogenous control GAPDH using ImageJ. N1 –N6 represent healthy ovarian tissues, B1 is benign tumor and C1-C20 represent EOC samples.
Normal Ovarian Tissues
EOC tissues
Stage I and II (n=7) EOC tissues Stage III and IV(n=13) 0 2 4 6 8 10 CRP L e v e ls
! Figure 7: The level of PAX2 mRNA in EOC samples is a marker for EOC histological grade. The histological low-grade EOC samples are C1, C3, C4, C5, C7, C9, C12, C13, C16, C19 and C20. The histological higher-grade (grade-II/III) samples are C2, C6, C8, C10, C11, C14, C15, C17, and C18. PAX2 expression was completely diminished in high-grade EOC.
3.3 Upregulation of serum miR-590-3p in EOC patients
We examined the expression levels of miR-590-3p in the serum of 13 EOC patients, and 7 controls using qRT-PCR. The levels of miR-590-3p in the serum of EOC patients (84.6%) were significantly higher than that of the healthy controls (P=0.04) (Figure 8). Interestingly, the levels of miR-590-3p in C9 that showed normal level of pre-operative blood CA125/Mucin16 (below 35U/ml) was significantly elevated compared to healthy controls. We analyzed the correlation between miR-590-3p serum levels and the clinico-pathological features of EOC. The patients were categorized into two groups according to the stage, the early-stage group (stage I/II, n=4) and late-stage group (stage III/IV, n=9), and two groups according to the tumor differentiation grade, group of histological grade-I (n=6) and group of histological grade-II/III (n=7). We found that there was no significant difference in the serum miR-590-3p levels between the different stages (Figure 9A).
Likewise, no significant difference was observed among the patients with different tumor differentiation grade (Figure 9B). Also, receiving pre-operative chemotherapeutic treatment didn’t affect serum miR-590-3p levels (Figure 9C). Additionally, there was no significant correlation between serum miR-590-3p and metastasis (Figure 9D). It is worth noting that we were limited to the small sample size of metastasis cases (n=3).
!
Figure 8: miR-590-3p is significantly elevated in EOC patients' serum. Box plot represents serum miR-590-3p expression levels in controls and EOC patients. The level of serum miR-590-3p was normalized to the synthetic C. elegans Cel_miR-39 Spike-in control. The upper and lower borders of the boxes indicate the 75th and 25th percentiles, respectively. The whisker caps indicate the 90th and 10th percentiles. The horizontal lines in the boxes indicate the median values. P-value was depicted using the Mann– Whitney U-test. The relative levels of miR-590-3p are presented as log transformed log10 (2-ΔΔCT) of the relative levels of miR-590-3p. (* P<0.05)
Normal
(n
=7
)
EO
C
(n
=1
3)
-2 0 2 4Serum miR-590-3P
Level
log10 (2
-ΔΔ CT)
*
!
Figure 9: The correlation between serum miR-590-3p levels and EOC clinico-pathological features. (A) Serum miR-590-3p did not significantly differ among EOC patients with different clinical stages, (B) or in EOC patients with different histological grades. (C) Serum miR-590-3p levels were not affected by pre-operative chemotherapeutic treatment, (D) and showed no significant correlation with the existence of metastasis. The upper and lower borders of the boxes indicate the 75th and 25th percentiles, respectively. The whisker caps indicate the 90th and 10th percentiles. The horizontal lines in the boxes indicate the median values. One-way ANOVA (with Bonferroni post-test) was carried out to analyze the statistical significance. (P>0.05)
3.4 Serum miR-590-3p level is a promising diagnostic marker for epithelial ovarian cancer
We performed the Receiver–operator characteristic (ROC) curve analysis to study the specificity and sensitivity of circulating miR-590-3p to assess its ability to distinguish between EOC patients and healthy females. When comparing between serum miR-590-3p levels in EOC patients and healthy controls, the area under the ROC curve (AUC) was 0.76 with 95% confidence interval (CI) of 0.54–0.97 and P-value= 0.05 (Figure 10). Serum miR-590-3p optimal cut-off value of 2.4 for the 2-ΔΔCT had 76.92% sensitivity and 71.4% specificity (95%CI=46.19% to 94.96%). We examined the diagnostic ability of serum miR-590-3p for stage-I ovarian cancer patients (n=4) versus healthy controls (n=7) and the best cutoff value at 4.4 of the 2-ΔΔCT showed 75% sensitivity and 85.71% specificity (95%CI=42.13% to 99.64%). The best cutoff value for stage-III/IV patients (n=9) versus healthy controls (n=7) was 2-ΔΔCT of 2.4 with 77.78% sensitivity and 71.43% specificity (95%CI=40% to 97.1%). On the other hand, as expected from the above results, circulating miR-590-3p could not be used to distinguish between EOC patients with different clinical stage or tumor differentiation grade. Therefore, our results suggest that circulating miR-590-3p is a promising biomarker for diagnosis of early-stage EOC.
! Figure 10: Receiver-operator characteristics (ROC) curve analyses of circulating miR-590-3p for EOC patients versus healthy controls. Circulating miR-590-3p yielded AUC of 76% (P-value= 0.05) with 76.92% sensitivity and 71.4% specificity at its optimal cutoff value.
0 50 100 0 50 100 100% - Specificity% Se n s iti v ity %
miR-590-3p
(AUC=
0.76)
3.5 Upregulation of miR-590-3p in EOC tissues
To study whether the level of serum miR-590-3p corresponds to its expression in EOC tissues, we examined the levels of miR-590-3p in 20 EOC tissues, as well as six healthy ovarian tissues and one benign ovarian tumor using qRT-PCR. And the level of miR-590-3p was normalized to U6 snRNA. The expression levels of miR-590-miR-590-3p were significantly elevated in 75% of EOC tissues compared to the benign tumor and the healthy ovarian tissues (P<0.05, Figure 11A). Among the 20 EOC samples, 15 samples showed elevated miR-590-3p. The level of miR-590-3p was significantly elevated in high-grade poorly differentiated EOC (grade II/III) (Figure 11B). Whereas four out of the five EOC with low miR-590-3p levels are low-grade well-differentiated EOC. There was no significant correlation between tissue miR-590-3p levels and stage, preoperative chemotherapeutic treatment or existence of metastasis (Figure 11 C, D & E). We did not study the correlation of miR-590-3p levels with progression-free interval or survival due to the recent diagnosis of the disease among the enrolled participants.
!
!
Figure 11: MiR-590-3p expression in EOC tissues. A) MiR-590-3p is significantly elevated in EOC tissues compared to controls. B) Significant correlation of tissue
miR-among C) different stage, D) existence of metastasis or E) pre-operative chemotherapeutic treatment. The relative levels of miR-590-3p are presented as log transformed log10 (2-ΔΔCT). The upper and lower borders of the boxes indicate the 75th and 25th percentiles, respectively. The whisker caps indicate the 90th and 10th percentiles. The horizontal lines in the boxes indicate the median values. (*P<0.05, **P<0.005)
3.6 The correlation between miR-590-3p levels and epithelial–mesenchymal transition (EMT) in EOC
We were limited by the small size of metastatic samples (n=3), to effectively study the correlation between miR-590-3p and metastasis. Nonetheless, the above finding (Figure 11B) that reveals the correlation between tissue miR-590-3p and poorly differentiated EOC triggered us to further study the role of miR-590-3p in EOC tumorigenesis. We studied the correlation between miR-590-3p levels and EMT in EOC by examining the mRNA steady-state levels of EMT- related markers (the epithelial marker E-cadherin and the mesenchymal marker Vimentin) in EOC and control tissues. We divided the EOC tissue samples into two groups, a high miR-590-3p group and low miR-590-3p group. The group with high miR-590-3p indicates miR-590-3p levels more than two folds of that of the control and the remaining samples were categorized in the low-miR-590-3p group. We observed a correlation between the expression of miR-590-3p and the molecular changes of EMT in EOC (Figure 12). As, elevated levels of the mesenchymal marker Vimentin was observed in the EOC samples with high miR-590-3p levels indicating that miR-590-3p could have a role in EMT in EOC.
!
Figure 12: The mRNA steady state levels of EMT markers in EOC and control ovarian tissues. The epithelial marker E-cadherin and the mesenchyme marker Vimentin mRNA levels were examined using RT-PCR. The band intestines were normalized to the endogenous control GAPDH using ImageJ. The level of the mesenchymal marker Vimentin is elevated in the high miR-590-3p expressing EOC samples relative to the low-miR-590-3p group (C1, C3, C5, C14 and C20).
3.7 Bioinformatics analysis of miR-590-3p potential target genes
MicroRNAs acquire their function via post-transcriptional regulation of their target genes. Therefore, to gain an insight to the function of miR-590-3p, we analyzed the function of its downsteam targets. We performed functional prediction analysis of
miR-EOC w ith Hi gh miR-5 90-3p (n=15) EOC w ith Lo w miR-5 90-3p (n=5) Norm al (n=7) 0 20 40 60
Normalized Expression levels
E-Cadherin Vimentin