Measuring the impact
of ICT use in business
THE CASE OF MANUFACTURING IN THAILAND
Measuring the impact of ICT use in
business: the case of manufacturing in
Thailand
Prepared jointly by the UNCTAD secretariat and the
Thailand National Statistical Office
United Nations
New York and Geneva, 2008Note
Note
UNITED NATIONS PUBLICATION Sales No. E.08.II.D.13 ISBN 978-92-1-112746-1
Acknowledgements
This report was prepared jointly by the UNCTAD secretariat, under the supervision of Susan Teltscher, Chief of the ICT Policy and Analysis Unit, ICT and E-Business Branch, and the Thailand National Statistical Office, under the supervision of Ruamporn Sirirattrakul, Chief of the Economic Statistics Analyzing and Forecasting Group, Statistical Forecasting Bureau. The main contributors were Diana Korka (UNCTAD) and Areerat Kittisomboonsuk (Thai NSO), who have worked closely together through 2007 to prepare the data sets, design the econometric model, carry out the analysis and draft the results. The UNCTAD secretariat greatly acknowledges the making available of statistical microdata by the Thai NSO. The work was carried out under the overall direction of Anh-Nga Tran-Nguyen, Director, the division for Services Infrastructure for Development and Trade Efficiency in UNCTAD and in Thailand under the direction of Jirawan Boonperm, Deputy Secretary General of NSO and Wilas Suwee, Director of the Statistical Forecasting Bureau.
During their internships with UNCTAD, Lidia Villalba contributed to the statistical analysis of the 2005 ICT enterprise survey and Sirirat Kiatichaipaibul made useful inputs to the interpretation of the Thai questionnaire.
Jose Luis Cervera Ferri delivered an econometric modelling training course to the staff of the Thailand NSO as part of the project and in preparation of the ICT data analysis, and provided helpful comments on the econometric analysis.
Useful comments were also received from Ugo Panizza, Marco Fugazza, Marcin Skrzypczyk, Albi Tola, Adam Gross, Oluwatobi Osobukola, Chengetai Masango and staff members of the ICT and E-Business Branch, in particular Angel Gonzalez-Sanz, Dimo Calovski, Scarlett Fondeur-Gill and Cécile Barayre El Shami.
Page
Acknowledgements ... iii
Executive summary ... vii
1. Introduction ... 1
Thailand’s ICT strategy and policy... 1
Background and objectives of the project ... 1
2. Data and statistical methodology... 3
3. Overview of ICT use in business ... 4
General characteristics of the business sector... 5
Use of computers ... 8
Use of Internet and web presence... 11
Barriers to the use of ICT... 18
4. ICT use in manufacturing firms ... 20
Use of computers ... 21
Use of Internet and web presence... 21
ICT use and economic performance ... 21
5. Measuring ICT impact on labour productivity... 23
ICT use and firm labour productivity... 23
Complementary factors explaining the ICT–productivity relationship... 24
Impact of specific ICTs on productivity... 25
ICT investment, soft technologies and total factor productivity gains ... 27
6. Presentation of the model ... 28
7. Results ... 29
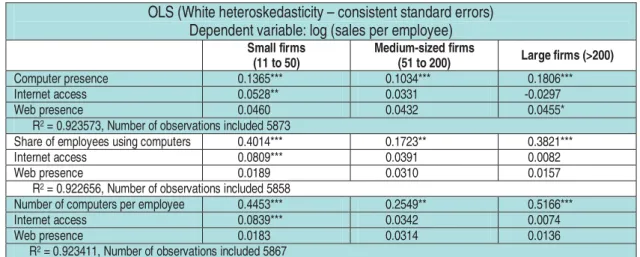
Differences between employment size groups... 31
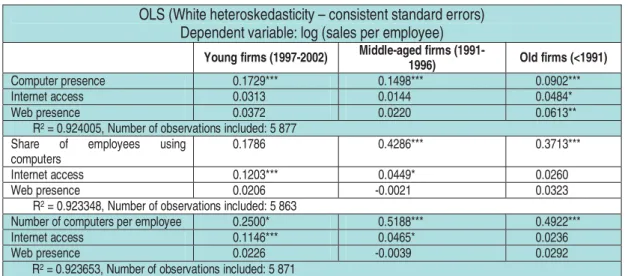
Differences between age groups... 32
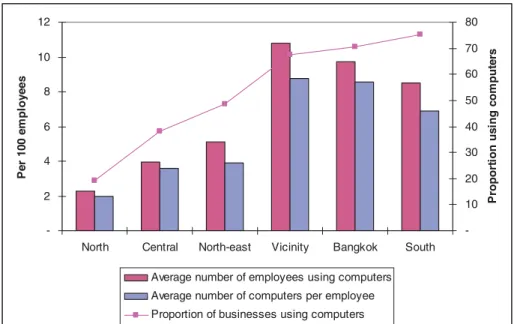
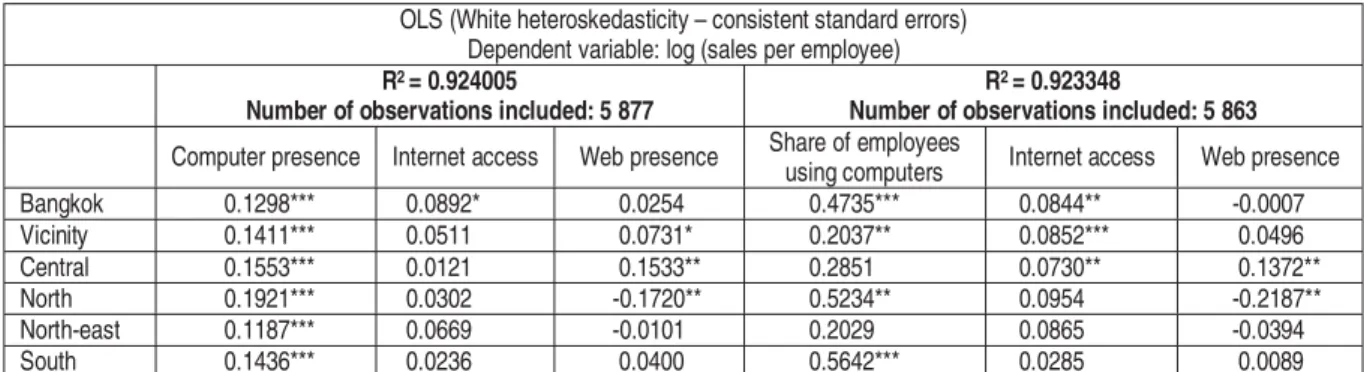
Regional differences... 33
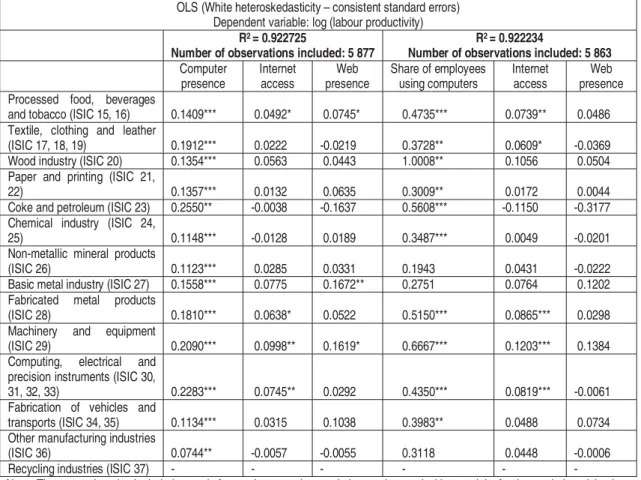
Industry differences ... 35
8. Conclusions and policy recommendations ... 39
Annex 1. Summary of literature on ICTs and productivity at the firm level ... 41
Annex 2. Summary of the variables used in the regression analysis... 43
Annex 3. Correlation coefficients between the regressors used in the analysis... 44
The report is the outcome of a joint project of UNCTAD with the National Statistical Office (NSO) of Thailand which builds upon the measurement of information economy statistics to enable the assessment of the economic impact of information and communication technology (ICT). This is one of the first studies to use official developing-country data to measure the productivity impact of ICT use in business. The project is part of UNCTAD’s capacity-building programme on measuring ICT to help developing countries to improve the production and quality of their ICT statistics at the level of firms through an international “Partnership on Measuring ICT for Development”. These data and the ensuing analysis on measuring the economic impact of ICT use aim to provide policymakers with better tools to design, monitor and evaluate their ICT strategies.
Information and communication technologies have received particular attention in Thailand as enablers of economic and social development. In the context of the national ICT plan, the NSO has collected a large amount of data on ICT use through its annual ICT surveys of the business sector, ICT household surveys and surveys of specific industries such as manufacturing and services.
This report shows a detailed analysis of trends in ICT use by the Thai business sector by looking in particular at the use of computers, the Internet and the web. This is done against the background of a continuous increase in the proportion of businesses using ICTs in Thailand. The study also reviews the specialized literature estimating the productivity impact of ICT use at the firm level in a number of developed countries. It then presents the results of the empirical analysis measuring the impact of ICT use on productivity in manufacturing firms, both at a general level and also by geographical region, industry branch, firm age and size.
The results indicate that the use of basic ICTs such as computers is important to firm productivity, particularly in countries where a significant proportion of businesses are still not using computers. The analysis also finds that, in addition to computer presence, Internet use and web presence are also reflected in higher labour productivity. The study shows that small and newly founded manufacturing businesses, especially the ones located in the north and north-east of the country, should receive more support both in terms of facilitating their access to ICTs and in terms of information campaigns on how ICTs can help to increase productivity, improve the quality of products and better respond to demand. Technical information on how businesses implement ICT solutions can provide additional guidance to set industry-specific ICT strategies.
Thailand’s ICT strategy and policy
For more than a decade, the Government of Thailand has considered information and communication technology (ICT) an important enabler for economic and social development and for enhancing the competitiveness of domestic businesses. The establishment of the National Information Technology Committee in 1992 was one of the first high-level policy initiatives to promote ICT for development. The committee was chaired by the Prime Minister and had members from both the public and private sector (Thuvasethakul and Koanantakool, 2002).
Currently, Thailand’s national ICT policy is based on the ICT Master Plan 2002-2006, which is part of the broader National Information Technology Policy Framework 2001-2010 and the Ninth National Economics and Social Development Plan. Government agencies, representatives of the private sector, civil society and academia participated in the debate leading to the adoption of the ICT Master Plan. Since 2002, the Ministry of ICT has been in charge of pursuing and implementing the objectives and strategies set out in the Master Plan. The Master Plan had the general goal of fostering Thailand’s development through ICT and focused on four main objectives: to increase the country’s economic competitiveness; to develop a knowledge-based society; to foster sustainable development through equitable access for all; and to develop the ICT industry (NECTEC et al., 2003). Currently, the Ministry of ICT is in the process of preparing the second National ICT Master Plan for the next five years (2007-2011). 1
Measuring statistically the access to and use of ICTs has become an important element of the Thai national ICT policy. Producing ICT indicators is considered key to monitoring and assessing progress in the implementation of national ICT plans, to compare ICT developments in Thailand with those in other countries and to help in future policy making (Smutkupt and Pooparadai, 2005). As established in the national ICT plan, the National Statistical Office (NSO) of Thailand is responsible for producing the necessary ICT data, conducting surveys and carrying out relevant analysis. The first ICT household survey dates back to 2001. In its 2003 Manufacturing Industry and Business Services Surveys the NSO included a number of ICT indicators and since 2004, the NSO carries out an annual stand-alone ICT survey with businesses in Thailand’s municipal areas. Background and objectives of the project
The collaboration between UNCTAD and the Government of Thailand on ICT-related matters dates back to 2002, when the Asia-Pacific Regional Conference on “E-commerce Strategies for Development” was held in Bangkok, under the auspices of the Thai Government. Since then, UNCTAD has been cooperating closely with the Government in the area of ICT for development, mainly through NECTEC (National Electronics and Computer Technology Center).
Cooperation on ICT statistics started in 2004, when UNCTAD began its annual data collection on ICT in business and the ICT sector. Since then, UNCTAD has been actively assisting developing countries to improve the production and quality of their ICT data. In the context of the Partnership on Measuring ICT for Development,2 which was launched in 2004 at UNCTAD
XI in Brazil, UNCTAD has developed a capacity-building programme on ICT measurement that
1 Policy Statement by Mr. Kraisorn Pornsutee, head of Thai delegation to the ITU Plenipotentiary
Conference in Turkey, 2006, http://www.itu.int/plenipotentiary/2006/statements/thailand/index.html.
includes the delivery of training, courses and workshops, advisory services to countries and the publishing of a methodological “Manual for the Production of Statistics on the Information Economy”.
Measuring the impact of ICT using firm-level data has received increasing attention recently, particularly by NSOs in OECD countries, which have carried out firm-level analyses on the impact of ICT use on labour productivity using microdata (see section five). Based on the research approach applied in such studies, UNCTAD in collaboration with the Thai NSO carried out a research project to measure the impact of ICT use on labour productivity in Thai manufacturing firms.
The objectives of the project were two-fold:
First, the project aimed to assist the NSO build capacity in the analysis of ICT statistics by applying econometric modelling techniques. To start the project, in January 2007, UNCTAD provided a one-week training in Bangkok to staff of the NSO, on applying econometric techniques to ICT data analysis. This was followed by a period of in-depth data analysis by the UNCTAD ICT Policy and Analysis Unit, in close cooperation with the Economic Statistics Analyzing and Forecasting group of the NSO, during which further technical assistance was provided via long distance. The objective was to allow the NSO staff to replicate the analysis carried out in UNCTAD with a view to enable the NSO to apply similar analytical methods when new data become available.
Second, from a substantive point of view, the project aimed to study the link between ICT use in firms and labour productivity in a developing country setting. While previous studies on the productivity impact of ICT use in firms have been carried out in developed countries, this is one of the first comparable analysis based on official statistics from a developing country.3 Several
recent studies4 highlight the need to study the way in which ICT use by the business sector
translates into greater economic efficiency. Businesses investing in ICTs do not necessarily acquire long-term competitive advantage positions, while those not investing in ICT are almost certain to find themselves at a disadvantage in the market. Ultimately, higher gains from ICT depend increasingly on identifying the efficient ways of using these technologies. Accordingly, the Partnership on Measuring ICT for Development encourages research on estimating the economic impact of ICT, and UNCTAD in particular has engaged in helping developing countries to use micro data for measuring the link between ICT use by businesses and their economic performance.
The report is structured as follows. First there is a short presentation of the main data sources and the methodology used for obtaining ICT statistics. Section three provides an overview of the use by Thai businesses of basic ICTs, such as computers, Internet and the web, comparing data from the 2004, 2005 and 2006 ICT Business Surveys. It also includes qualitative information on factors identified by businesses as barriers to ICT. Section four focuses on ICT use in manufacturing firms, the sector chosen for the productivity analysis. Section five presents the literature review and findings of studies on measuring the impact of ICT on labour productivity, followed by the theoretical framework for this study in section six. A verified empirical model (Cobb-Douglas production function) was used to quantify empirically the relationship between ICT uptake and productivity as well as to identify differences based on geographic location, industry sector, firm size and age in the Thai manufacturing sector. The Report concludes with a detailed presentation of estimation results and with the formulation of policy recommendations in sections seven and eight.
3 For example, the Information for Development Programme (InfoDev) has launched in 2006 a project for
measuring the impact of ICT use in Poland, Russia and the Baltic States (www.insme.info/documenti/InfoDevGlobalNet-web.pdf).
2. Data and statistical methodology
The statistics presented in this report are mainly based on two types of data sources made available by the NSO of Thailand.
The 2004, 2005 and 2006 ICT Business Surveys were used to produce descriptive statistics on ICT use in the Thai business sector. The surveys cover a reference period from April to March. Each of the three survey covers more than 77,000 businesses engaged mainly in manufacturing and services, including business trade services, construction, land transport and activities of travel agencies and hospitals. Only firms located in urban (municipal) areas were covered by these surveys. When information on a given indicator could be traced through the three ICT Business Surveys, the report showed a comparison between results of the 2004 and the 2006 Survey. Where data were not available, the report presents only data from the 2005 and the 2006 surveys. The 2003 Manufacturing Survey was used for carrying out the productivity analysis using econometric techniques. This dataset contains information on more than 8,800 manufacturing businesses located both in urban (municipal) and rural (non-municipal) areas, with reference period January - December 2002. In order to study the relationship between ICT uptake and economic output it was necessary to link ICT and economic variables, which was only possible with data contained in this Survey. The econometric study was therefore limited to the 2002 cross-section of Thai manufacturing firms. In the future, when more data will become available, a more complex analysis can be carried out in order to establish the impact of the past levels of ICT use on current economic performance.
The ICT statistics used in this research were collected by the NSO of Thailand through a stratified sampling method that took into account businesses of different employment5 size,
located in different geographical regions and from different industry branches. This method made it easy to keep track of businesses with different characteristics and of the share of each group within the whole business sector. Thus, all the descriptive statistics presented in this report have been transformed with the help of corresponding sampling weights in order to reflect the entire population of Thai businesses engaged in either services or manufacturing and with more than 10 employees. The comparison between the 2005 ICT Business Survey and the 2003 Manufacturing Survey focusing on manufacturing businesses only, also refers to firms located in urban (municipal) areas.
While both surveys include a large number of micro enterprises (with 10 or less employees), the data and results presented in this study only include firms with more than 10 employees. This approach allowed the study to focus on the performance of small, medium sized and large enterprises, which are producers of most revenues and value added. In Thailand, micro enterprises represent 94 per cent of all establishments in the market, but they have a small contribution to revenue, value added and employment. For example, in the manufacturing sector, firms with more than 10 employees represent only 8 per cent of the firms but account for 77 per cent of the employment, 98 per cent of the revenues and 96 per cent of value added. Similar characteristics can be found in other economies as well6 and therefore usually research is
conducted separately for the two categories of firms. While recognizing that a separate analysis studying the impact of ICT use on micro enterprises can also yield meaningful results for policymakers, this was beyond the scope of the project.
5 Employment figures presented in this report refer to all employees, which include both paid and unpaid
labour.
6 For example 92 per cent of all European enterprises have less than 10 employees and they employ 34 per
cent of the workforce. In the US (2000) as well 94.2 per cent of the firms present in the market are micro enterprises and they provide 21.5 per cent of the jobs (Eurostat, 2003).
3. Overview of ICT use in business
The Thai economy has experienced positive growth since 2001, with increases in both real GDP and real per capita GDP of respectively 5.6 and 4.8 per cent (CAGR) annually.7 In 2005, the
structure of the Thai economy expressed in GDP shares is composed of 43 per cent services, 37 per cent manufacturing and 10 per cent agriculture (World Bank, 2006). According to the Thai 2005 ICT Business Survey, 68 per cent of the business sector is made up of manufacturing, wholesale & retail trade, hotels, restaurants and the food shop industry. After the contraction suffered in connection to the 1997-1998 regional financial crisis, the volume of sales in the manufacturing sector rebounded already in 1999, grew slowly in 2000-2001 and registered record growth rates of 7.5 per cent annually in 2002-2006 (Economist Intelligence Unit, 2007). Strong domestic demand and a competitive position in the export markets have been important factors of growth in Thailand. The main manufacturing products exported are vehicles, electronics, electrical goods and textiles. Output in the electronics sector in particular has recorded 30 per cent annual average growth rate between 2002 and 2006, with two main types of products: integrated circuits and hard disk drives (HDDs). Thanks to the success of foreign investment promotion strategies global producers contribute with a high share to the output in this sector (UNCTAD, 2005). The computer and related service sector, although increasingly important in terms of sales, represented in 2005 only 1 per cent of the total number of firms with more than 10 employees.
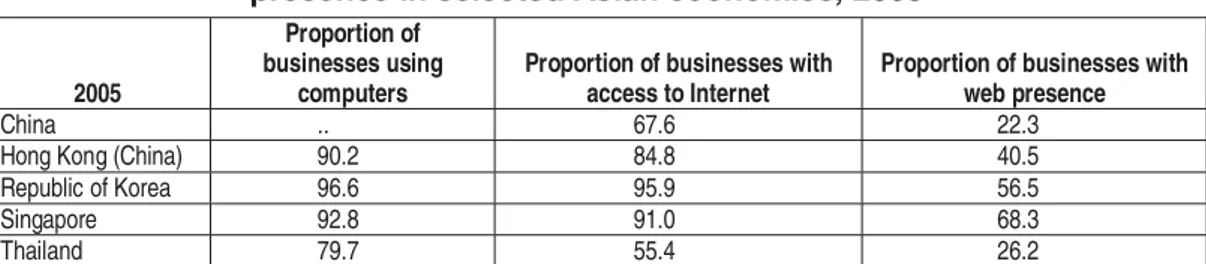
The use of ICT in Thailand has expanded rapidly. According to NECTEC, the Internet started being used in 1987. By 1994, all state universities were on-line, and commercial Internet Service Providers started to operate in 1995 (NECTEC, 2003). Since then, the growth of ICT has been astounding. The 2005 ICT Business Survey revealed that among Thai businesses with more than 10 employees, 79.7 per cent use computers, 55.4 per cent have access to the Internet and 26.2 per cent have web presence (table 1).
Despite significant progress over the past years, ICT adoption in Thailand is still behind levels achieved in some Asian economies with higher per capita income, such as the Republic of Korea, Singapore and Hong Kong (China). In fact, as shown in table 1, 90.2 to 96.6 per cent of the enterprises in the three above mentioned economies were using computers and 84.4 to 95.9 per cent had access to Internet in 2005. Similar to these economies, Thailand has carried out efforts to produce and disseminate on a regular basis statistics on the use of ICT by businesses. This is indicative of the relevance placed by Thailand on the implementation and monitoring of ICT policies.
Table 1. Proportion of businesses with computers, Internet and web presence in selected Asian economies, 2005
2005
Proportion of businesses using
computers
Proportion of businesses with access to Internet
Proportion of businesses with web presence
China .. 67.6 22.3
Hong Kong (China) 90.2 84.8 40.5
Republic of Korea 96.6 95.9 56.5
Singapore 92.8 91.0 68.3
Thailand 79.7 55.4 26.2
Note: Economies selected based on the availability of official statistics.
Source: UNCTAD information economy database, 2007, and the 2005 ICT Business Survey, businesses with more than 10 employees.
This section presents detailed information on the use of basic ICTs such as computers, the Internet and the web by Thai businesses. It draws mainly on data from the 2004, 2005 and 2006 ICT Business Surveys and covers only municipal (urban) enterprises with more than 10 employees, engaged in manufacturing and services activities.
Over the analysed period of time, the proportion of businesses with computers, access to Internet and web presence has increased slowly (chart 1). Improvements in the quality and price of Internet connections resulted in a considerably faster rise in the proportion of businesses with access to Internet than in the case of the other two technologies. The slightly smaller proportion of businesses with web presence in 2006 as compared to 2005 is related to a decline of 3 per cent in the number of large businesses with more than 200 employees present in the Thai market. The proportion of businesses with computers grew continuously over the three years by 1 per cent annually, thus increasing in three years by 3,346 the number of businesses with computers. The highest growth rate is found in the proportion of businesses with access to Internet.
Chart 1. Proportion of businesses with computers, Internet and web presence in Thailand, 2004-2006 0 10 20 30 40 50 60 70 80 90 Pe r c e n t
Proportion of businesses w ith computers 79.3 79.7 81.4
Proportion of businesses w ith access to Internet
46.8 55.4 55.9
Proportion of businesses w ith w eb presence
23.0 26.2 25.7
2004 2005 2006
Source: 2004, 2005 and 2006 ICT Business Survey in Thailand, businesses with more than 10 employees.
General characteristics of the business sector
Small companies (11 to 50 employees) make up for the lion’s share of the Thai market (chart 2), whereas middle-sized and larger firms represent the remaining one fifth of the businesses. From 2004 to 2006, the number of businesses in Thailand grew moderately from approximately 52,000 to 54,000. 2005 witnessed a significant pick up in the number of medium and large businesses with more than 50 employees. This tendency was reversed in the next year with a 4 per cent growth in the number of small businesses and a 3 per cent drop in that of large firms.
Chart 2. Thai businesses by size, 2004-2006
2004 83% 13% 4% 11 to 50 51 to 200 larger than 200 2006 81% 14% 5% 11 to 50 51 to 200 larger than 200
Source: 2004 and 2006 ICT Business Survey in Thailand, businesses with more than 10 employees.
Most enterprises are located in and around the capital region (chart 3). About three quarters of all municipal (urban) businesses are located in Bangkok, its vicinity and the Central region. These regions also have the highest concentration of large and middle-sized enterprises. Whereas 73 per cent of small enterprises are located in Bangkok, its vicinity and the Central region, this was the case for 77 per cent of the medium enterprises and 83 per cent of the large enterprises. Such concentration around the main municipal area is common in many economies and goes hand in hand with the advantages of operating in the main conglomerate. Conglomerates provide enterprises the possibility to benefit from, for example, cheaper and quicker diffusion of technology and from access to a greater number of consumers and potential employees. From 2004 to 2006, Bangkok’s vicinity and the Central region showed the greatest increase in the number of businesses, particularly the large ones. The share of middle and large enterprises also increased in the northern, north-Eastern and Southern region over the same period of time, confirming a slight tendency towards a less geographically concentrated business sector.
Chart 3. Thai businesses by geographical region, 2004-2006
Sm all businesses (11-50 em ployees)
0 5 000 10 000 15 000 20 000 25 000 Bangkok
Bangkok vicinity & Central region Northern region North-eastern
region Southern region
2006 2004
Medium businesses (51-200 employees)
0 1 000 2 000 3 000 4 000
Bangkok Bangkok vicinity & Central region Northern region North-eastern
region Southern region
2006 2004
Large businesses (m ore than 200 em ployees)
0 200 400 600 800 1 000 1 200 Bangkok
Bangkok vicinity & Central region Northern region North-eastern
region Southern region
There are four industries, which combined account for more than two thirds of the total number of businesses in Thailand8: manufacturing (29 per cent), retail trade (16 per cent), hotels and
restaurants including food shops (12 per cent), and wholesale and commission trade (11 per cent). Industries differ in terms of average employment size of enterprises. There are many more large firms (more than 200 employees) in manufacturing and hospital activities, whereas in retail trade, wholesale and commission trade, hotels and restaurants small businesses are more dominant (chart 4).
There has been little variation in the number of businesses by main activity over the three years considered. The number of small businesses in wholesale trade, commission trade and retail trade has dropped, along with that of large businesses in the real estate and recreational service sectors. The manufacturing sector has seen an increase in the number of large enterprises over the three years. The concentration of large firms in specialized sectors of activity remained the same over time unlike shown before in the case of the geographical concentration.
Besides employment size, there are also differences regarding employment by gender. Generally, the representation of female and male workers in services and manufacturing is balanced, with a ratio of 11 women to 10 men. As in other economies, female participation is larger in hospital activities (70 per cent) and considerably lower in sectors like construction (6 per cent).
Chart 4. Thai businesses by industry and size, 2004-2006
8 The agricultural sector has not been taken into account in the Survey.
Small businesses (11-50 employees)
0 2 000 4 000 6 000 8 000 10 000 12 000 Manufacturing
Retail trade Hotels and restaurants, including food shops Sale, maintenance and repair of motor
vehicles and motorcycles etc. Wholesale trade and commission trade Renting of machinery and equipment etc. Construction Recreational and other service activities Other land transport and activities of travel
agents Real estate Computer and related activities Hospital activities
Medium businesses (51-200 employees)
0 500 1 000 1 500 2 000 2 500 3 000 3 500 Manufacturing
Retail trade Hotels and restaurants, including food shops Sale, maintenance and repair of motor vehicles and motorcycles etc. Wholesale trade and commission trade Renting of machinery and equipment etc. Construction Recreational and other service activities Other land transport and activities of travel
agents
Real estate Computer and related activities Hospital activities
Chart 4. Thai businesses by industry and size, 2004-2006 (continued)
Note: No data available for hospital activities in the 2004 Survey.
Source: 2004 and 2006 ICT Business Survey in Thailand, businesses with more than 10 employees.
Based on the 2005 Survey, 9 per cent of the businesses have some level of foreign ownership, which - as shown later - is a factor linked to higher labour productivity. Foreign ownership also varies with the type of industry. Whereas hospital activities, recreational and other services firms are mainly based on domestic capital, the computer and the wholesale and commission trade sectors have a higher share of foreign capital, in 18 per cent and 12 per cent of the businesses respectively.
The following section presents detailed information on ICT use in the Thai business sector with respect to computer and Internet use, and web presence. When the data was available the results of the 2004 and 2006 ICT Business Surveys are compared.
Use of computers
Computers are an important pre-requisite for the development of the information economy. Only 1 per cent of the Thai businesses with access to Internet used computers located elsewhere than on their premises and all enterprises with web presence disposed of at least one computer. 9
The fact that mobile phone operators rely heavily on the GSM technology might explain the very low proportion of businesses accessing Internet from mobile phones (Economist Intelligence Unit, 2007). High speed Internet access through mobile technology may become available as soon as the National Telecommunications Commission starts issuing licences for more advanced third generation mobile telephony services. Results of the ICT Business Surveys indicate that only a very small number of businesses, mostly microenterprises, use Internet cafés or telecentre services. As long as alternative technology is not developed, computers will remain key for the use of Internet and for web presence in the business sector.
The 2006 ICT Business Survey shows that 81.4 per cent of the Thai businesses have at least one computer and each of those businesses has on average 14 computers available and 16 employees
9 Based on the 2005 ICT Business Survey.
Large businesses (more than 200 e mployees )
0 200 400 600 800 1 000 1 200 1 400 1 600
Manufacturing Retail trade Hotels and restaurants, including f ood
shops Sale, maintenance and repair of motor
vehicles and motorcycles etc. Wholesale trade and commission trade Renting of machinery and equipment etc. Construction Recreational and other service activities Other land transport and activities of
travel agents Real estate Computer and related activities Hospital activities
using computers regularly. In other words, on average, there are more employees using computers than available computers. This suggests that Thai businesses have, to a certain extent, valuable human resources (i.e. computer literate staff) that would allow them to increase the use of computers. Evidence from developed countries such as Japan (2001)10 shows that there are on
average more than one computer per employee in the business sector.
Larger firms have more computers and more staff members using computers regularly in their work (chart 5). For example, a firm with 11-50 employees has on average five computers, whereas a firm with 501-1000 employees has on average 101 computers. In large firms with more than 1,000 employees the number of staff members using computers was almost double the size of the number of available computers in 2004. In 2006 the gap between the two use indicators has been reduced to some extent. More recently, businesses, in particular the large ones allocate resources more evenly between computers and the human resources who use them frequently. Not only have large businesses more computer resources but also there is a large difference in the proportion of businesses using computers between the different size categories. All businesses with over 500 employees have at least one computer, while in smaller firms of 11 to 15 employees, this is the case for only three quarters (chart 8).
Chart 5. Average number of computers per business with computers, 2004-2006
Source: 2004 and 2006 ICT Business Survey in Thailand, businesses with more than 10 employees.
The 2006 ICT Survey estimated that the business sector uses approximately 574,000 computers, almost 50 per cent up from the results of the 2004 Survey. Similarly, the number of employees using computers regularly in their work also increased by 43 per cent, now reaching 700,000. By industry, the two sectors with the biggest share of middle-sized and larger firms - manufacturing and hospitals - account for approximately half of the number of computers and computer-using employees (chart 6). From 2005 to 2006, manufacturing businesses accounted for a slightly smaller share in the total number of computers and computer-using employees, while other sectors such as hospitals, wholesale and retail trade, and hotels and restaurants increased their share.
Sharing computers among several users is easier in certain types of businesses. Computers used by more than one employee (multi-user computers) are more frequent in hospital activities and the manufacturing sector. From the 2004 to the 2006 Survey, the number of multi-user computers also increased by more than 50 per cent, to reach 48,000 units.
10 Ministry of Economy, Trade and Industry, Survey on ICT Workplaces 2001.
2004 5 13 22 49 95 224 5 14 22 49 97 477 0 100 200 300 400 500 11 to 50 employees 51 to 100 employees 101 to 200 employees 201 to 500 employees 501 to 1000 employees More than 1000 employees Average number of computers per business w ith computers
Average number of employees using computers per business w ith computers
2006 5 17 32 101 338 6 17 33 127 470 66 64 0 100 200 300 400 500 11 to 50 employees 51 to 100 employees 101 to 200 employees 201 to 500 employees 501 to 1000 employees More than 1000 employees Average number of computers per business w ith computers
Source: 2005 and 2006 ICT Business Survey in Thailand, businesses with more than 10 employees.
Chart 6. Share of computers, number of employees using computers and number of multi-user computers by industry, 2005-2006
Industry share of businesses with computers
0 10 20 30 40 50 Manufacturing
Hospital activities Retail trade Wholesale trade and commission
trade Renting of machinery and
equipment etc. Sale, maintenance and repair of motor vehicles and motorcycles Hotels and restaurants, including
food shops Construction Other land transport and activities
of travel agents Real estate Recreational and other service
activities Computer and related activities
Per cent
Industry share of businesses with employees using computers
0 5 10 15 20 25 30 35 Manufacturing
Hospital activities Retail trade Wholesale trade and commission
trade Renting of machinery and
equipment etc. Sale, maintenance and repair of motor vehicles and motorcycles Hotels and restaurants, including
food shops Construction Other land transport and activities
of travel agents Real estate Recreational and other service
activities Computer and related activities
Per cent
If looking at the relative use of computers (chart 7), the computer and related activities together with the real estate and the wholesale trade and commission trade industry have the largest share of computers per employee, indicating a higher intensity of computer use in these industries.
Industry share of businesses with multi-user computers
0 5 10 15 20 25 Manufacturing
Hospital activities Retail trade Wholesale trade and commission
trade Renting of machinery and equipment
etc. Sale, maintenance and repair of motor vehicles and motorcycles etc.
Hotels and restaurants, including food shops
Construction Other land transport and activities of
travel agents Real estate Recreational and other service
activities Computer and related activities
Per cent
2005 2006
Chart 7. Intensity of computer use by industry, 2005
0.0 0.1 0.2 0.3 0.4 0.5 0.6 0.7 0.8 0.9
Hotels and restaurants, including food shop Manufacturing Renting of machinery and equipment without operator, research and development etc.
Construction Recreational and other service activities Sale, maintenance and repair of motor vehicles and
motorcycles etc.
Retail trade Other land transport and activities of travel agencies Hospital Activities Wholesale trade and commission trade Real estate activities Computer and related activities
Number of personal computers per employee Number of multi-user computers per employee
Source: 2005 ICT Business Survey in Thailand, businesses with more than 10 employees.
Use of Internet and web presence
Slightly more than half of the Thai manufacturing and services businesses with more than 10 employees are connected to Internet (55.9 per cent in 2006). Business size matters in terms of Internet access as it does in terms of computer and web presence use. Chart 8 shows how computer, Internet and web presence penetration increases with employment size. Whereas 48 per cent of the small businesses have access to Internet, this is true of 79 per cent and respectively 92 per cent of the medium and large businesses.
As shown before, in an overwhelming majority of cases (99 per cent), businesses access the Internet from computers located on their premises rather than in Internet cafés or telecentres. Only 385 businesses access Internet from outside their premises, despite the fact that more than 10,000 firms do not have computers and 23,530 do not have in-house Internet access. The lack of computers, in small firms in particular, goes hand in hand with the lack of Internet access for business purposes. For example all the large firms with more than 500 employees have computers and only 3 per cent of them do not have Internet access. On the other hand, among small firms with 11 to 15 employees only three quarters have computers, corresponding to 60 per cent with no Internet access (chart 8). A positive development from 2004 to 2006 has been the spectacular growth of around 10 per cent in the proportion of small and middle-sized businesses (11 to 100 employees) with access to Internet. The increase is mainly due to small firms with computers deciding to connect to the Internet.
Web presence as compared to Internet access is considerably less widespread in the business sector in Thailand. Little more than a quarter of all businesses have web presence, whether on their own websites or on sites belonging to other legal entities. Often businesses prefer to host their own website (in 89 per cent of the cases) rather than having it hosted by a different agent. Web presence is also more frequent among larger firms. The particularity is that even among the largest establishments with almost full coverage in terms of computers and Internet access more than a third remains without web presence. Whereas only a quarter of the small firms are present on the web, this is true of 42 per cent of the medium and 62 per cent of the large businesses. The proportion of businesses present on the web has grown mostly among those having 26 to 200 employees - by 5 per cent between 2004 and 2006.
Chart 8. Computers, Internet and web presence by size, 2004-2006
Source: 2004 and 2006 ICT Business Survey in Thailand, businesses with more than 10 employees.
In certain economic sectors firms are more prone to using Internet and web applications due to the inherent characteristics of the business (chart 9). For example, in the computer and related services sector almost all businesses use computers and the Internet, and more than 80 per cent have web presence. This confirms findings in other studies (Maliranta and Rouvinen, 2003) whereby the ICT producing sector itself is a more frequent user of ICTs as compared to other branches of the economy. There are three other industry sectors where the use of Internet and web is more than proportional to their use of computers: renting of machinery and equipment, wholesale trade and commission trade, and other land transport and activities of travel agents. There was a sizeable increase in the proportion of businesses with Internet access from 2004 to 2006 in the real estate and the sale, maintenance and repair of motor vehicles sectors. Furthermore, the web penetration rate grew considerably in real estate and computer and related activities.
The recreational service sector ranks last in chart 9, with the lowest proportion of businesses with access to any of the three basic ICTs surveyed. However, over time, ICT usage patterns may change as businesses gain more experience and therefore it is critical to monitor such evolutions. Although having a sizeable weight (32 per cent) in the total number of computers used in business, the manufacturing sector recorded a below average penetration of computers, Internet
Proportion of business es w ith Internet access
0 20 40 60 80 100 11-15 employees 16-20 employees 21-25 employees 26-30 employees 31-50 employees 51-100 employees 101-200 employees 201-500 employees 501-1000 employees More than 1000 employees P e r c e nt 2006 2004
Proportion of busine ss es w ith com pute rs
0 20 40 60 80 100 11-15 employees 16-20 employees 21-25 employees 26-30 employees 31-50 employees 51-100 employees 101-200 employees 201-500 employees 501-1000 employees More than 1000 employees P e r c e nt 2006 2004
Proportion of businesses w ith w eb presence 0 20 40 60 80 100 11-15 employees 16-20 employees 21-25 employees 26-30 employees 31-50 employees 51-100 employees 101-200 employees 201-500 employees 501-1000 employees More than 1000 employees Per cent 2006 2004
Source: 2004 and 2006 ICT Business Survey in Thailand, businesses with more than 10 employees.
and web. In 2006, only 58 per cent of the businesses in the manufacturing sector had access to the Internet and only 25 per cent had web presence, while 78 per cent had at least one computer. Since 2004 there has been a relatively positive evolution in the proportion of manufacturing businesses with computers, Internet access and web presence.
Chart 9. Computers, Internet and web presence by industry, 2004-2006
Results of the 2006 Survey show that there are approximately 14,000 businesses present on the web up from 12,000 in the 2004 survey. Despite the fact that there are fewer businesses with web presence in manufacturing relative to services, the former sector still makes up for more than a quarter of the total population of Thai businesses present on the web, followed by wholesale and retail trade (chart 10). These results are in line with the composition of the Thai business sector by industry affiliation (as shown previously in chart 4).
Proportion of busine sse s w ith w eb prese nce
0 20 40 60 80 100 120 Recreational and other service
activities Hotels and restaurants, including
food shops Manufacturing
Construction Retail trade Other land transport and activities of
travel agents Sale, maintenance and repair of motor vehicles and motorcycles etc.
Wholesale trade and commission trade Renting of machinery and equipment
etc. Real estate Computer and related activities Hospital activities
Per cent
2006 2004
Proportion of businesses w ith com puters
0 20 40 60 80 100 120 Recreational and other service
activities Hotels and restaurants, including
f ood shops Manufacturing
Construction Retail trade Other land transport and activities of
travel agents Sale, maintenance and repair of motor vehicles and motorcycles etc.
Wholesale trade and commission trade Renting of machinery and equipment
etc. Real estate Computer and related activities Hospital activities
Per cent
2006 2004
Proportion of businesses w ith access to Internet
0 20 40 60 80 100 120 Recreational and other service
activities Hotels and restaurants, including
food shops Manufacturing
Construction Retail trade Other land transport and activities of
travel agents Sale, maintenance and repair of motor vehicles and motorcycles etc.
Wholesale trade and commission trade Renting of machinery and equipment
etc. Real estate Computer and related activities Hospital activities
Per cent
Source: 2005 and 2006 ICT Business Survey in Thailand, businesses with more than 10 employees.
Chart 10. Businesses with web presence by industry, 2005-2006
The type of Internet connection plays a crucial role in terms of the quality and speed, which could impact on competitiveness and productivity at the firm level. In Thailand, a polarisation seems to have occurred between two groups of firms: a large share of 46 per cent use slower dial-up connections and a fast growing but lower share of 33 per cent use faster DSL connections. Wireless connections remain exceptional, used in only 4 per cent of all businesses (chart 11). Internet broadband connectivity is gaining importance worldwide and has been singled out by the specialized literature as it can increase the capacity of enterprises to deliver through the Internet by providing connectivity with higher capacity and speed. In Thailand broadband access almost doubled from 2004 to 2006, to reach 47 per cent, which compares well with the 63 per cent broadband penetration in businesses from the European Union. Exceptional cases in terms of broadband penetration in Asia are the Republic of Korea, where in 2004 92 per cent of enterprises had Internet broadband access, and Singapore, where in 2005 77 per cent of enterprises with more than 10 employees had broadband access (IDA, 2005).
Chart 11. Type of connection to Internet in businesses, 2004-2006
Source: 2004 and 2006 ICT Business Survey in Thailand, businesses with more than 10 employees.
2006 Dial Line 46% Unknown 1% Wireless connection 4% Other fixed connection 1% Other 1% Leased Line 7% Cable Modem 3% DSL 33% ISDN 4% 2006 Narrowband 51% Broadband 47% Other broadband or narrowband 2% 2004 Narrowband 79% Broadband 19% Other broadband or narrowband 2% 2005 Manufacturing 25% Wholesale trade and commission trade 16% Retail trade 15% Computer and related activities 2% Real estate 3% Hospital activities 4% Other land transport
and activities of travel agents 3% Construction 5% Recreational and other service activities 2% Sale, maintenance
and repair of motor vehicles and motorcycles etc. 7% Renting of machinery and equipment etc. 8% Hotels and restaurants, including food shops
10% 2006 Wholesale trade and commission trade 16% Retail trade 13% Manufacturing 27% Hotels and restaurants, including food shops 10% Renting of machinery and equipment etc. 7% Sale, maintenance and repair of motor vehicles and motorcycles etc. 7% Recreational and other service activities 2% Construction 4% Other land transport and activities of travel agents 3% Hospital activities 5% Real estate 4% Computer and related activities 2%
The type of Internet connectivity gives an additional dimension of the digital divide between the different economic groups within the country. A large majority of small and medium-sized enterprises prefer narrowband connections such as dial-up and ISDN (chart 12). In comparison, a bigger proportion of the large enterprises used broadband leased lines to connect to the Internet. From 2004 to 2006, there has been an overall shift from dial-up (narrowband) to DSL (broadband) connections. Also, in medium-sized and large enterprises the proportion of businesses using leased lines and wireless technology has increased slightly.
Chart 12. Type of connection to Internet by business size, 2004-2006
More than 200 employees
0 20 40 60 80 Dial line DSL (ADSL, SDSL) Leased lines ISDN Cable modem Other fixed connection Wireless connection Other Unknown
2006 2004
Source: 2005 ICT Business Survey in Thailand, businesses with more than 10 employees.
Since ICTs provide a wide range of advantages for doing business, such as faster and better access to information, reductions in costs and time and improved business operations to name only a few, the ICT Survey also inquired about the motivations for accessing the Internet and for
11 to 50 employees 0 20 40 60 80 Dial line DSL (ADSL, SDSL) Leased lines ISDN Cable modem Other fixed connection Wireless connection Other Unknown 2006 2004 51 to 200 employees 0 20 40 60 80 Dial line DSL (ADSL, SDSL) Leased lines ISDN Cable modem Other fixed connection Wireless connection Other Unknown 2006 2004
establishing web presence. In the questionnaire, enterprise representatives had the option of ticking several reasons for using the Internet or the web. For each response category, the frequency of positive answers indicates the relative importance given by businesses to a specific activity planned or carried out on the Internet or the web.
Results show that businesses access the Internet mainly for information search, which was ticked by 50 per cent of the respondents. Sending and receiving e-mail is the second most popular activity on the Internet (43 per cent), followed by monitoring the market (30 per cent). Although other online activities such as purchasing and selling products online as well as banking and e-finance are growing in importance in developed countries, businesses in Thailand do not consider them yet among the main reasons for using Internet. In fact, only 6 per cent of the respondents indicate that e-banking and e-finance are among the activities planned or already carried out by their firms on the Internet (chart 13). From 2004 to 2006 there has been an increase in the relative importance given by business to the three most popular activities mentioned above (information search, e-mail and monitoring the market). There is scope for improving this part of the questionnaire in order to define the response categories more precisely and avoid imprecision.
Chart 13. Reasons for using the Internet (businesses with Internet access), 2004-2006
Source: 2004 and 2006 ICT Business Survey in Thailand, businesses with more than 10 employees.
The reasons for establishing web presence are different from those for accessing the Internet. Chart 14 shows that firms present on the web indicate that they plan to use it mostly for marketing the products of the business (22 per cent) and as an inquiry and/or contact facility (17 per cent). Those activities would presumably expand the customer base as well as improve the quality of final products. Other reasons such as receiving orders online (4 per cent) or receiving online payments (3 per cent) were only pointed out by a very small share of the businesses present on the web. Over the last surveyed years, there has been a strong increase mainly in the already popular activities performed by businesses on the web, such as marketing the own business and using it as an inquiry/contact facility.
0 10 20 30 40 50
Others Banking and financial services Other communication channel Purchase/ sale of goods and services and communicate with trading partner Advertising of own goods and services Monitoring the market E-mail Information search
Per cent
Chart 14. Reasons for web presence (businesses with web presence), 2004-2006
Source: 2004 and 2006 ICT Business Survey in Thailand, businesses with more than 10 employees.
The Surveys also tracked information on the number of firms that receive orders online (chart 15). On average, only 7 per cent of the businesses received orders online, with some variation among branches of activity between 13 per cent for the computer and related services sector and 1 per cent for the recreational and other activities industry. According to the 2006 ICT Survey the sectors with an above average proportion of businesses receiving orders online belong to the ICT-producing services industry, the retail and wholesale trade industry and hospital activities sector. Regarding the hospital industry, the growth of medical and health tourism activities may explain a relative specialization of businesses in this sector to receive orders online. The slight changes from 2005 to 2006 indicate that businesses from industries less specialized in receiving orders online have started to bridge the gap with businesses in the more specialized industries. The biggest increase is observed for the renting of machinery and equipment sector.
0 5 10 15 20 25
Others Online payment Back office network information such as
warehouse logistics
Providing after sales services Receiving purchased order Inquiry/ contact facility Marketing own products
Per cent 2004 2006
Chart 15. Share of businesses receiving orders online, 2005-2006
Source: 2005 and 2006 ICT Business Survey in Thailand, businesses with more than 10 employees.
Despite the relatively high share of Internet users among Thai businesses, e-commerce11 remains
confined to a small proportion of companies, as seen above in the case of e-selling. The low rate at which businesses adopt e-commerce is due to the lack of confidence in the quality of services delivered, and to concerns regarding the sophistication of web technology, the lack of secure servers and IT skills (NECTEC, 2003).
In order to understand the reasons for engaging in electronic commerce activities, the survey asked the businesses already engaged in such activities why they did it. Again, the survey provided respondents with a set of predefined response categories which they could evaluate as important, very important, not important or unknown. 94 per cent of businesses deemed the use of e-buying as important or very important for speeding up the business process and simplifying transactions. In the case of e-selling, the most important reasons for going online were speeding up the business process and expanding service beyond business hours. Other response categories considered relevant for selling online were: improving the image of the company (89 per cent), reducing business costs (87 per cent), expanding the customer base (87 per cent) and keeping up with the competition (86 per cent). Overall, results show that both buyers and suppliers engage in e-commerce because this provides them with greater efficiency.
Barriers to the use of ICT
Businesses were asked about the main barriers to the use of specific ICTs. Chart 16 presents a summary of the responses to three different questions relating to perceived barriers to using computers, accessing Internet and establishing web presence.
11 Electronic commerce stands for commercial transactions in which the order for a good or service is
made using some form of Internet-based communication. The delivery and payment may be performed off-line in the physical world.
2006 1 2 3 3 4 4 4 8 9 10 12 13 0 2 4 6 8 10 12 14
Recreational and other service activities
Real estate Hotels and restaurants, including food
shops
Other land transport and activities of travel agents Renting of machinery and equipment
etc.
Construction Manufacturing Hospital activities Wholesale trade and commission
trade
Sale, maintenance and repair of motor vehicles and motorcycles etc.
Retail trade Computer and related activities
Pe r cent 2005 1 2 3 4 2 3 5 7 8 11 11 13 0 2 4 6 8 10 12 14
Recreational and other service activities
Real estate Hotels and restaurants, including food
shops
Other land transport and activities of travel agents Renting of machinery and equipment
etc.
Construction Manufacturing Hospital activities Wholesale trade and commission
trade
Sale, maintenance and repair of motor vehicles and motorcycles etc.
Retail trade Computer and related activities
Chart 16. Barriers to the use of computers, Internet and web presence (businesses not using ICTs), 2004-2006
Among businesses that do not currently use any of the technologies captured by the Survey (computers, the Internet or the web), as much as 58 per cent or more do not perceive the use of ICT as appropriate or necessary for their business. This problem is more often raised among firms which do not use computers. From 2004 to 2005 there was a small (1 per cent) drop in the share of businesses considering computers, Internet or the web as unnecessary for their business or as having no perceived benefits.
Two factors should be singled out as important barriers: affordability and the lack of skills and trained staff. High expenditure seems to be a barrier of greater importance in terms of accessing the Internet or establishing web presence as compared to using computers. More ICT-related skills and training are needed in firms without Internet connection and web presence (compared
Barriers to computer use
0 20 40 60
Others Techno lo gy changes to o fast Lack o f skills o r appro priate
training Lack o f perceived benefits
Expenditures to o high Existing perso nal reluctant to
use o r lack o f skill No t appro priate/ unnecessary
business
Per cent
2004 2006
Barriers to the use of Internet
0 20 40 60
No Internet service available in the area Others Security co ncerns (e.g. fraud,
hacking, viruses) Lack o f skills o r appro priate
training Lack o f perceived benefits Existing perso nnel reluctant to
use o r lack o f skill Expenditures to o high No t appro priate/ unnecessary
business
Per cent
2004 2006
Barriers to the use of web presence
0 20 40 60
Others Techno lo gy changes to o fast Lack o f skills o r appro priate
training Lack o f perceived benefits Existing perso nnel reluctant to
use o r lack o f skill Expenditures to o high No t appro priate /unnecessary
business
Per cent
2004 2006
Note: Multiple answers possible.
Source: 2003 Manufacturing Survey and 2005 ICT Business Survey in Thailand, businesses with more than 10 employees.
to using computers). Since the lack of skills has been identified as one of the factors hindering further ICT development, Thailand has included training and education in information technology as a main pillar in its national ICT plan.
Results of the survey also show that Internet security and service failures are not the most important perceived entry barriers for using the Internet. An additional issue of interest may be to investigate if security concerns represent a major difficulty for firms already connected to the Internet.
This section of the report has described the main patterns of computer, Internet and website use by the businesses sector in Thailand. What follows is a closer look at the specific characteristics of ICT use in manufacturing firms, which is the focus group of the impact analysis carried out under this project. The next section is based on a comparison of data from the 2003 Manufacturing Survey (reference year 2002) and the 2005 ICT Survey (reference year 1 April 2004 - 30 March 2005).
4. ICT use in manufacturing firms
Manufacturing firms account for a substantial share of the business sector in Thailand (almost a third), they tend to have a larger than average number of employees per establishment and have moderate users of ICTs. There is a larger concentration of manufacturers in Bangkok, its vicinity and the Central region of the country, while services are considerably less concentrated.
In terms of ICT uptake, the manufacturing sector has a below average penetration of computer, Internet and web presence compared to services. However, due to the considerable size of the sector, manufacturing businesses still account for almost a third of the number of computers and that of computer-using employees in the country.
From 2002 to 2005, there has been a positive evolution in all the available indicators of ICT use in manufacturing. As shown in chart 17, the share of manufacturing businesses using computers has increased by 4 per cent, from 68.2 per cent to 71.9 per cent. Internet penetration has grown most (by 12 per cent), followed by the share of firms with web presence (9 per cent). These figures show a faster evolution of ICT use in 2002-2005 in manufacturing than the current trend experienced by the entire business sector in 2004-2006 (see chart 17).
Chart 17. Computers, Internet and web presence in the manufacturing sector, 2002-2005 0 10 20 30 40 50 60 70 80 Pe r c e n t
Proportion of businesses with computers
68.2 71.9
Proportion of businesses with access to Internet
38.9 50.9
Proportion of businesses with web presence
13.6 22.9
Use of computers
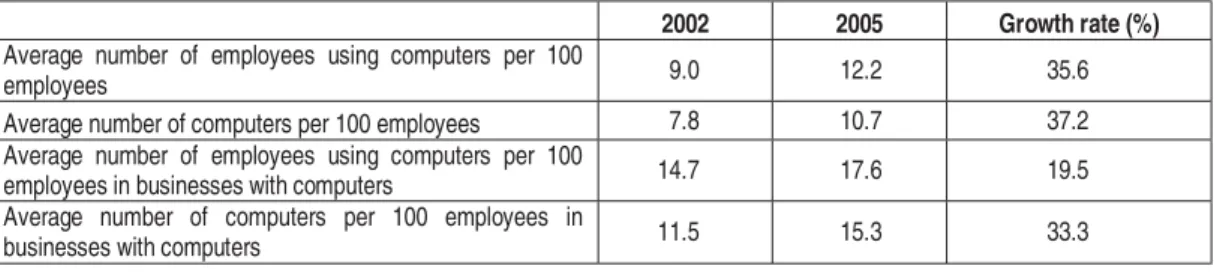
Computer penetration has reached a high level among manufacturing businesses, with 72 per cent using at least one computer in 2005.
A firm with 100 employees has on average 12 employees using computers and 11 computers (table 2). The intensity of computer use has improved during the two years considered, with the number of computer-using employees remaining slightly superior to that of available computers per business unit. However, in manufacturing as well as in the rest of the business sector the number of computers grew faster than the number of employees using computers. Thus figures show that since 2002 businesses invested more in computers and that the new investment has resulted in a reduced ratio of employees per computer. More investment in computers has brought a change in the type of tasks performed with computers, but it is also likely to determine a growing demand for more computer literate employees.
Table 2. Intensity of computer use in the manufacturing sector, 2002-2005
2002 2005 Growth rate (%)
Average number of employees using computers per 100
employees 9.0 12.2 35.6
Average number of computers per 100 employees 7.8 10.7 37.2 Average number of employees using computers per 100
employees in businesses with computers 14.7 17.6 19.5
Average number of computers per 100 employees in
businesses with computers 11.5 15.3 33.3
Source: 2003 Manufacturing Survey and 2005 ICT Business Survey in Thailand, businesses with more than 10 employees.
Use of Internet and web presence
In 2005 just over half (51 per cent) of the manufacturing businesses had access to the Internet, compared to 71 per cent of the firms with computers.
Almost a quarter (23 per cent) of the manufacturing firms had web presence in 2004. This figure corresponded to a 45 per cent proportion of the businesses with computers connected to Internet and suggests that, unlike Internet, web presence is in an earlier stage of adoption. None of the manufacturing businesses was found to have web presence in absence of Internet access and computers on its premises.
The only question on the type of activity carried out over the Internet included in the 2003 Manufacturing Survey relates to e-commerce activities - placing and receiving orders online. Accordingly, in 2002, 7 per cent of the manufacturers (located in urban areas, with more than 10 employees) sold goods and services online. The proportion of manufacturers which placed orders online (i.e. buying over the Internet) was much higher - close to 20 per cent12 in 2002.
ICT use and economic performance
Economic performance is stronger in firms that use ICT and even more so in firms that use a combination of several ICTs. Manufacturers using computers have on average 10 times higher sales per employee than manufacturers without computers (chart 18). The order of magnitude is higher when comparing sales per employee in firms with and without web presence.
In 2002, exporting firms generated three quarters of total sales in the Thai manufacturing sector, while firms with foreign capital participation accounted for 62 per cent of total industry revenues. There were very few Thai manufacturing firms without computers that exported or attracted
12 This figure is based on the positive answer to the sub-question regarding activities on Internet (identified
foreign capital investment. On average, of 100 exporting Thai manufacturers, 91 had at least one computer, 77 were connected to the Internet and only 35 had a web presence.
Chart 18. Average sales per employee in the manufacturing sector ($ per employee), 2003
Source: Thai Manufacturing Survey 2003, businesses with more than 10 employees.
Chart 18 illustrates average sales per employee in firms with computers, Internet and web presence in terms of their export position and foreign capital participation. A typical manufacturer with at least one computer receives revenues of $ 35’185 per employee yearly. A total of 33 per cent of businesses with computers are exporters and 19 per cent benefit from foreign capital participation. This confirms that computers are distributed throughout Thai manufacturing businesses and are not used exclusively by foreign-owned firms or by exporting firms.
Among firms with Internet access and web presence, exporting and foreign-owned firms had a higher participation. A typical manufacturer with at least one computer connected to the Internet earns on average more than firms with computers - ($ 44,288 per employee); but 48 per cent of Internet-connected businesses are exporters and 28 per cent receive foreign capital. The shares of exporting and foreign-owned firms are even higher among web-present manufacturers (61 per cent and 31 per cent). This suggests that web presence is used more frequently by exporting firms, possibly for the purpose of following foreign market developments (information search). Manufacturers with foreign capital participation do not establish web presence as frequently as exporting firms. Foreign capital participation seems to make more difference in terms of Internet access and less in terms of web presence, possibly owing to the existence of different management practices and requirements in foreign firms. The high share of exporters among manufacturers present on the web could be related to the language used or the relative scarcity of Internet content in the Thai language.13 However, available data provided no information on the
language used by firms on websites or about the characteristics of their target customers.
13 The Economist Intelligence Unit (2007) also shows that there are relatively few websites with content in
the Thai language.
Without web pres ence 18'783
With web presence 69'978 Without Internet 14'744 With Internet 44'228 Without computers 10'097 With computers 35'185 -10% 0% 10% 20% 30% 40% -5% 5% 15% 25% 35% 45% 55% 65%
Share of exporting firms
S h a re o f fi rm s w ith fo re ig n c a p ita l pa rt ic ipa ti o n
So far, the Report has presented an overview of ICT use in the Thai business sector, and in particular in Thai manufacturing. The next section will turn to the question of how ICT use may impact on firm productivity.
5. Measuring ICT impact on labour productivity
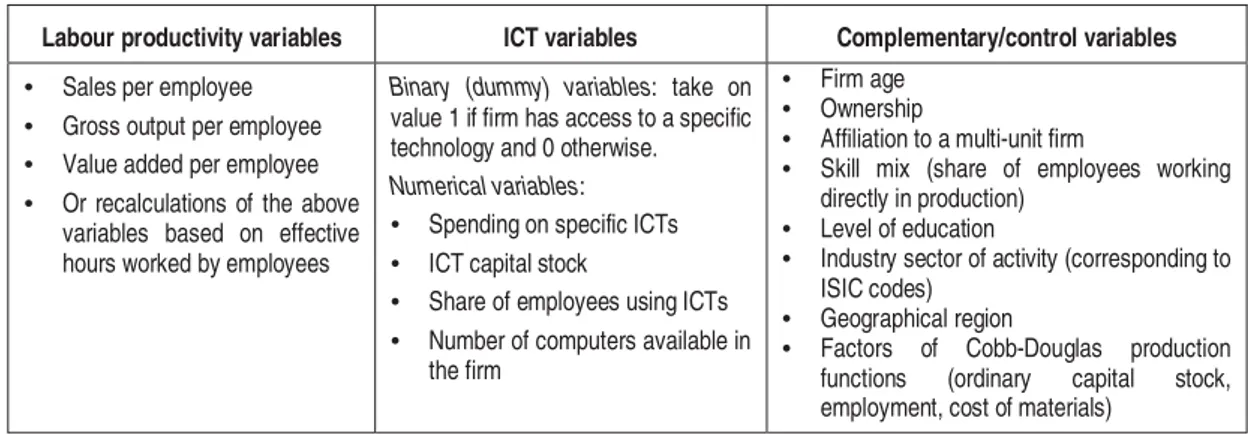
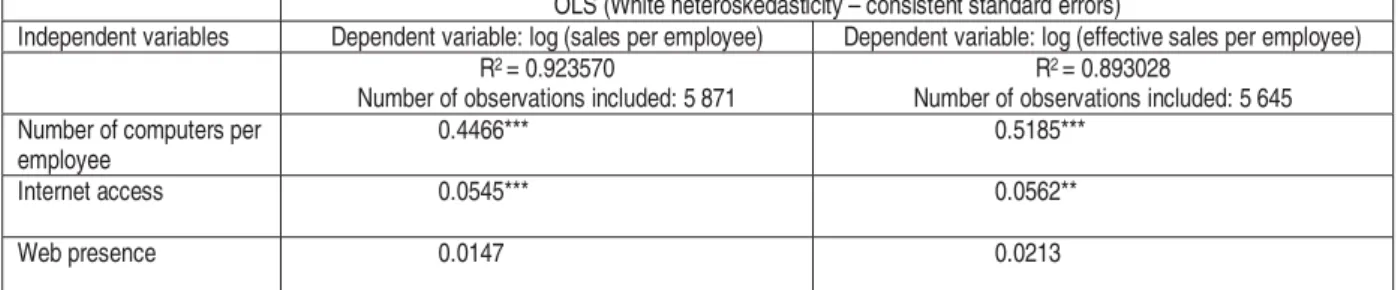
ICT use and firm labour productivityAt the firm level, analysis assessing the impact of ICT use on productivity can yield a complex set of results. Variables on ICT use have different productivity effects in conjunction with other control measures such as firm age, the share of foreign capital participation or access to more skilled human resources. For example, the estimated impact of a larger proportion of employees using computers was found by some studies to be more pronounced in young manufacturing firms (Maliranta and Rouvinen, 2003). Similarly, other studies focus on the specific impact of ICT in small and medium sized enterprises, as compared to larger businesses. To make it easier to keep track of the different empirical applications of firm level productivity models, this section groups the many dimensions into three main categories, by components of the analysis (table 3): variables measuring labour productivity, ICT variables and complementary factors likely to influence the ICT-productivity relationship.
Table 3. Key variables for measuring the impact of ICT on labour productivity
Labour productivity variables ICT variables Complementary/control variables
• Sales per employee
• Gross output per employee
• Value added per employee
• Or recalculations of the above variables based on effective hours worked by employees
Binary (dummy) variables: take on value 1 if firm has access to a specific technology and 0 otherwise. Numerical variables:
• Spending on specific ICTs
• ICT capital stock
• Share of employees using ICTs
• Number of computers available in the firm
• Firm age
• Ownership
• Affiliation to a multi-unit firm
• Skill mix (share of employees working directly in production)
• Level of education
• Industry sector of activity (corresponding to ISIC codes)
• Geographical region
• Factors of Cobb-Douglas production functions (ordinary capital stock, employment, cost of materials)
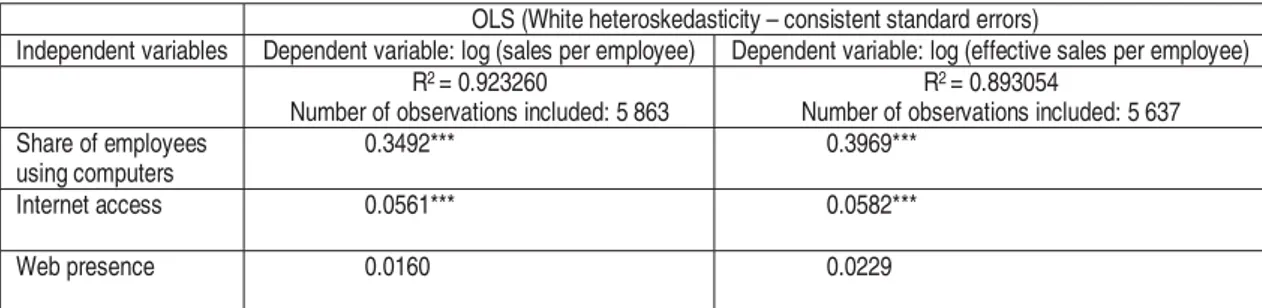
Labour productivity is commonly measured either as value added per employee or as sales per employee. Criscuolo and Waldron (2003) derive results for both measures of productivity and find that the impact of e-commerce14 was slightly stronger on value added than on sales.
Conversely, Atrostic and Nguyen (2002) rely on the findings of Baily (1986) to argue that using value added as a measure of labour productivity yields systematically biased estimates of the theoretically correct growth model. Outside the context of empirical models, value added is a more precise measure of labour productivity since it subtracts from the value of sales the costs incurred with intermediate consumption. For those considerations, analysing the impact of ICT on sales per employee was considered more appropriate for this study.
The empirical models presented here draw on several types of variables for describing the use of ICT. Binary variables, which distinguish between firms with and without access to, for example, Internet, are easy to collect and provide input for analyses of differences between the haves and the have nots. Empirical studies also test for the effect of intensity in ICT uptake – for example, the share of capital devoted to computer investments – and intensity of ICT use, such as the number of computers available or the share of employees using e-mail. From a theoretical point of view, findings based on numerical rather than binary variables are more powerful. Maliranta