Deposited in DRO:
18 September 2020Version of attached le:
Published VersionPeer-review status of attached le:
Peer-reviewedCitation for published item:
Althobaiti, Turke and Katsigiannis, Stamos and Ramzan, Naeem (2020) 'Triaxial accelerometer-based falls and activities of daily life detection using machine learning.', Sensors., 20 (13). p. 3777.
Further information on publisher's website:
https://doi.org/10.3390/s20133777Publisher's copyright statement: c
2020 by the authors. Licensee MDPI, Basel, Switzerland. This article is an open access article distributed under the
terms and conditions of the Creative Commons Attribution (CC BY) license (http://creativecommons.org/licenses/by/4.0/).
Use policy
The full-text may be used and/or reproduced, and given to third parties in any format or medium, without prior permission or charge, for personal research or study, educational, or not-for-prot purposes provided that:
• a full bibliographic reference is made to the original source
• alinkis made to the metadata record in DRO
• the full-text is not changed in any way
The full-text must not be sold in any format or medium without the formal permission of the copyright holders. Please consult thefull DRO policyfor further details.
Durham University Library, Stockton Road, Durham DH1 3LY, United Kingdom Tel : +44 (0)191 334 3042 | Fax : +44 (0)191 334 2971
Article
Triaxial Accelerometer-Based Falls and Activities
of Daily Life Detection Using Machine Learning
Turke Althobaiti1,† , Stamos Katsigiannis2,*,† and Naeem Ramzan2,†
1 Rafha Community College, Nothern Border University, Rafha 76413, Saudi Arabia;
Turke.Althobaiti@nbu.edu.sa
2 School of Computing, Engineering and Physical Sciences, University of the West of Scotland, High St.,
Paisley PA1 2BE, UK; Naeem.Ramzan@uws.ac.uk * Correspondence: Stamos.Katsigiannis@uws.ac.uk † These authors contributed equally to this work.
Received: 18 May 2020; Accepted: 1 July 2020; Published: 6 July 2020 Abstract: The detection of activities of daily living (ADL) and the detection of falls is of utmost importance for addressing the issue of serious injuries and death as a consequence of elderly people falling. Wearable sensors can provide a viable solution for monitoring people in danger of falls with minimal external involvement from health or care home workers. In this work, we recorded accelerometer data from 35 healthy individuals performing various ADLs, as well as falls. Spatial and frequency domain features were extracted and used for the training of machine learning models with the aim of distinguishing between fall and no fall events, as well as between falls and other ADLs. Supervised classification experiments demonstrated the efficiency of the proposed approach, achieving an F1-score of 98.41% for distinguishing between fall and no fall events, and an F1-score of 88.11% for distinguishing between various ADLs, including falls. Furthermore, the created dataset, named “ShimFall&ADL” will be publicly released to facilitate further research on the field.
Keywords:activities of daily living; fall detection; accelerometer; wearable sensors; machine learning
1. Introduction
The automated recognition of human activity using various types of sensors is an interesting research area that can have multiple practical applications [1], e.g., in healthcare [2], surveillance [3], entertainment [4], security [5], building management [6], and others. Daily or unexpected activities, such as walking, sitting, running, cycling, standing, falling, fighting, crowd assembling, etc., can be detected using non pervasive sensors that are either remotely positioned, e.g., a camera, or carried by humans, e.g., smart phones, smart watches, smart wristbands [7]. This was made possible by the advancement in microelectronics, wearable sensors, and imaging sensors during the past decade that allowed the widespread manufacturing of small devices with enhanced computational power.
Between the possible applications of Human Activity Recognition (HAR), recognising Activities of Daily Living (ADL) draws a lot of interest due to the potential applications in assisted living scenarios [8], eldercare [9] and general healthcare. Although generic ADL recognition can find interesting applications, the recognition of falls is of critical importance, especially in the case of older people or people with health issues. According to the World Health Organisation (WHO), approximately 28–35% of people aged 65 and over fall each year, increasing to 32–42% for those over 70 years of age, with older people living in care homes falling more often [10]. The mortality rate due to falls, as well as the cost for the health system, underlines the importance of fall detection as a means to facilitate rapid response and intervention in case of a fall. Furthermore, most falls typically occur while performing typical ADL [11] and it is crucial for health-care providers to understand the circumstances
that led to a fall in order to guide the patients in adopting mitigation measures for the future [12]. Consequently, there is significant interest in developing fall and ADL detection methods.
In this work, we attempted to detect falls and ADL events using data from a chest-strapped triaxial accelerometer. Thirty five volunteers participated in this study and performed six types of ADL and nine types of falls. The recorded accelerometer data were then used in order to extract spatial and frequency domain features to be used for the training of machine learning models. The trained machine learning models focused on two tasks: (a) binary classification between fall and no fall events, and (b) seven-class classification between the six ADL events and falls. Classification F1-score reached 98.41% for the binary problem and 88.11% for the seven-class problem, demonstrating the efficiency of the proposed approach for fall and ADL detection using accelerometer data. Furthermore, the created dataset, named “ShimFall&ADL”, will be publicly released in order to allow other researchers to test their methods on it.
The rest of this work is organised in four sections. Section2provides a brief literature review on the fields of fall detection and ADL recognition using accelerometer sensors, while Section3describes the overall methodology, including the experimental protocol, the signal acquisition sensor, and the signal analysis approach. Then, results are presented and discussed in Section4, whereas conclusions are summarised in Section5.
2. Background
Various methods have been proposed for the detection of falls and ADL. Some approaches attempt to monitor the surroundings of a person [13] via acoustic sensors [14], static cameras [15], wearable cameras [16], pressure sensors [17], and others, while others use wearable accelerometer or gyroscope sensors [12,18,19] or the accelerometer or gyroscope sensors of mobile phones [20–22]. Fall and ADL detection algorithms typically try to differentiate between falls and ADL using a variety of information, such as velocity, acceleration, posture, duration of inactivity, and others. Rules-based approaches or machine learning approaches are then used in order to analyse the available information and detect falls or ADL.
Saadeh et al. [19] proposed the use of a wearable triaxial accelerometer in order to extract statistical features from the accelerometer data. A combination of a thresholding decision method and a Support Vector Machine (SVM) learning-based method was proposed for the prediction and detection of falls. Nguyen et al. [23] also used a triaxial accelerometer and examined its positioning at the chest, waist, left ankle and right ankle. Features were then extracted from the accelerometer data using Principal Component Analysis (PCA) and an SVM classifier was used for the detection of fall events based on the computed features. Catal et al. [24] used the accelerometer of a mobile phone in order to detect various ADL using an ensemble classification approach that combined various classification algorithms. Huynh et al. [25] combined gyroscope and accelerometer data acquired from sensors placed on the chest and was able to detect various ADL and fall events using a thresholding approach on peak acceleration and peak angular velocity.
Ali et al. [26] proposed a fall detection system based on a system-on-chip (SoC) board that utilised a triaxial accelerometer for real-time fall detection. The Discrete Wavelet Transform (DWT) and PCA were used for feature extraction and fall detection accuracy reached 88.4% using a Decision Tree classifier. A similar SoC-based approach was proposed by Abdelhedi et al. [27] who proposed the use of an accelerometer located in the waist for fall detection. Accuracy reached 93.25% using a thresholding decision approach based on acceleration sum vector and body tilt features. Abuhania et al. [28] used a chest-strapped accelerometer and the acceleration sum vector as a feature, and reported a 90% fall detection accuracy using a k-Nearest Neighbour (kNN) classifier. A waist-strapped accelerometer was used by Liu et al. [29], who extracted multiple features from the accelerometer signals. A 97.60% classification accuracy for fall detection was reported using SVM with RBF kernel. Multiple statistical features were also extracted from accelerometer data from a waist-strapped accelerometer sensor and a waist-strapped mobile phone in the Chelli et al. [30] work. Classification accuracy for fall detection
reached 99.09% using an Ensemble Bagged Tree (EBT) classifier, and 94.10% for fall and ADL detection using again an EBT classifier.
The thresholding decision approach has been used by many researchers for the task of fall and ADL detection. Saadeh et al. [22] used the accelerometer of a mobile phone located inside the trouser’s pocket. Using the acceleration sum vector and a thresholding decision approach, they reported a fall detection accuracy of 98.65%. In a later work, Saadeh et al. [19] employed again a thresholding approach using the acceleration sum vector square, extracted from accelerometer signals acquired via a mobile phone inside the trouser’s pocket and an accelerometer sensor strapped at the upper thigh, and reported a fall detection accuracy of 98.95%. Šeketa et al. [31] also used a thresholding decision approach and the Kangas impact, velocity, and posture features. The reported fall detection accuracy reached 90% across various examined datasets.
Casiliari et al. [32] explored the performance of Artificial Neural Networks (ANN) on accelerometer data for the task of ADL and fall recognition. However, despite achieving very good results on the examined datasets, the authors underlined the difficulty of extrapolating their proposed approach to other testbeds. The performance of ANNs was also examined by Tahir et al. [33] in combination with features extracted using Convolutional Neural Networks (CNNs) from the accelerometer data acquired by a pelvis-strapped accelerometer, reporting a classification accuracy of 92.23%. Nho et al. [34] proposed the fusion of heart rate data and accelerometer data acquired from a wrist-strapped sensor for the task of fall detection. They reported a 92.22% fall detection accuracy using the fusion of accelerometer and heart rate-based features and Gaussian Mixture Models (GMMs) for clustering. Kwolek and Kepski [35] proposed the use of accelerometer data for detecting a potential fall, combined with the depth camera of a Microsoft Kinect sensor for verifying the fall. The fusion of accelerometer and depth data was also proposed by Kim et al. [36] who reported an accuracy of 90% using a Random Forest classifier.
Kong et al. [37] examined the issue of optimal positioning of accelerometer and gyroscope sensors for the task of ADL and fall detection, concluding that wrist and ear were the most and the second most favourable locations for the sensors. However, one limitation of their study was that participants were young, thus older people were not taken into consideration. The combination of accelerometer and gyroscope sensors for the task of fall detection has been proposed by various researchers. Sucerquia et al. [38] examined the use of a waist-strapped accelerometer and gyroscope on both young and older people. They reported a fall detection accuracy of 95.96% for young people using a thresholding decision approach based on the standard deviation magnitude on the horizontal plane, while for the older people, accuracy reached 92.21% using a similar approach. Chen et al. [39] also examined the use of accelerometer and gyroscope data via two mobile phones located inside the trouser’s pockets. Fall detection accuracy reached 98.3% using various features and the kNN classifier. Similarly, Hussain et al. [40] also used the kNN classification method and various features extracted from accelerometer and gyroscope data, reaching a fall detection accuracy of 99.8%. Fish et al. [41] proposed a wearable device that includes an accelerometer, a magnetometer for measuring the magnetic field associated with the user’s change of orientation, and a microphone, and uses a thresholding approach in order to detect ADL and transmit this information.
3. Materials and Methods
The proposed system aims at using accelerometer data from wearable or portable sensors in order to distinguish between various activities, while also detecting falls. Triaxial accelerometer data were acquired from participants recruited for this study using a ShimmerTMwireless sensor [42]. The acquired accelerometer data were then used in order to extract spatial and frequency domain statistical features. The extracted features were then used for the training of machine learning models that can detect falls and other ADL based on the accelerometer data. An overview of the proposed approach is presented in Figure1.
Triaxial accelerometer Data acquisition Feature extraction Classifier training Fall No fall Jump, Lie down,
Bend/Pick up, Sit, Stand,
Walk, Fall
Results evaluation
Figure 1.Overview of the proposed Fall and ADL detection methodology. 3.1. Participants and Experimental Setting
Experiments were conducted in a controlled environment at a research lab in the University of the West of Scotland. Thirty five (35) healthy individuals were recruited among young or mid-aged volunteers for safety reasons, aged between 19 and 34 years old, having a body weight between 52 and 113 kg, and a body height between 1.45 and 1.82 m. Before starting the experiments, all participants were given safety instructions and details about the activities they had to perform and were given the opportunity to ask questions. Then, after signing a consent form, the experiment commenced. Furthermore, each experiment was video recorded for future reference and validation. It must be noted that approval to conduct this study, including the acquisition and publication of anonymised data, was granted by the Ethics Committee of the University of the West of Scotland.
3.2. Hardware Platform
A ShimmerTMv2 (Figure2) wireless sensor [42] was attached to the chest of all the participants using a specifically designed strap, in order to record accelerometer data at a sampling rate of fs = 50 Hz. The ShimmerTMsensor is a wireless, lightweight, small, wearable system, equipped
with a triaxial accelerometer, as well as with other sensors, which are suitable for various wearable applications, including fall and activity detection. The sensor has a relatively small size (1.75×0.8×
5 cm) and weights only 10 g, making it suitable for applications like fall and ADL detection since it does not hinder the users’ movement and activities.
Figure 2.ShimmerTMaccelerometer sensor and its coordinates system. 3.3. Activities and Data Acquisition
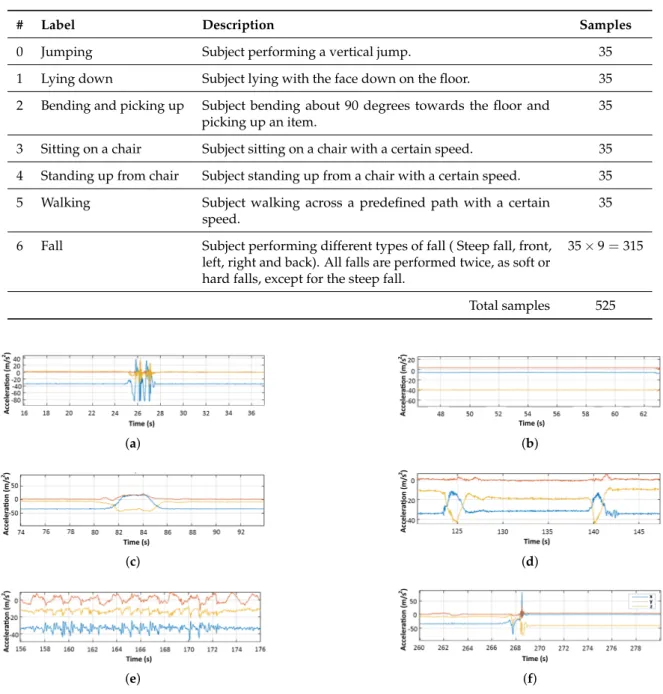
After equipping the ShimmerTM sensor and confirming correct signal transmission and acquisition, participants proceeded to perform ADL and fall events (shown in Table1), taking a short break of 5 to 6 s between each event for resting and for easier separation of the acquired data. ADL events consisted of jumping, lying down, bending/picking up, sitting/standing to/from a chair, and walking. Fall activities included steep, front, left, right, and back falls, with each of them being repeated twice (soft and hard), except for the steep fall. A foam landing mattress was used in any activity that required contact between the participant and the ground, both for safety and for hygiene reasons, and to avoid any injuries as a result of the experiment. The accelerometer data were transmitted via Bluetooth and acquired in one continuous recording for each participant. In the end, each recording contained 6 ADL events and 9 fall events. An example of the captured data for each event category is shown in Figure3.
Table 1.Activities performed by the participants of this study.
# Label Description Samples
0 Jumping Subject performing a vertical jump. 35
1 Lying down Subject lying with the face down on the floor. 35
2 Bending and picking up Subject bending about 90 degrees towards the floor and picking up an item.
35
3 Sitting on a chair Subject sitting on a chair with a certain speed. 35 4 Standing up from chair Subject standing up from a chair with a certain speed. 35 5 Walking Subject walking across a predefined path with a certain
speed.
35
6 Fall Subject performing different types of fall ( Steep fall, front, left, right and back). All falls are performed twice, as soft or hard falls, except for the steep fall.
35×9=315
Total samples 525
(a) (b)
(c) (d)
(e) (f)
Figure 3.Example of accelerometer data collected from one volunteer: (a) Jumping, (b) Lying down, (c) Bending and picking up, (d) Sitting down/standing up, (e) Walking, and (f) Fall.
3.4. Data Preparation
After acquiring the accelerometer data, the recorded signals were first prepared before any further analysis. The recorded triaxial accelerometer signal consisted of a 3-dimensional vector, with each component corresponding to each of the three axes/dimensionsx,y,zrespectively. An analysis of the captured signals showed that the duration of an event that caused acceleration was not longer than 2 s, as also pointed out in [26]. Using the information from the captured videos from each experiment and the corresponding video and accelerometer timestamps, the acquired signals were first divided into segments that contained only one event each. Then, a 2 s event-related segment was extracted from each segment and was labelled manually with its corresponding event. The selection of the 2 s event-related segment was achieved by detecting the highest peak corresponding to an event and defining the event segment as starting 1 s before the highest peak and ending 1 s after the peak. Confirmation that the whole event-related accelerometer segments were captured via the aforementioned method was
performed manually. Considering that the sampling frequency of the accelerometer was 50 Hz, each event-related segment consisted of 101 samples per axis (50 samples for each 1 s segment before and after the highest peak, plus 1 sample for the highest peak). As a result, 3 signals,Fx,Fy, andFz,
of 101 samples each, correspond to each event in the dataset, with each signal being a time series. 3.5. Feature Extraction
The signals Fx, Fy, andFz were then used in order to extract spatial and frequency domain
features. A total of 72 features was computed per event (27 spatial domain features and 45 frequency domain features).
3.5.1. Spatial Domain Features
Spatial domain features consist of statistical and autocorrelation metrics, directly computed from each of the signal segmentsFx,Fy, andFz. The statistical spatial domain features used in this work
were the following [43,44]: Mean: µ(Fc) = 1 N N
∑
k=1 Fc,k (1) Variance: σ2(Fc) = 1 N N∑
k=1 (Fc,k−µ(Fc))2 (2) Standard deviation: σ(Fc) = v u u t1 N N∑
k=1 (Fc,k−µ(Fc))2 (3) Root-mean-square (rms): rms(Fc) = v u u t1 N N∑
k=1 |Fc,k|2 (4) Skewness: skew(Fc) = 1 Nσ3 N∑
k=1 (Fc,k−µ(Fc))3 (5) Kurtosis: kurt(Fc) = 1 Nσ4 N∑
k=1 (Fc,k−µ(Fc))4 (6)wherec=x,y,zis the corresponding accelerometer axis,Fc,kis thek-th sample of the time seriesFc,
andN=101 the number of samples.
The autocorrelation features used in this work were extracted as follows [43]: First, the autocorrelation sequence of the signal is computed and then a peak detection algorithm is used to detect peaks in the autocorrelation sequence. The peak detection algorithm detects the tallest peak in the autocorrelation sequence and ignores all peaks within a distance of size equal to 30% of the signal’s period (T = f1
s =
1
50 Hz =0.02 s) from the detected peak. The procedure is then repeated
for the tallest remaining peak and iterates until it runs out of peaks to consider. The three following values are then extracted as the autocorrelation features of the signal: (a) the position of the main peak (detected first), (b) the position of the second detected peak, and (c) the amplitude of the second detected peak [43].
In total, 9 spatial domain features (6 statistical and 3 autocorrelation) were computed for each of the three axes of the accelerometer signal, leading to a total of 27 spatial domain features per axis per event.
3.5.2. Frequency Domain Features
Frequency domain features were extracted from the Power Spectral Density (PSD) estimation of the signal segments. The widely used Welch’s overlapped segment averaging estimator was used in order to estimate the PSD of each signal [45], and spectral peak features and spectral power features were then extracted from the PSD estimate [43]:
• Spectral peak features: After computing the PSD estimate, a peak detection algorithm is used in order to detect the 6 highest peaks of the PSD estimate. The algorithm is similar to the one used for the extraction of the autocorrelation features, with the minimum distance between peaks set to 30% of fs
N = 101 samples50 Hz ≈0.495 Hz. The position and the amplitude of the highest 6 peaks were
then extracted as the spectral peak features of the signal.
• Spectral power features: After computing the PSD estimate, the total power in the following three frequency bands was extracted as a feature: (a) 0.5–5 Hz, (b) 5–10 Hz, and (c) 10–20 Hz.
Following this procedure, 15 features (12 spectral peak features and 3 spectral power features) were computed for each of the three axes of the accelerometer signal, leading to a total of 45 frequency domain features per axis per event.
3.6. Final Feature Vector
After computing the spatial and frequency domain features, the final feature vector was created as the concatenation of all the computed features. Let fi,x, fi,y, and fi,z be
the i-th feature corresponding to the x, y, and z axes respectively. Then the final feature vector was defined as [f1,x,f1,y,f1,z,f2,x,f2,y,f2,z, ...,f72,x,f72,y,f72,z] and contained a total of
(3 × 27 spatial features+ 3 × 45 frequency features) =216 features. 3.7. Classification
The extracted feature vectors were then utilised in order to train machine learning models for ADL and fall event detection. Various classification methods were tested for two different problems: (a) seven-class classification for distinguishing between the 7 classes in our dataset (ADL and Falls), and (b) binary classification to distinguish betweenFallandNo Fall:
3.7.1.k-Nearest Neighbour (k-NN)
Thek-Nearest Neighbour classifier is a simple classifier that has demonstrated significant efficiency in a wide variety of machine learning problems. In this work, we examined the performance of thek-NN classifier fork=1, 3, 5, 7.
3.7.2. Support Vector Machines (SVM)
The performance of Linear Support Vector Machines (LSVM) and SVM with a radial basis function kernel (RSVM) was also examined in the case of the binary problem (Fall/No Fall). Since SVMs are binary classifiers, the error-correcting output codes (ECOC) [46] approach in combination with LSVM or RSVM was used for the seven-class problem. ECOC is an ensemble multi-class classification method that combines many binary classifiers in order to solve the multi-class problem. In this work,
K(K−1)
2 LSVM or RSVM classifiers using the one-versus-one coding design were used for the ECOC
model, withK=7 being the number of classes, leading to 21 LSVM or RSVM classifiers being used. 3.7.3. Linear Discriminant Analysis (LDA)
Linear discriminant analysis (LDA) was used with the class prior probabilities set as the class relative frequencies in the responses.
3.7.4. Decision Tree (DT)
The decision tree learning algorithm was also used with the class prior probabilities set as the class relative frequencies in the responses.
4. Results and Discussion 4.1. Classification Experiments
Supervised classification experiments were conducted in order to evaluate the proposed approach for the two examined problems, i.e., the binary problem of distinguishing between a fall event and a non-fall event, and the seven-class problems of distinguishing between the 7 available event classes (ADL and Fall). It must be noted that the dataset is slightly unbalanced for the binary problem, having 315/525 (60%) samples in theFallclass and 210/525 (40%) samples in theNo Fall class, and considerably biased towards theFallclass for the seven-class problem, having 315/525 (60%) samples in the Fallclass and 35/525 (∼6.66%) samples for each of the other 6 ADL event classes. Considering that the Fall class contains samples from various types of falls, as well as the importance and severe implications of detecting a fall compared to other ADL events in a real scenario, we opted to keep the dataset as is and avoid removingFallsamples in order to balance the dataset. However, in order to provide a fair classification performance evaluation, we opted to use the F1-score metric alongside the classification accuracy metric, since it is not affected from the class balance. The F1-score is the harmonic mean of Precision and Recall and provides a fairer classification performance metric in cases of uneven class distribution. Furthermore, since the F1-score depends on which class is considered as positive, the reported F1-scores were computed as the average F1-scores between the examined classes.
To avoid over-fitting the trained machine learning models, aleave-one-subject-out(LOSO) cross validation procedure was followed for all the examined classifiers. To this end, at each fold of the cross validation, all the samples associated with a specific participant were used for testing the model and all the other samples for training. After repeating this process for all participants in the dataset (35), the cross validation procedure finished. Overall classification performance metrics were computed as the arithmetic mean of the performance metrics across all folds. This cross validation approach was employed in order to avoid bias due to characteristics of specific participants or specific recording sessions. Furthermore, prior to training at each fold of the cross validation procedure, feature vectors were standardised since the range of the various features differed. In addition, the Matlab R2018a implementations of the examined classification algorithms were used for the experiments conducted.
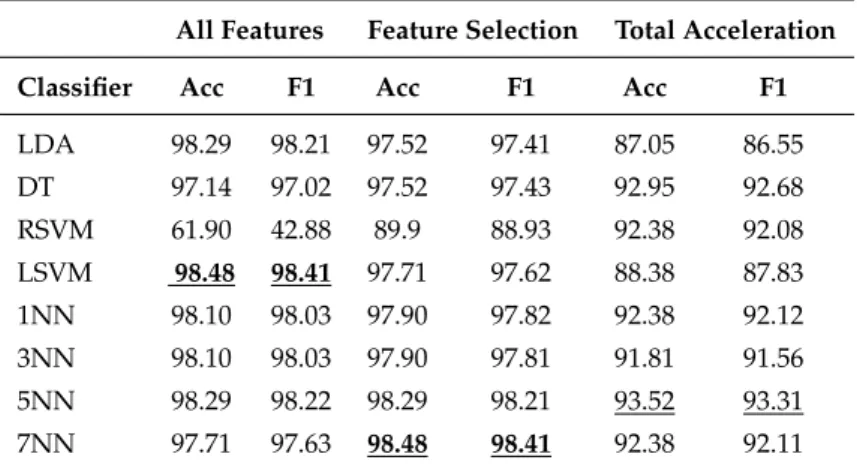
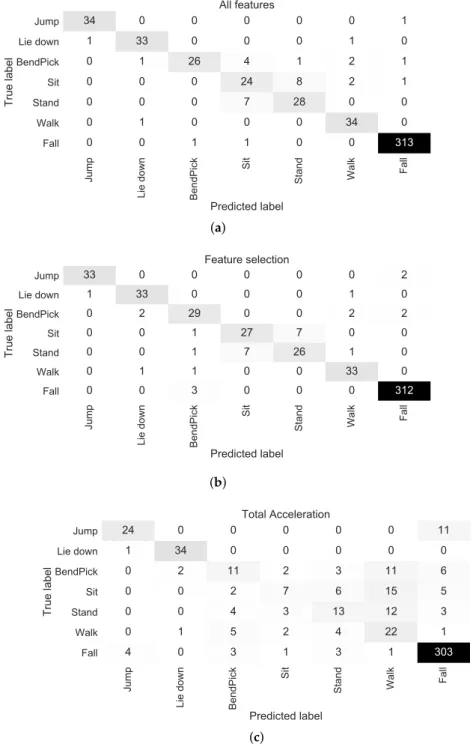
Results in terms of classification accuracy and classification F1-score are presented in Table2for the binary problem (Fall/No Fall) and in Table3for the seven-class problem. For the binary problem, classification F1-score reached 98.41% when using all the computed features and the LSVM classifier. As shown in the confusion matrix in Figure4a, when all features are used, the LSVM classifier correctly predicted 311/315 (98.73%) of falls and 206/210 (98.10%) of non-falls, miss-classifying 4 samples in each case. In the case of the seven-class problem, classification F1-score reached 87.40% using all the computed features and the LDA classifier. As shown in the confusion matrix in Figure5a, when all features are used, the LDA classifier correctly predicted 313/315 (99.37%) of the fall events and 179/210 (85.24%) of the ADL events, with most miss-classifications occurring for theBending and Picking Up, Sitting on a chairandStanding up from chairclasses.
Interestingly, although the classification F1-score for the binary problem is considerably higher than for the seven-class problem (98.41% vs. 87.40%) it seems that the seven-class classifier performed marginally better as a fall detection system while at the same time being able to differentiate non-fall events as specific ADL events. Another interesting observation is that while there were significant differences in the performance of different classification algorithms for the seven-class problem, with the standard deviation of the F1-scores across the classifiers being 22.04% (or 2.45% when RSVM is excluded), the F1-score results for the binary problem exhibited considerably lower variability, with the
standard deviation of the F1-scores across the classifiers being 18.21% (0.44% when RSVM is excluded). It must be noted that the performance of RSVM for both problems was significantly lower compared to the other classification algorithms. Examining the confusion matrices for RSVM, we noticed that for both problems, the RSVM classifier predicted the majority of the samples as belonging to the majority class, i.e.,Fall. As a result, while classification accuracy was close to the class ratio for theFallclass (∼60%), the F1-score suffered considerably, as shown in Tables2and3.
Table 2.Classification accuracy (%) and F1-score (%) for the binary problem (Fall/No Fall). All Features Feature Selection Total Acceleration
Classifier Acc F1 Acc F1 Acc F1
LDA 98.29 98.21 97.52 97.41 87.05 86.55 DT 97.14 97.02 97.52 97.43 92.95 92.68 RSVM 61.90 42.88 89.9 88.93 92.38 92.08 LSVM 98.48 98.41 97.71 97.62 88.38 87.83 1NN 98.10 98.03 97.90 97.82 92.38 92.12 3NN 98.10 98.03 97.90 97.81 91.81 91.56 5NN 98.29 98.22 98.29 98.21 93.52 93.31 7NN 97.71 97.63 98.48 98.41 92.38 92.11
Note: Bold denotes the overall best performance. Underlined results denote the best performance per feature.
Table 3.Classification accuracy (%) and F1-score (%) for the seven-class problem (ADL and Fall). All Features Feature Selection Total Acceleration
Classifier Acc F1 Acc F1 Acc F1
LDA 93.71 87.40 90.29 81.41 73.52 50.89 DT 91.24 84.56 92.38 86.45 74.10 51.81 RSVM (ECOC) 61.52 17.35 72.38 50.32 78.86 59.24 LSVM (ECOC) 93.33 86.70 93.90 88.11 77.71 56.31 1NN 90.10 80.99 91.81 84.44 75.62 55.79 3NN 91.05 82.82 92.38 85.50 74.48 53.78 5NN 90.67 81.87 92.38 85.15 76.76 57.39 7NN 90.10 81.04 90.86 81.78 75.05 54.73
Note: Bold denotes the overall best performance. Underlined results denote the best performance per feature.
)DOO 1R)DOO 3UHGLFWHGODEHO )DO O 1R )DO O 7U XH OD EH O $OOIHDWXUHV (a) )DOO 1R)DOO 3UHGLFWHGODEHO )DO O 1R )DO O 7U XH OD EH O )HDWXUHVHOHFWLRQ (b) )DOO 1R)DOO 3UHGLFWHGODEHO )DO O 1 R )DO O 7U XH OD EH O 7RWDO$FFHOHUDWLRQ (c)
Figure 4.Confusion matrices for the binary problem (Fall/No Fall) for the best performing classifier using (a) all features (LSVM), (b) feature selection (7NN), and (c) the total acceleration features (5NN).
-XP S /L H GRZQ % HQG3 LF N 6LW 6 WDQG :DO N )DO O 3UHGLFWHGODEHO -XPS /LHGRZQ %HQG3LFN 6LW 6WDQG :DON )DOO 7U XH OD EH O $OOIHDWXUHV (a) -XP S /L H GRZ Q % HQG3 LF N 6LW 6 WDQG :DO N )DO O 3UHGLFWHGODEHO -XPS /LHGRZQ %HQG3LFN 6LW 6WDQG :DON )DOO 7U XH OD EH O )HDWXUHVHOHFWLRQ (b) -XP S /L H GRZQ % HQG3 LF N 6LW 6 WDQG :DO N )DO O 3UHGLFWHGODEHO -XPS /LHGRZQ %HQG3LFN 6LW 6WDQG :DON )DOO 7U XH OD EH O 7RWDO$FFHOHUDWLRQ (c)
Figure 5. Confusion matrices for the seven-class problem (ADL and Falls) for the best performing classifier using (a) all features (LDA), (b) feature selection (LSVM-ECOC), and (c) the total acceleration features (RSVM-ECOC).
4.2. Feature Selection
Due to the large number of features used (72 features × 3 axes = 216), we also examined the performance of the proposed approach by applying feature selection. To reduce the computational time needed for the feature selection procedure, we opted to use the already trained (with cross validation) DT classifiers (Section4.1) and examine the importance of each predictor (feature) according to the available decision trees. The importance of each predictor for the tree was computed by summing changes in the risk due to splits on every predictor and dividing the sum by the number of branch nodes. At each fold of the cross validation, the importance of each feature was computed during the training of the decision tree classifier and the average importance across all folds was then
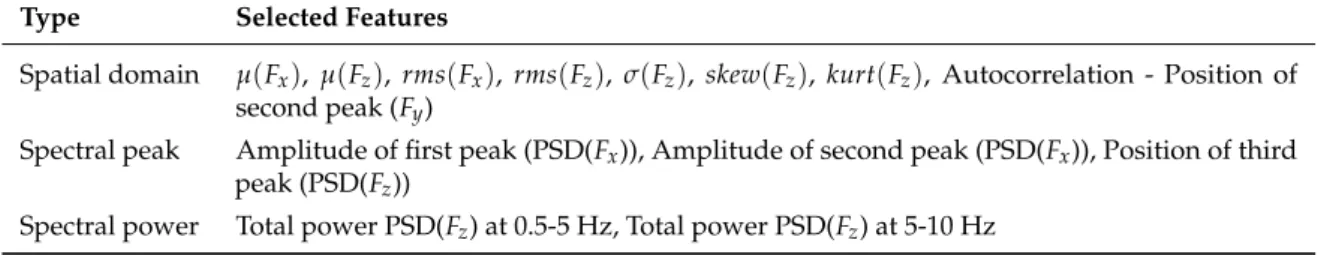
computed. Finally, in order to discard features with an average importance close to 0, the features with an average importance>0.0002 were selected. This process led to the selection of the 13 features shown in Table4. The 13 selected features were then used in order to conduct again the classification experiments for the two examined problems following the LOSO cross validation procedure.
For the binary problem, classification F1-score reached 98.41% when using the selected features and the 7-NN classifier. As shown in the confusion matrix in Figure4b, when the selected features were used, the 7-NN classifier correctly predicted 311/315 (98.73%) ofFallsand 206/210 (98.10%) ofNo Falls, miss-classifying 4 samples in each case. From Table2and Figure4a,b, it is evident that the best performance is the same regardless of using all the features or only the 13 selected features. In the case of the seven-class problem, classification F1-score reached 88.11% when using the selected features and the LSVM (ECOC) classifier. As shown in the confusion matrix in Figure5b, when the selected features are used, the LSVM (ECOC) classifier correctly predicted 312/315 (99.05%) of the fall events and 181/210 (86.19%) of the ADL events, with most miss-classifications occurring again for theBending and Picking Up,Sitting on a chairandStanding up from chairclasses. The overall classification F1-score improved marginally compared to when all features were used (87.40% vs. 88.10), although one additionalFallsample was miss-classified.
Similar to when all features were used, although the classification F1-score for the binary problem is considerably higher than for the seven-class problem (98.41% vs. 88.11%) when the selected features were used, it seems that the seven-class classifier performed marginally better as a fall detection system, while at the same time being able to differentiate non-fall events as specific ADL events.
Table 4.List of selected features. Type Selected Features
Spatial domain µ(Fx), µ(Fz), rms(Fx), rms(Fz), σ(Fz), skew(Fz), kurt(Fz), Autocorrelation - Position of second peak (Fy)
Spectral peak Amplitude of first peak (PSD(Fx)), Amplitude of second peak (PSD(Fx)), Position of third peak (PSD(Fz))
Spectral power Total power PSD(Fz) at 0.5-5 Hz, Total power PSD(Fz) at 5-10 Hz
4.3. Total Acceleration Features
Another type of feature that has been commonly used in the literature for fall detection via accelerometer data is the total acceleration [47], defined as |~a| = qF2
x+Fy2+Fz2. To this end,
the minimum and maximum total acceleration was computed for each event and the feature vector [min(~a),max(~a)]was created. Then, the previously described supervised classification experiments were repeated using the new feature vector.
As shown in Table2, for the binary problem, classification F1-score reached 93.31% when using the total acceleration features and the 5-NN classifier, performing worse than when the other examined features were used. As shown in the confusion matrix in Figure4c, when the total acceleration features were used, the 5-NN classifier correctly predicted 292/315 (92.70%) of the fall events and 199/210 (94.76%) of non-fall events, miss-classifying 23 fall events and 11 non-fall events. In the case of the seven-class problem, classification F1-score reached 59.24% using the total acceleration features and the RSVM (ECOC) classifier. As shown in the confusion matrix in Figure5c, when the total acceleration features were used, the RSVM (ECOC) classifier correctly predicted 303/315 (96.19%) of the fall events and 111/210 (52.86%) of the ADL events, with most miss-classifications occurring again for theBending and Picking Up,Sitting on a chairandStanding up from chairclasses.
Similar to when all the previously examined features, as well as the selected features were used, the total acceleration features led to better fall detection performance when used for the seven-class problem compared to the binaryFall/No Fallproblem, correctly classifying 303/315 falls, compared to 292/315 in the binary case.
4.4. Further Discussion
A quite interesting outcome of the conducted experiments was that regardless the features used and the overall F1-score, the seven-class models performed similar or marginally better as fall detectors compared to the binary (Fall/No Fall) models. Consequently, despite the binary models achieving higher classification F1-scores, even when only information regarding whether a fall event has occurred is required, the multi-class models constitute an efficient solution, with the added-value of ADL event detection. Furthermore, if the seven-class classifier is used as a fall detector, i.e., consider all ADLs as the negative class and fall as the positive class, then the sensitivity for theFallclass would reach 99.05%.
Regarding the features used, it is evident from Table2and Figure4that in the case of the binary (Fall/No Fall) classification models, the examined features proved to be more efficient compared to the total acceleration features. Furthermore, using only 13 out of the 216 total features led to a similar best classification performance to when all features were used, thus the selected feature subset constitutes a viable alternative that leads to a reduction in computational requirements. In the case of the seven-class classification models (ADL and Fall), it is evident from Table 3and Figure 5 that the examined features overperformed considerably compared to the total acceleration features. Furthermore, the use of the selected feature subset led to a marginal improvement in classification performance, demonstrating that the selected feature subset is sufficient for the classification task at hand, leading to a reduction in computational requirements.
Table5provides the classification accuracy achieved by various recent accelerometer-based state-of-the-art fall and ADL detection methods, as reported in each respective work. It is evident that when only accelerometer data are used, the proposed approach achieves competitive performance that is also comparable to methods that use additional input signals, such as gyroscopes.
4.5. Dataset Availability
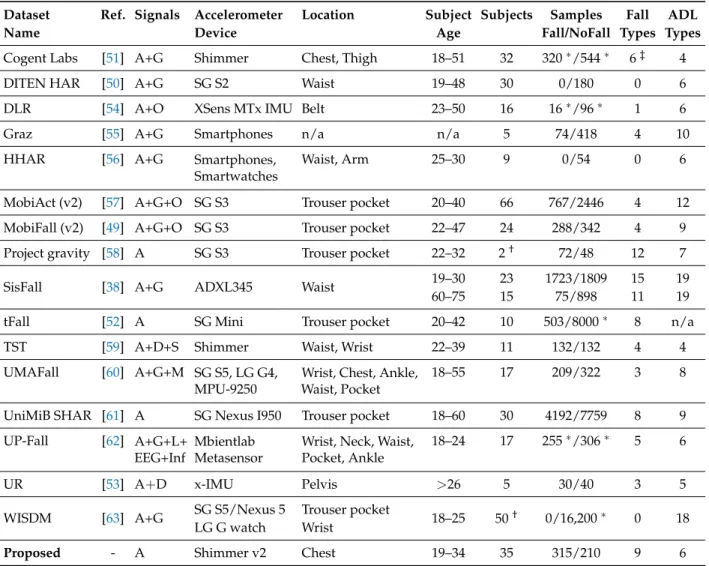
The created dataset, named “ShimFall&ADL” will be publicly released in an open repository in order to allow other researchers to use our data and study the performance of their methods on them. Researchers can use the link in [48] to access and download the “ShimFall&ADL” dataset. Considering that many related publications use proprietary datasets (as shown in Table5), we believe that the release of an additional publicly available dataset constitutes an important contribution to the field. Table 6provides a brief comparison between the proposed dataset and other publicly available datasets. Some notable characteristics of the proposed dataset in relation to the other publicly available datasets is that the accelerometer sensor is positioned on the chest (only two other datasets use this positioning), it contains data from more subjects than the average (35 subjects in “ShimFall&ADL” vs. 21.29 subjects on average in the other datasets), and also contains more fall types than most of the other datasets.
Table 5.Accuracy (%) of various accelerometer-based state-of-the-art fall detection methods, as reported in the literature, in ascending chronological order.
Year Method Ref. Target Signals Accel. Location Dataset Samples Fall Features Classifier Cross Accu.
Device Fall/NoFall Types Valid. (%)
2014 Ali et al. [26] Fall A Shimmer Chest P 139/84 4 DWT+PCA DT Unknown 88.40
2016 Abdelhedi et al. [27] Fall A ADXL345 Waist P Unknown 4 Sum Vector/Body tilt Threshold n/a ∗93.25
Abunahia et al. [28] Fall A Shimmer Chest P 52/91∗∗ 4 Sum Vector kNN Hold-out 90.00
2017 Saadeh et al. [22] Fall A SG S3 Trouser pocket [49] 120/118 4 Sum Vector Threshold n/a 98.65
Sucerquia et al. [38] Fall (Young) A+G ADXL345 Waist O 1723/1809 15 Standard deviation Threshold 10-fold 95.96
magnitude on hori-zontal plane
Sucerquia et al. [38] Fall (Old) A+G ADXL345 Waist O 75/898 11 Standard deviation Threshold 10-fold 92.21
magnitude
2018 Liu et al. [29] Fall A OPAL Waist (back) P 494/386 7 Various (54) SVM-RBF 5-fold 94.00
Liu et al. [29] Fall A ADXL345 Waist [38] 1575/1659 15 Various (54) SVM-RBF 5-fold 97.60
2019 Chelli et al. [30] Fall A SG S2+Shimmer Waist [50]+[51] 125/3075 1 Various (66) EBT Hold-out 99.09
Chelli et al. [30] Fall & ADL A SG S2+Shimmer Waist [50]+[51] 125/3075 1 Various (66) EBT Hold-out 94.10
Chen et al. [39] Fall A+G SG S3+SG Mini Trouser pocket [49]+[52] 623/918 12 Various (28) kNN 10-fold 98.30
Hussain et al. [40] Fall A+G ADXL345 Waist [38] 1798/2706 15 Various (12) kNN 10-fold 99.80
Kim et al. [36] Fall A+D E4 wristband Wrist P 136/146 3 Vision/acceleration Rand. Forest 10-fold 90.00
Saadeh et al. [19] Fall A MPU-6050+SG S3 Thigh (upper)+ P+[49] Unknown 6 Sum Vector Square Threshold n/a ∗98.95
Trouser pocket
Šeketa et al. [31] Fall A Various Various Various (6) 749/1702 4 Kangas impact, Threshold n/a ∗,†90.00
velocity, posture
Tahir et al. [33] Fall A x-IMU Pelvis [53] 210/402 3 CNNs ANN 4-fold 92.23
2020 Nho et al. [34] Fall A EBIMU24GV4 Wrist P 2458/8280 6 Various (10) GMMs 10-fold 90.25
Nho et al. [34] Fall A+H EBIMU24GV4 Wrist P 2458/8280 6 Various (13) GMMs 10-fold 92.22
Proposed - Fall A Shimmer Chest O 315/210 9 Various (216/13) SVM/kNN LOSO 98.48
Proposed - Fall & ADL A Shimmer Chest O 315/210 9 Various (13) SVM (ECOC) LOSO 93.90
Notes: * Accuracy computed asSensitivity+2Speci f icity, ** Estimated,†Mean accuracy across datasets, A: Accelerometer, G: Gyroscope, D: Depth sensor, H: Heart rate, P: Proprietary, O:
Table 6. Publicly available accelerometer-based fall and ADL detection datasets.
Dataset Ref. Signals Accelerometer Location Subject Subjects Samples Fall ADL
Name Device Age Fall/NoFall Types Types
Cogent Labs [51] A+G Shimmer Chest, Thigh 18–51 32 320∗/544∗ 6‡ 4
DITEN HAR [50] A+G SG S2 Waist 19–48 30 0/180 0 6
DLR [54] A+O XSens MTx IMU Belt 23–50 16 16∗/96∗ 1 6
Graz [55] A+G Smartphones n/a n/a 5 74/418 4 10
HHAR [56] A+G Smartphones,
Smartwatches
Waist, Arm 25–30 9 0/54 0 6
MobiAct (v2) [57] A+G+O SG S3 Trouser pocket 20–40 66 767/2446 4 12
MobiFall (v2) [49] A+G+O SG S3 Trouser pocket 22–47 24 288/342 4 9
Project gravity [58] A SG S3 Trouser pocket 22–32 2† 72/48 12 7
SisFall [38] A+G ADXL345 Waist 19–30 23 1723/1809 15 19
60–75 15 75/898 11 19
tFall [52] A SG Mini Trouser pocket 20–42 10 503/8000∗ 8 n/a
TST [59] A+D+S Shimmer Waist, Wrist 22–39 11 132/132 4 4
UMAFall [60] A+G+M SG S5, LG G4, MPU-9250
Wrist, Chest, Ankle, Waist, Pocket
18–55 17 209/322 3 8
UniMiB SHAR [61] A SG Nexus I950 Trouser pocket 18–60 30 4192/7759 8 9
UP-Fall [62] A+G+L+ EEG+Inf
Mbientlab Metasensor
Wrist, Neck, Waist, Pocket, Ankle
18–24 17 255∗/306∗ 5 6
UR [53] A+D x-IMU Pelvis >26 5 30/40 3 5
WISDM [63] A+G SG S5/Nexus 5 Trouser pocket 18–25 50† 0/16,200∗ 0 18
LG G watch Wrist
Proposed - A Shimmer v2 Chest 19–34 35 315/210 9 6
Notes:∗Approximated,†Available out of those described in the publication,‡Including loss of balance (near-falls), A: Accelerometer, G: Gyroscope, Inf: Infrared, L: Luminosity, O:
5. Conclusions
In this work we proposed and evaluated an activities of daily living and fall detection methodology based on a triaxial wearable accelerometer and machine learning. Supervised classification experiments on accelerometer data, recorded from 35 volunteers performing various activities and falls while wearing a chest-strapped triaxial accelerometer, showed that the proposed approach was successful in distinguishing between fall and no fall events (max F1-score of 98.41%), as well as between ADL events, including falls (max F1-score 88.11%). For both the binary and multi-class problem, feature selection led to similar or better results, demonstrating that 13 out of the original 216 features are sufficient for achieving high classification performance. Furthermore, although the binary approach (Fall/No Fall) led to a higher classification F1-score compared to the multi-class approach (Fall and ADL), the multi-class approach was proven to be a slightly better fall detector (99.05% sensitivity for the fall class), while at the same time being able to classify non-fall events as specific ADL. The created dataset, named “ShimFall&ADL” will be publicly released to facilitate further research on the field. Future work will include the evaluation of a real-time approach for detecting fall and ADL events from wearable accelerometers.
Author Contributions:Conceptualization, N.R.; Data curation, T.A., S.K. and N.R.; Formal analysis, S.K. and N.R.; Investigation, T.A., S.K. and N.R.; Methodology, T.A., S.K. and N.R.; Project administration, N.R.; Resources, N.R.; Supervision, S.K. and N.R.; Validation, T.A., S.K. and N.R.; Visualization, T.A.and S.K.; Writing—original draft, T.A. and S.K.; Writing—review & editing, T.A., S.K. and N.R. All authors have read and agreed to the published version of the manuscript.
Funding:This work was partially supported by the Northern Border University, and by the ATHIKA project at the University of the West of Scotland under Grant No. 601106-EPP-1-2018-1-ES-EPPKA2-KA.
Conflicts of Interest:The authors declare no conflict of interest. Abbreviations
The following abbreviations are used in this manuscript: ADL Activities of Daily Living
ANN Artificial Neural Network CNN Convolutional Neural Network DT Decision Tree
DWT Discrete Wavelet Transform EBT Ensemble Bagged Tree EEG Electroencephalography ECOC Error-Correcting Output Codes GMM Gaussian Mixture Model HAR Human Activity Recognition kNN k-Nearest Neighbour LDA Linear Discriminant Analysis LSVM Linear Support Vector Machines PCA Principal Component Analysis PSD Power Spectral Density
RSVM Radial basis function kernel Support Vector Machines SoC System-on-Chip
SVM Support Vector Machines WHO World Health Organisation
References
1. Guo, Y.; Tao, D.; Liu, W.; Cheng, J. Multiview Cauchy Estimator Feature Embedding for Depth and Inertial Sensor-Based Human Action Recognition. IEEE Trans. Syst. Man Cybern. Syst.2017,47, 617–627. [CrossRef] 2. Aziz, O.; Musngi, M.; Park, E.J.; Mori, G.; Robinovitch, S.N. A comparison of accuracy of fall detection algorithms (threshold-based vs. machine learning) using waist-mounted tri-axial accelerometer signals from a comprehensive set of falls and non-fall trials.Med. Biol. Eng. Comput.2017,55, 45–55. [CrossRef] [PubMed] 3. Vishwakarma, S.; Agrawal, A. A survey on activity recognition and behavior understanding in video
surveillance. Vis. Comput.2013,29, 983–1009. [CrossRef]
4. Jablonsky, N.; McKenzie, S.; Bangay, S.; Wilkin, T. Evaluating Sensor Placement and Modality for Activity Recognition in Active Games. InACSW ’17: Proceedings of the Australasian Computer Science Week Multiconference, Geelong, Victoria, 1 –3 February 2017; ACM: New York, NY, USA, 2017; pp. 61:1–61:8. [CrossRef]
5. Tripathi, R.K.; Jalal, A.S.; Agrawal, S.C. Suspicious human activity recognition: a review. Artif. Intell. Rev. 2017. [CrossRef]
6. Georgievski, I.; Nguyen, T.A.; Nizamic, F.; Setz, B.; Lazovik, A.; Aiello, M. Planning meets activity recognition: Service coordination for intelligent buildings.Pervasive Mob. Comput.2017,38, 110–139. [CrossRef] 7. Lara, O.D.; Labrador, M.A. A Survey on Human Activity Recognition using Wearable Sensors.IEEE Commun.
Surv. Tutor.2013,15, 1192–1209. [CrossRef]
8. Rafferty, J.; Nugent, C.D.; Liu, J.; Chen, L. From Activity Recognition to Intention Recognition for Assisted Living Within Smart Homes. IEEE Trans. Hum. Mach. Syst.2017,47, 368–379. [CrossRef]
9. Stavropoulos, T.G.; Papastergiou, A.; Mpaltadoros, L.; Nikolopoulos, S.; Kompatsiaris, I. IoT Wearable Sensors and Devices in Elderly Care: A Literature Review. Sensors2020,20, 2826. [CrossRef]
10. World Health Organisation. WHO Global Report on Falls Prevention in Older Age; World Health Organisation: Geneva, Switzerland, 2008.
11. Vellas, B.J.; Wayne, S.J.; Romero, L.J.; Baumgartner, R.N.; Garry, P.J. Fear of falling and restriction of mobility in elderly fallers. Age Ageing1997,26, 189–193. [CrossRef]
12. Delahoz, Y.; Labrador, M. Survey on Fall Detection and Fall Prevention Using Wearable and External Sensors.
Sensors2014,14, 19806–19842. [CrossRef]
13. Rashidi, P.; Mihailidis, A. A Survey on Ambient-Assisted Living Tools for Older Adults. IEEE J. Biomed. Health Inform.2013,17, 579–590. [CrossRef]
14. Li, Y.; Ho, K.C.; Popescu, M. A Microphone Array System for Automatic Fall Detection. IEEE Trans. Biomed. Eng.2012,59, 1291–1301. [CrossRef] [PubMed]
15. Mirmahboub, B.; Samavi, S.; Karimi, N.; Shirani, S. Automatic Monocular System for Human Fall Detection Based on Variations in Silhouette Area. IEEE Trans. Biomed. Eng.2013,60, 427–436. [CrossRef] [PubMed]
16. Ozcan, K.; Velipasalar, S.; Varshney, P.K. Autonomous Fall Detection With Wearable Cameras by Using Relative Entropy Distance Measure. IEEE Trans. Hum. Mach. Syst.2017,47, 31–39. [CrossRef]
17. Rimminen, H.; Lindström, J.; Linnavuo, M.; Sepponen, R. Detection of falls among the elderly by a floor sensor using the electric near field.IEEE Trans. Inf. Technol. Biomed.2010,14, 1475–1476. [CrossRef] 18. Mukhopadhyay, S.C. Wearable Sensors for Human Activity Monitoring: A Review. IEEE Sens. J.
2015,15, 1321–1330. [CrossRef]
19. Saadeh, W.; Butt, S.A.; Altaf, M.A.B. A Patient-Specific Single Sensor IoT-Based Wearable Fall Prediction and Detection System. IEEE Trans. Neural Syst. Rehabil. Eng.2019,27, 995–1003. [CrossRef]
20. Vavoulas, G.; Pediaditis, M.; Spanakis, E.G.; Tsiknakis, M. The MobiFall dataset: An initial evaluation of fall detection algorithms using smartphones. In Proceedings of the 13th IEEE International Conference on BioInformatics and BioEngineering, Chania, Greece, 10–13 November 2013. [CrossRef]
21. Kau, L.; Chen, C. A Smart Phone-Based Pocket Fall Accident Detection, Positioning, and Rescue System.
IEEE J. Biomed. Health Inform.2015,19, 44–56. [CrossRef]
22. Saadeh, W.; Altaf, M.A.B.; Altaf, M.S.B. A high accuracy and low latency patient-specific wearable fall detection system. In Proceedings of the 2017 IEEE EMBS International Conference on Biomedical Health Informatics (BHI), Orlando, FL, USA, 16–19 February 2017; pp. 441–444. [CrossRef]
23. Nguyen, T.H.; Pham, T.P.; Ngo, C.Q.; Nguyen, T.T. A SVM Algorithm for Investigation of Tri-Accelerometer Based Falling Data. Am. J. Signal Process.2016,6, 56–65. [CrossRef]
24. Catal, C.; Tufekci, S.; Pirmit, E.; Kocabag, G. On the Use of Ensemble of Classifiers for Accelerometer-based Activity Recognition.Appl. Soft Comput.2015,37, 1018–1022. [CrossRef]
25. Huynh, Q.T.; Nguyen, U.D.; Liem, K.T.; Tran, B.Q., Detection of Activities Daily Living and Falls Using Combination Accelerometer and Gyroscope. In5th International Conference on Biomedical Engineering in Vietnam; Springer International Publishing: Cham, Switzerland, 2015; pp. 184–189. [CrossRef]
26. Ali, A.A.S.; Siupik, M.; Amira, A.; Bensaali, F.; Casaseca-de-la-Higuera, P. HLS based hardware acceleration on the zynq SoC: A case study for fall detection system. In Proceedings of the 2014 IEEE/ACS 11th International Conference on Computer Systems and Applications (AICCSA), Doha, Qatar, 10–13 November 2014; pp. 685–690. [CrossRef]
27. Abdelhedi, S.; Baklouti, M.; Bourguiba, R.; Mouine, J. Design and implementation of a fall detection system on a Zynq board. In Proceedings of the 2016 IEEE/ACS 13th International Conference of Computer Systems and Applications (AICCSA), Agadir, Morocco, 29 November–2 December 2016; pp. 1–7. [CrossRef] 28. Abunahia, D.G.; Ismail, T.A.; Ola, H.R.A.A.; Amira, A.; Ali, A.A.S.; Bensaali, F. A Reconfigurable Connected
Health Platform Using ZYNQ System on Chip. In Proceedings of SAI Intelligent Systems Conference (IntelliSys) 2016, London, UK, 21–22 September 2016. [CrossRef]
29. Liu, K.; Hsieh, C.; Hsu, S.J.; Chan, C. Impact of Sampling Rate on Wearable-Based Fall Detection Systems Based on Machine Learning Models. IEEE Sens. J.2018,18, 9882–9890. [CrossRef]
30. Chelli, A.; Pätzold, M. A Machine Learning Approach for Fall Detection and Daily Living Activity Recognition. IEEE Access2019,7, 38670–38687. [CrossRef]
31. Šeketa, G.; Pavlakovi´c, L.; Žulj, S.; Džaja, D.; Lackovi´c, I.; Magjarevi´c, R. Comparison of Human Fall Acceleration Signals Among Different Datasets. InFuture Trends in Biomedical and Health Informatics and Cybersecurity in Medical Devices; Lin, K.P., Magjarevic, R., de Carvalho, P., Eds.; Springer International Publishing: Cham, Switzerland, 2020; pp. 413–419. [CrossRef]
32. Casilari, E.; Lora-Rivera, R.; García-Lagos, F. A Study on the Application of Convolutional Neural Networks to Fall Detection Evaluated with Multiple Public Datasets. Sensors2020,20, 1466. [CrossRef]
33. Tahir, A.; Ahmad, J.; Morison, G.; Larijani, H.; Gibson, R.M.; Skelton, D.A. HRNN4F: Hybrid Deep Random Neural Network for Multi-channel Fall Activity Detection. Probab. Eng. Inf. Sci.2019, 1–14. [CrossRef] 34. Nho, Y.; Lim, J.G.; Kwon, D. Cluster-Analysis-Based User-Adaptive Fall Detection Using Fusion of Heart
Rate Sensor and Accelerometer in a Wearable Device. IEEE Access2020,8, 40389–40401. [CrossRef] 35. Kwolek, B.; Kepski, M. Improving fall detection by the use of depth sensor and accelerometer.Neurocomputing
2015,168, 637–645. [CrossRef]
36. Kim, K.; Yun, G.; Park, S.; Kim, D.H. Fall Detection for the Elderly Based on 3-Axis Accelerometer and Depth Sensor Fusion with Random Forest Classifier. In Proceedings of the 2019 41st Annual International Conference of the IEEE Engineering in Medicine and Biology Society (EMBC), Berlin, Germany, 23–27 July 2019; pp. 4611–4614. [CrossRef]
37. Kong, A.; Tang, J.K.T.; Ng, W.; Li, J.K.L. Exploring Favorable Positions of Wearable Smart Sensors to Falls Detection: Smart Living for Elderly. In Proceedings of the 2019 3rd International Conference on Smart Grid and Smart Cities (ICSGSC), Berkeley, CA, USA, 25–28 June 2019; pp. 92–100. [CrossRef]
38. Sucerquia, A.; López, J.; Vargas-Bonilla, J. SisFall: A Fall and Movement Dataset. Sensors2017,17, 198. [CrossRef] [PubMed]
39. Chen, X.; Xue, H.; Kim, M.; Wang, C.; Youn, H.Y. Detection of Falls with Smartphone Using Machine Learning Technique. In Proceedings of the 2019 8th International Congress on Advanced Applied Informatics (IIAI-AAI), Toyama, Japan, 7–11 July 2019; pp. 611–616. [CrossRef]
40. Hussain, F.; Hussain, F.; Ehatisham-ul-Haq, M.; Azam, M.A. Activity-Aware Fall Detection and Recognition Based on Wearable Sensors.IEEE Sens. J.2019,19, 4528–4536. [CrossRef]
41. Fish, R.D.A.; Messenger, H.; Baryudin, L.; Dardashti, S.S.; Goldshtein, E. Fall Detection System Using a Combination of Accelerometer, Audio Input and Magnetometer. United States Patent Application Pub No. US 2019/0170783 A1, 6 January 2019.
42. Burns, A.; Greene, B.R.; McGrath, M.J.; O’Shea, T.J.; Kuris, B.; Ayer, S.M.; Stroiescu, F.; Cionca, V. SHIMMER: A Wireless Sensor Platform for Noninvasive Biomedical Research. IEEE Sens. J.2010, 10, 1527–1534. [CrossRef]
44. Ahmed, N.; Rafiq, J.I.; Islam, M.R. Enhanced Human Activity Recognition Based on Smartphone Sensor Data Using Hybrid Feature Selection Model. Sensors2020,20, 317. [CrossRef]
45. Heinzel, G.; Rüdiger, A.; Schilling, R.Spectrum and Spectral Density Estimation by the Discrete Fourier Transform (DFT), Including a Comprehensive List of Window Functions and Some New at-top Windows; Technical report; Max Planck Society: Munich, Germany, 2002.
46. Dietterich, T.G.; Bakiri, G. Solving Multiclass Learning Problems via Error-correcting Output Codes. J. Artif. Int. Res.1995,2, 263–286. [CrossRef]
47. Bagalà, F.; Becker, C.; Cappello, A.; Chiari, L.; Aminian, K.; Hausdorff, J.M.; Zijlstra, W.; Klenk, J. Evaluation of Accelerometer-Based Fall Detection Algorithms on Real-World Falls.PLoS ONE2012,7, e37062. [CrossRef] 48. Althobaiti, T.; Katsigiannis, S.; Ramzan, N.ShimFall&ADL: Triaxial Accelerometer Fall and Activities of Daily
Living Detection Dataset; Zenodo: Geneva, Switzerland, 2015. [CrossRef]
49. Vavoulas, G.; Pediaditis, M.; Chatzaki, C.; Spanakis, E.; Tsiknakis, M. The MobiFall Dataset: Fall Detection and Classification with a Smartphone. Int. J. Monit. Surveill. Technol. Res.2016,2, 44–56. [CrossRef] 50. Anguita, D.; Ghio, A.; Oneto, L.; Parra, X.; Reyes-Ortiz, J.L. A Public Domain Dataset for Human Activity
Recognition using Smartphones. In Proceedings of the European Symposium on Artificial Neural Networks, Computational Intelligence and Machine Learning (ESANN), Bruges, Belgium, 24–26 April 2013.
51. Ojetola, O.; Gaura, E.; Brusey, J. Data Set for Fall Events and Daily Activities from Inertial Sensors. In Proceedings of the 6th ACM Multimedia Systems Conference, MMSys ’15, Portland, OR, USA, 18–20 March 2015; Association for Computing Machinery: New York, NY, USA, 2015; pp. 243–248. [CrossRef] 52. Medrano, C.; Igual, R.; Plaza, I.; Castro, M. Detecting Falls as Novelties in Acceleration Patterns Acquired
with Smartphones.PLoS ONE2014,9, e94811. [CrossRef]
53. Kwolek, B.; Kepski, M. Human fall detection on embedded platform using depth maps and wireless accelerometer.Comput. Methods Programs Biomed.2014,117, 489 – 501. [CrossRef] [PubMed]
54. Frank, K.; Vera Nadales, M.J.; Robertson, P.; Pfeifer, T. Bayesian Recognition of Motion Related Activities with Inertial Sensors. In Proceedings of the 12th ACM International Conference Adjunct Papers on Ubiquitous Computing—Adjunct (UbiComp ’10 Adjunct), Copenhagen, Denmark, 26–29 September 2010; pp. 445–446. [CrossRef]
55. Wertner, A.; Czech, P.; Pammer-Schindler, V. An Open Labelled Dataset for Mobile Phone Sensing Based Fall Detection. In Proceedings of the 12th EAI International Conference on Mobile and Ubiquitous Systems: Computing, Networking and Services on 12th EAI International Conference on Mobile and Ubiquitous Systems: Computing, Networking and Services (MOBIQUITOUS’15), Coimbra, Portugal, 22–24 July 2015; pp. 277–278. [CrossRef]
56. Stisen, A.; Blunck, H.; Bhattacharya, S.; Prentow, T.S.; Kjærgaard, M.B.; Dey, A.; Sonne, T.; Jensen, M.M. Smart Devices Are Different: Assessing and Mitigating Mobile Sensing Heterogeneities for Activity Recognition. In Proceedings of the 13th ACM Conference on Embedded Networked Sensor Systems (SenSys ’15), Seoul, South Korea, 1–4 November 2015; p. 127–140. [CrossRef]
57. Vavoulas, G.; Chatzaki, C.; Malliotakis, T.; Pediaditis, M.; Tsiknakis., M. The MobiAct Dataset: Recognition of Activities of Daily Living using Smartphones. In Proceedings of the International Conference on Information and Communication Technologies for Ageing Well and e-Health—Volume 1: ICT4AWE, (ICT4AGEINGWELL 2016), INSTICC, Rome, Italy, 21–22 April 2016; SciTePress: Setúbal, Portugal, 2016; pp. 143–151. [CrossRef]
58. Vilarinho, T.; Farshchian, B.; Bajer, D.G.; Dahl, O.H.; Egge, I.; Hegdal, S.S.; Lønes, A.; Slettevold, J.N.; Weggersen, S.M. A Combined Smartphone and Smartwatch Fall Detection System. In Proceedings of the 2015 IEEE International Conference on Computer and Information Technology, Ubiquitous Computing and Communications, Dependable, Autonomic and Secure Computing, Pervasive Intelligence and Computing, Liverpool, UK, 26–28 October 2015; pp. 1443–1448. [CrossRef]
59. Gasparrini, S.; Cippitelli, E.; Gambi, E.; Spinsante, S.; Wåhslén, J.; Orhan, I.; Lindh, T. Proposal and Experimental Evaluation of Fall Detection Solution Based on Wearable and Depth Data Fusion. In Proceedings of the ICT Innovations 2015, Ohrid, North Macedonia, 1–4 October 2015; Springer International Publishing: Cham, Switzerland, 2016; pp. 99–108. [CrossRef]
60. Casilari, E.; Santoyo-Ramón, J.A.; Cano-García, J.M. UMAFall: A Multisensor Dataset for the Research on Automatic Fall Detection. Procedia Comput. Sci.2017,110, 32–39. [CrossRef]
61. Micucci, D.; Mobilio, M.; Napoletano, P. UniMiB SHAR: A Dataset for Human Activity Recognition Using Acceleration Data from Smartphones.Appl. Sci.2017,7, 1101. [CrossRef]
62. Martínez-Villaseñor, L.; Ponce, H.; Brieva, J.; Moya-Albor, E.; Núñez-Martínez, J.; Peñafort-Asturiano, C. UP-Fall Detection Dataset: A Multimodal Approach. Sensors2019,19, 1988. [CrossRef]
63. Weiss, G.M.; Yoneda, K.; Hayajneh, T. Smartphone and Smartwatch-Based Biometrics Using Activities of Daily Living. IEEE Access2019,7, 133190–133202. [CrossRef]
c
2020 by the authors. Licensee MDPI, Basel, Switzerland. This article is an open access article distributed under the terms and conditions of the Creative Commons Attribution (CC BY) license (http://creativecommons.org/licenses/by/4.0/).