9HSTFM
G*agdaj
g+
ISBN 978-952-60-6309-6 (printed) ISBN 978-952-60-6310-2 (pdf) ISSN-L 1799-4934 ISSN 1799-4934 (printed) ISSN 1799-4942 (pdf) Aalto University School of ScienceDepartment of Computer Science www.aalto.fi BUSINESS + ECONOMY ART + DESIGN + ARCHITECTURE SCIENCE + TECHNOLOGY CROSSOVER DOCTORAL DISSERTATIONS A a lto -D D 1 0 5 /2 0 1 5 S u le im an A li K h an B ay es ia n m u lt i-v ie w m o d el s f o r d at a-d ri v en d ru g r es p o n se a n al y si s A a lt o U n iv e rs it y
Department of Computer Science
Bayesian multi-view models
for data-driven
drug response analysis
Suleiman Ali Khan
DOCTORAL DISSERTATIONS
Aalto University publication series DOCTORAL DISSERTATIONS 105/2015
Bayesian multi-view models for
data-driven drug response analysis
Suleiman Ali Khan
A doctoral dissertation completed for the degree of Doctor of Science (Technology) to be defended, with the permission of the Aalto University School of Science, at a public examination held at the Auditorium U4 of the school on 7th September 2015 at 12 noon.
Aalto University School of Science
Supervising professor Prof. Samuel Kaski Preliminary examiners
Prof. Sampsa Hautaniemi, University of Helsinki, Finland Prof. Manfred Claassen, Institute of Molecular Systems Biology, ETH Zurich, Switzerland
Opponent
Asst. Prof. Sara Mostafavi, University of British Columbia, Canada
Aalto University publication series DOCTORAL DISSERTATIONS 105/2015
© Suleiman Ali Khan
ISBN 978-952-60-6309-6 (printed) ISBN 978-952-60-6310-2 (pdf) ISSN-L 1799-4934 ISSN 1799-4934 (printed) ISSN 1799-4942 (pdf) http://urn.fi/URN:ISBN:978-952-60-6310-2 Unigrafia Oy Helsinki 2015 Finland
Abstract
Aalto University, P.O. Box 11000, FI-00076 Aalto www.aalto.fi
Author
Suleiman Ali Khan
Name of the doctoral dissertation
Bayesian multi-view models for data-driven drug response analysis Publisher School of Science
Unit Department of Computer Science
Series Aalto University publication series DOCTORAL DISSERTATIONS 105/2015 Field of research Information and Computer Science
Manuscript submitted 29 April 2015 Date of the defence 7 September 2015 Permission to publish granted (date) 26 June 2015 Language English Monograph Article dissertation (summary + original articles)
Abstract
A central challenge faced by biological and medical research is to understand the impact of chemical entities on living cells. Identifying the relationships between the chemical structures and their cellular responses is valuable for improving drug design and targeted therapies. The chemical structures and their detailed molecular responses need to be combined through a systematic analysis to learn the complex dependencies, which can then assist in improving understanding of the molecular mechanisms of drugs as well as predictions on the effects of unknown molecules. Moreover, with emerging drug-response data sets being profiled over several disease types and phenotypic details, it is pertinent to develop advanced computational methods that can be used to study multiple sets of data together.
In this thesis, a novel multi-disciplinary challenge is undertaken for computationally analyzing interactions between multiple biological responses and chemical properties of drugs, while simultaneously advancing the computational methods to better learn these interactions. Specifically, multi-view dependency modeling of paired data sets is formulated as a means of systematically studying the drug-response relationships. First, the systematic analysis of drug structures and their genome-wide responses is presented as a multi-set dependency modeling problem and established methods are adopted to test the novel hypothesis.
Several novel extensions of the drug-response analysis are then presented that explore responses measured over multiple disease types and multiple levels of phenotypic detail, uncovering novel biological insights of potential impact. These analyses are made possible by novel advancements in multi-view methods. Specifically, the first Bayesian tensor canonical correlation analysis and its extensions are introduced to capture the underlying multi-way structure and applied in analyzing novel toxicogenomic interactions. The results illustrate that modeling the precise multi-view and multi-way formulation of the data is valuable for discovering interpretable latent components as well as for the prediction of unseen responses of drugs.
Therefore, the original contribution to knowledge in this dissertation is two-fold: first, the data-driven identification of relationships between structural properties of drugs and their genome-wide responses in cells and, second, novel advancements of multi-view methods that find dependencies between paired data sets. Open source implementations of the new methods have been released to facilitate further research.
Keywords Bayesian modeling, Machine learning, Multi-view learning, Computational biology, Bioinformatics, Toxicogenomics, Latent variable models, Bayesian tensor CCA ISBN (printed) 978-952-60-6309-6 ISBN (pdf) 978-952-60-6310-2
ISSN-L 1799-4934 ISSN (printed) 1799-4934 ISSN (pdf) 1799-4942 Location of publisher Helsinki Location of printing Helsinki Year 2015
Preface
This work has been carried out in the Statistical Machine Learning and Bioinformatics (MI) group in the Department of Computer Science (for-merly known as Department of Information and Computer Science), Aalto University School of Science, Finland. I have had the privilege of being a member of the Finnish Center of Excellence in Computational Inference Research (COIN) as well as the Helsinki Institute of Information Tech-nology (HIIT), both of which have provided a vast exposure and excellent networking with top researchers in the field. This research and thesis has been funded by the Academy of Finland project Computational mod-eling of the biological effects of chemicals (grant no. 140057), the Finnish Doctoral Programme in Computational Sciences (FICS), and the Finnish Foundation for Technology Promotion.
I am grateful to my supervisor Prof. Samuel Kaski for teaching me the principles of science and for giving me the opportunity to work in a fully interdisciplinary field with top-notch collaborations. I feel deeply privi-leged to have learned so much from a top researcher! I wish to especially thank Prof. Olli Kallioniemi, Director of Institute of Molecular Medicine Finland (FIMM), Dr. Krister Wennerberg from Cancer Chemical Systems Biology group at FIMM, and Prof. Antti Poso from Drug Design Lab-oratory at University of Eastern Finland, both for their guidance in the collaborative research, and for teaching me how to envision a multitude of outcomes from such a multidisciplinary setup. Your contributions extend way beyond what we have written together! This outstanding multidisci-plinary environment has enabled me to acquire skills in both statistical machine learning and computational systems biology.
My sincere compliments belong to all co-authors, especially Ali Faisal, Juuso Parkkinen, Seppo Virtanen, Mehmet Gönen and Eemeli Leppäaho. It has been a pleasure working with you all! During these years, I have got
Preface
to know many wonderful colleagues at the MI research group. Therefore I would like to thank all the current and former members of the group, es-pecially Muhammad Ammad-ud-din, Elisabeth Georgii, Leo Lahti, Sohan Seth, Arto Klami, Jaakko Peltonen, Sami Remes, Antti Honkela, Tommi Suvitaival and Jussi Gillberg for fruitful discussions on science as well as life in general.
I would like to thank the pre-examiners Prof. Sampsa Hautaniemi and Prof. Manfred Claassen for their valuable comments. A special thanks is also attributed to Dr. Tero Aittokallio and his group at Institute of Molecular Medicine Finland for their interest in my work. I would also like to express my gratitude towards all the friends for the shared mo-ments especially those at weekly tea, Aqdas Malik, Hussnain Ahmed, Rao Anwer and Adnan Ghani.
Finally, I am indebted to my parents for their consistent support and prayers throughout my doctoral studies. I would like to especially thank my mother, who along with so many other things also made my founda-tions in mathematics, which made related subjects easier to me through-out my career; and my father, for inculcating in me the freedom of choice. I am also extremely grateful to my brothers and sisters for the continu-ous support they provided, not only through the doctoral studies, but all throughout. Lastly, I wish to thank my wife and our children Mansur and Maimunah for absolutely everything.
Espoo, July 29, 2015,
Contents
Preface 1 Contents 3 List of Publications 5 Author’s Contribution 7 1. Introduction 111.1 Contributions and Organization of the thesis . . . 13
2. Bayesian machine learning and factorizations 17 2.1 Latent variable models . . . 17
2.2 Matrix factorization and co-occurring patterns . . . 18
2.3 Tensor factorizations . . . 20
2.3.1 CANDECOMP/PARAFAC (CP) . . . 21
2.3.2 Tucker . . . 23
2.4 Bayesian modeling . . . 24
2.5 Inference and Gibbs sampling . . . 25
3. Biological responses to drugs 27 3.1 Gene expression measurements . . . 27
3.2 Drug sensitivity measurements . . . 30
3.3 Structural descriptors . . . 31
3.3.1 2D fingerprints . . . 31
3.3.2 3D descriptors . . . 32
4. Multi-view models for drug responses 35 4.1 Canonical correlation analysis for drug responses . . . 36
4.1.1 Dependency modeling via canonical correlations . . . 37
Contents
4.2 Group factor analysis for drug responses . . . 41
4.2.1 Dependency modeling via group factor analysis . . . 41
4.2.2 Bayesian sparse group factor analysis . . . 44
4.2.3 Multi-response relationships . . . 46
4.3 Multi-source prediction of targets . . . 48
4.3.1 Kernelized Bayesian matrix factorization . . . 49
4.3.2 Multi-structure prediction . . . 49
5. Multi-tensor factorizations for drug responses 51 5.1 Bayesian multi-view tensor factorization . . . 52
5.2 Bayesian coupled matrix-tensor factorization . . . 55
5.3 Toxicogenomics dependencies . . . 57
6. Discussion and conclusions 61
Bibliography 65
List of Publications
This thesis consists of an overview and of the following publications which are referred to in the text by their Roman numerals.
ISuleiman A Khan, Ali Faisal, John P Mpindi, Juuso A Parkkinen, Tuomo Kalliokoski, Antti Poso, Olli P Kallioniemi, Krister Wennerberg and Samuel Kaski. Comprehensive data-driven analysis of the impact of chemoinformatic structure on the genome-wide biological response pro-files of cancer cells to 1159 drugs.BMC Bioinformatics, 13:112, 2012.
IISeppo Virtanen, Arto Klami, Suleiman A Khan and Samuel Kaski. Bayesian Group Factor Analysis. InProceedings of the Fifteenth Inter-national Conference on Artificial Intelligence and Statistics AISTATS, JMLR W&CP, 22:1269–1277, 2012.
IIISuleiman A Khan, Seppo Virtanen, Olli P Kallioniemi, Krister Wen-nerberg, Antti Poso and Samuel Kaski. Identification of structural fea-tures in chemicals associated with cancer drug response: A systematic data-driven analysis. InProceedings of the Thirteenth European Con-ference on Computational Biology ECCB, Bioinformatics, 30:i497–i504, 2014.
IV Mehmet Gönen, Suleiman A Khan and Samuel Kaski. Kernelized Bayesian Matrix Factorization. InProceedings of the Twenty-Ninth In-ternational Conference on Machine Learning ICML, JMLR W&CP, 28: 864–872, 2012.
List of Publications
V Suleiman A Khan and Samuel Kaski. Bayesian Multi-View Tensor Fac-torization. In Proceedings of the Seventh European Conference on Ma-chine Learning and Principles and Practice of Knowledge Discovery in Databases ECML PKDD, editors T. Calders et al., Springer-Verlag Berlin Heidelberg, 8724:656-671, 2014.
VI Suleiman A Khan, Eemeli Leppäaho and Samuel Kaski. Multi-Tensor Factorization. Submitted to a journal, 23 pages, 2015.
Author’s Contribution
Publication I: “Comprehensive data-driven analysis of the impact of chemoinformatic structure on the genome-wide biological response profiles of cancer cells to 1159 drugs”
The ideas and experiments presented in this article were designed jointly. In particular, the author implemented the data fusion with canonical cor-relations and the analysis and visualization pipeline. The writing of the article was a combined effort.
Publication II: “Bayesian Group Factor Analysis”
The author designed and carried out the drug-response case study and participated in writing the article. Dr. Virtanen had the main responsi-bility of the model and other experiments.
Publication III: “Identification of structural features in chemicals associated with cancer drug response: A systematic data-driven analysis”
The article was jointly designed and written. The author participated in the model implementation, and implemented and carried out all the experiments and visualizations.
Publication IV: “Kernelized Bayesian Matrix Factorization”
The author designed and carried out the second drug protein interaction case study and participated in writing the article. Dr. Gönen had the
Author’s Contribution
main responsibility of the model, experiments and writing of the article.
Publication V: “Bayesian Multi-View Tensor Factorization”
The author had the main responsibility for the design and implementa-tion of the model, experiments, and for the preparaimplementa-tion of the article. The main modelling idea was developed jointly.
Publication VI: “Multi-Tensor Factorization”
The author had the main responsibility of the initial idea, design and implementation of the MTF model, and conducted the molecular biology experiments. Mr. Leppäaho designed and implemented the relaxed for-mulation and conducted the neuroimaging experiments. The manuscript was written jointly.
List of Abbreviations and Symbols
Abbreviations
ARD automatic relevance determination ATC anatomical therapeutic chemical classification CCA canonical correlation analysis CP canonical decomposition / parallel factor analysis DNA deoxyribonucleic acid FCFP functional connectivity fingerprints
GO gene ontology
GSEA gene set enrichment analysis MCMC Markov chain Monte Carlo
RNA ribonucleic acid
siRNA silencing RNA
List of Abbreviations and Symbols
Symbols
In this thesis caligraphic symbols (for exampleX) are used to denote ten-sors, bold uppercase to signify matrices (X), and bold lowercase column vectors (x). Normal lowercase symbols (x) indicate scalar variables.
R real domain
x,y scalar data point
x,y data vectors
X,Y data matrix
XT transpose of matrixX
X,Y data tensor
N(μ, σ2) Gaussian distribution with meanμand varianceσ2
Gamma(α, β) gamma distribution with shapeαand rateβ Beta(α, β) beta distribution with shape parametersαandβ Bernoulli(π) Bernoulli distribution with probabilityπ p(X|Y) conditional probability distribution ofX givenY
I identity matrix
λ scalar, regularization parameter
log(.) logarithmic function
◦ outer product of two vectors
Khatri-Rao product of two matrices, reshaped into a tensor
×k modekproduct of a tensor and a matrix
1. Introduction
One of the fundamental challenges for life sciences in general, and medicine in particular, is to understand how chemical entities in food, medicines, and environment affect living cells. This is difficult because the chemicals are expected to produce multiple and overwhelmingly diverse responses. Genome-wide measurements of these responses such as the gene expres-sion, can provide insights into the system-level understanding and action mechanisms [1, 2]. With millions of available compounds and the mul-titude of responses of cells, understanding the effects of drugs is a chal-lenging yet significantly important goal. A key challenge here is to learn the complex dependencies between the structures and their genome-wide responses. These dependencies can assist in better understanding the ef-fects of drugs, as well as to make predictions of efef-fects for previously un-seen molecules. Therefore, if uncovered, these dependencies may assist in significantly enhancing optimization efforts on design, re-purposing and personalized applications of the drugs.
Traditionally, cellular response data has been scarce and has hosted only a few samples. These limited measurements have been only par-tially relevant as they present a view of the response to specific condi-tions only. With advancements in high-throughput response measure-ment techniques, data sets are being profiled that measure genome-wide effects of chemical perturbations on multiple specialized cells [3]. This knowledge offers the opportunity to study the diverse responses, over sev-eral different cell-types in a systematic fashion.
One plausible direction is to harness the existing measurement data and apply computational approaches to predict the relationships between structural aspects of the drugs and the observed systems-wide biological responses. On the computational front, machine learning is playing an important role in developing methods to analyze data. Lately, Bayesian
Introduction
machine learning has become increasingly valuable allowing principled means of handling uncertainty in the model parameters and incorpora-tion of the prior probabilities, which make it possible to study data even with small sample sizes. In this work, generative latent variable models enable building representations that explain the processes that have gen-erated the observed data [4, 5]. By discovering the descriptions of these underlying processes, one can potentially understand them or produce the required predictions.
When the task is to search for relationships between two or more ables, machine learning approaches that model dependencies among vari-ables fit the goal directly. These methods seek co-occurring patterns that relate the variables of interest. Component-based dependency models are additionally able to segregate multiple distinct dependencies existing in the data. For example, factor analysis is a commonly used method that captures dependencies between variables into distinct factors, with each factor capturing different dependencies [6, 7]. Methods such as the canon-ical correlation analysis [CCA; 8, 9] identify dependencies between two data sets, decomposing them into distinct components. Recent advances in Bayesian factor analysis and canonical correlation analysis have made them practically applicable in many real-world scenarios [10, 11].
The central hypothesis of this dissertation is that component-based dependency modeling can be used to systematically study the systems-wide responses of cells to drugs and their structures, uncovering the links between them in a data-driven fashion. Here the basic assumption is that the common statistical patterns existing between the datasets repre-sent underlying mechanistic processes. These processes are hypothesized to be informative for the action mechanisms of the drugs, i.e. the bio-chemical interactions through which a drug produces its pharmacological effect. Analyzing the responses of multiple types of cells brings up the re-quirement for new multi-source methods. Moreover, even more structured methods are needed for studying hypothesis that emerge when responses are measured at several levels of phenotypic details. This thesis starts by adapting canonical correlations for the structure-response modeling to test the basic premise. It then presents several novel multi-source models that remove some of the limitations of existing methods and applies them to novel drug response analysis problems.
Typically, the action mechanisms of drugs have been studied compu-tationally using chemical properties of the drugs or biological properties
Introduction
of the specific targets [12]. Approaches such as the quantitative structure-activity analysis (QSAR) commonly use structural properties of the drugs to predict their biological activity. For example, the classical QSAR work by Cramer et al. [13] predicted a single biological activity from structural features of the drugs. However, recent evidence suggests the importance of tailoring the drugs for multiple targets to enhance their efficacy [14]. Moreover, drugs interacting with several targets may also produce toxic-ity and other side effects. Therefore, balancing the efficacy vs. toxictoxic-ity is a crucially important problem. On the other hand, genome-wide responses to drugs have also been successfully used in explaining the mechanisms of drug actions [15, 16]. However, to the best of our knowledge, the system-atic integration of these complementary approaches, to study structure-response relationships with component-based dependency models, has not been explored earlier.
Therefore, this research is positioned at the intersection of three dif-ferent fields: machine learning, bioinformatics, and chemoinformatics.
1.1 Contributions and Organization of the thesis
This thesis presents several novel multi-view dependency modeling meth-ods and explores their applicability for the data-driven decomposition of drug structure-response links. The applications utilize the drug response interactions for both understanding the underlying processes and the pre-diction of unseen responses.
Publication I adapts the existing canonical correlation model family, hypothesizing the latent components as descriptions of underlying drug response mechanisms. This formulation extends the drug response anal-ysis from standard QSAR, which relates drug properties with their uni-variate responses, to finding relationships between structural descrip-tors of the drugs and their genome-wide responses. The paper demon-strates that component-based dependency modeling can successfully cap-ture struccap-ture-related drug response patterns in a data-driven fashion.
Publications II and III generalize the analysis to multiple diseases, with novel multi-view model formulations. Specifically, the group factor analysis (GFA) model carries out a data-driven search for relationships between the chemical properties of the drug molecules and their disease-specific biological response profiles. The relationships governed by dis-tinct underlying biological processes are segregated automatically by the
Introduction
sparse factorization. This ability of GFA makes it possible to distinguish between responses that are disease-specific from those common to all the disease types analyzed. A focused experiment was carried out to study this in Publication II. When exposed to genome-wide data sets, a criti-cal challenge for algorithms is the high dimensionality and small sample size of the data. The small number of samples leave considerable un-certainty in the data, and prioritizing the interacting features becomes a major concern. In Publication III, feature-level sparsity is applied in GFA to cater for these concerns, and a detailed structure-response analysis is performed. The study demonstrated that data-driven modeling of drug responses in multiple diseases can be informative for identifying estab-lished and novel structure-response links, as well as for exploring disease-specific action mechanisms. Such systematic large-scale studies can also identify new repositioning opportunities for existing drugs. If validated with wet lab experiments, the approach may also open up the opportunity for drug designers to tailor drug molecules based on the genome-wide re-sponses of existing drugs.
Publication IV addresses the analogous problem of predicting drug targets from a multi-source formulation. The paper advances the state of the art by concluding that protein targets of the drugs can be better predicted when multiple types of descriptions of the drugs are used as side information sources.
Publication V introduces a new problem formulation and presents a model called Bayesian multi-view tensor factorization (BMTF) for solving it. BMTF learns dependencies between multiple co-occurring tensors com-prehensively, decomposing them into a set of underlying factors that can be shared between some or all of the tensors. This paper advances the state of the art by making it possible to jointly factorize the multi-view tensor data sets. In short, there is now a model similar to Bayesian CCA but for tensors. The method is applied to decompose drug responses of multiple diseases at different levels of phenotypic detail, helping applica-tion experts to construct targeted hypotheses for the underlying processes generating the data.
Publication VI presents a new model for joint factorization of mul-tiple matrices and tensors, coined multi-tensor factorization (MTF). The method generalizes the matrix-tensor factorization to novel Bayesian multi-view settings as well as factorization of arbitrary sets of tensors. The model factorizes multiple matrices and tensors collectively, allowing
in-Introduction
vestigation of relationships that may exist between some or all of them. The new model also addresses several key practical issues in a princi-pled fashion. The Bayesian formulation provides improved performance in real-world applications with small samples and large dimensions of the matrix-tensor data sets. The paper finally presents the decomposition of structurally driven responses of multiple diseases when integrating re-sponses from various levels of phenotypic detail. Thereby, demonstrating that the method can assist application scientists to explore and predict drug response mechanisms, by integrating the data sets of choice.
Chapter 2 discusses the matrix and tensor factorization methods that form the basis of this thesis. In particular, it presents the relevant as-sumptions of these approaches that are harnessed for both the applica-tions and machine learning advancements. Chapter 3 discusses the bio-logical responses to drugs, the measurement data sets, and the structural properties of chemical compounds. Chapters 4 and 5 present the main contributions of the thesis, describing the different multi-source models while increasing the amount of structure they capture as the thesis pro-gresses. The chapters simultaneously discuss the corresponding novel drug response analysis that is made possible by the advanced methods. Chapter 6 concludes the thesis and suggests directions for further re-search.
2. Bayesian machine learning and
factorizations
Machine learning focuses on algorithms that search for patterns in the data and extract useful information [5]. The algorithms learn a model from existing data samples and utilize it for various tasks. In several applications, the data measurements can be hypothesized to have been generated from an underlying process that may not be measurable itself [17]. Moreover, the measurements are typically high-dimensional and may contain correlated variables which are additionally corrupted with noise, making the direct analysis complicated. One of the key features of machine learning is to learn low-dimensional latent representations that summarize the data. The learned data summaries can then be hypothe-sized as the descriptions of the phenomenon that have generated the data. These summaries are then commonly used to understand the mechanisms of the data generation process, or then to predict the unseen outcomes. A salient latent summarization techniques is data factorization that forms the core of all the methods developed in this thesis. This chapter describes data factorization approaches, identifying the key assumptions and the latest developments.
2.1 Latent variable models
Latent variable models are a powerful approach to machine learning [4, 18]. They provide a flexible way of describing dependencies between the data variables by assuming that the observed data was generated through the interactions of a few unobserved (latent) variables. These latent vari-ables present a low-dimensional summary of the observed data and can be considered as concise and denoised descriptions of the underlying pro-cesses that have generated the data. The representations can then be used to understand the data generation processes or predict the
unob-Bayesian machine learning and factorizations
served data entities.
Formally, the higher-dimensional data variablesx∈RDcan be repre-sented using lower-dimensional latent variablesz={z1, z2, . . . zK}where K < D, providing a flexible way to represent the dependencies between the observed variables. The number of latent variables is typically much smaller than the data dimensionality and eachzkusually follows a simple distribution.
The matrix and tensor factorization methods discussed in the foling sections are key examples of latent variable models that find low-dimensional factors (latent variables) to represent the high-low-dimensional observed data.
2.2 Matrix factorization and co-occurring patterns
Matrix factorization (MF) is a well-established approach having vast sci-entific applicability including missing value prediction, dimensionality re-duction, and data visualization [19–21]. Among other motivations, matrix factorization can be seen as a means of identifying underlying processes that produced the data. In such a scheme, measurements are thought to have been generated from a combination of multiple latent processes, each generating some parts of the data. For matrix factorization, the task is to decompose a matrix into severalfactorsorcomponentsthat describe the underlying (hopefully meaningful) processes. The terms factors and components are used interchangeably in this thesis, as both have been commonly used in the literature.
A broad set of approaches has been studied to factorize matrices, op-timizing on different criteria [22, 23]. For factorization of a single matrix factor analysis, and for joint factorization of two matricescanonical cor-relation analysis, are well-established methods. Both factor analysis and canonical correlation analysis form the basis of all the methods developed and presented in this thesis, and are described next.
Factor Analysis (FA)[6] is an unsupervised technique for low-dimensional
factorization of a single matrix. FA assumes that the data matrixX ∈
RN ×Dcan be modeled by a latent factor representation such that the fac-tors capture dependencies between the variables. ForN samples, each
Bayesian machine learning and factorizations
described by aD-dimensional data vectorxn, FA can be represented as
xn∼N(Wzn,Σ) (2.1)
zn∼N(0,I),
whereWznis a low-dimensional latent representation ofxn, whileΣis a diagonal noise covariance matrix, with a separate termσ1, . . . , σDfor each of theDvariables. The noise model captures the individual variation of each variable, and the latent representationWzn models the covariance patterns betweenthe variables. This assumption is of key importance as it allows FA to capture patterns common between two or more vari-ables. In contrast, principal component analysis [PCA; 20] assumes the more restrictive isotropic noise model with all the variables having a sin-gle variance parameter.
Bayesian factor analysis has been used successfully in modeling the factors from real data applications. For example, in modeling genomic data sets, the low-dimensional factors are used to represent the biological processes driving the mechanisms. Recently, several studies have been conducted using microarray gene expression data sets to create hypothe-ses for the cellular response patterns [7, 10, 24]. Similarly, learning the denoised low-rank structure with factorization has also been proved use-ful for the prediction of missing values [19, 25].
Canonical Correlation Analysis (CCA)[8] is an unsupervised method
that decomposes two paired matrices into a shared low-dimensional rep-resentation. The paired matrices are characterized by having a common identity of the samples. Therefore, unlike FA that finds dependencies be-tween two or more variables, CCA aims to capture the correlated patterns between two matrices. CCA linearly transforms the matrices into a max-imally correlated subspace of components, such that any two components are uncorrelated with each other. This way, it can find distinct compo-nents that are common to both of the matrices. For two data vectorsx(1)n
andx(2)n , CCA can be represented as a generative process [11, 26]:
x(nm)∼N(W(m)zn,Ψ(m)) m= 1,2 (2.2)
zn∼N(0,I),
wherezn is the latent vector common to both matrices, W(m) are load-ings for each matrix, andΨ(m)the corresponding noise covariance matrix.
The shared latent representationzn of CCA models the covariation pat-terns between the two matrices, whileΨ(m)models the variation specific
Bayesian machine learning and factorizations
to each matrix. This division implies thatzncan capture the dependencies between the two matrices. An efficient CCA solution using group-sparse priors was recently presented by [11]. Their formulation uses the latent variables to represent both the correlated patterns between the matrices as well as the matrix specific variation, while the noise covariance is as-sumed isotropic for each of the data sets.
For a comprehensive review of Bayesian canonical correlation analy-sis see [11], while [9] for classical CCA. CCA has been successfully used for modeling dependencies between data sets. For example, in genomics it has been used to identify chromosomal regions showing dependencies in copy number and gene expression of a set of samples [27, 28].
2.3 Tensor factorizations
When data sets have more dimensions than just samples and features, they may present tensorial relationships. While matrix factorization meth-ods are optimized to decompose matrices, the structure in more than two modes can be handled appropriately by tensor factorizations. In order to capture the more structured patterns of such data sets and avoid overfit-ting, tensor methods use more constrained formulations that have fewer parameters than their matrix counterparts.
Analogous to MF, tensor factorizations perform decompositions of the tensors into their constituent parts. However, the decompositions of multi-mode data sets allow factorizations with several different interaction as-sumptions and present additional modeling issues. Consequently, a wide range of low-dimensional representations of tensors have been proposed in the literature [29]. The most well-studied models include the CAN-DECOMP/PARAFAC [30, 31] and the Tucker model family [32]. For a comprehensive review of tensor factorizations and their properties, see [29].
Tensor factorizations have obtained significant success in chemomet-rics and psychometchemomet-rics in the last decade. Recently, they have also been adopted in bioinformatics and related application fields. For example, tensor methods have been used in exploring factors of gene expression patterns over replicates of several stimuli [33], as well as integrating re-sponses from different studies [34, 35]. The rapid accumulation of bi-ological measurement data is leading to new and extended hypotheses, which may be investigated with tensor formulations. Very recently, gene
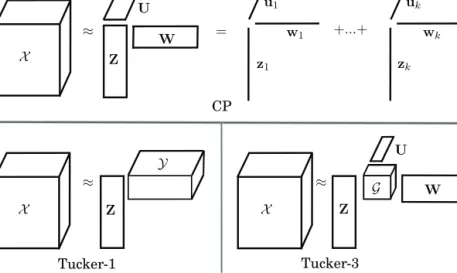
Bayesian machine learning and factorizations G ≈ U W Z U W CP Tucker-3 ≈ +...+ z1 zk w1 wk u1 uk X = Z Y Tucker-1 X ≈ Z X
Figure 2.1. Top: CANDECOMP/PARAFAC (CP) factorizes a tensorX into K compo-nents in each mode and is equivalent to sum of rank one component tensors. Bottom:Tucker-1 and Tucker-3 decompositions that factorize the tensors in one and three modes, respectively. Tucker-3 models the interactions between components via a core tensorG.
expression time series of several samples [36] and integrative analyses of metabolic and gene expression networks [37] have also been explored with tensor factorizations.
2.3.1 CANDECOMP/PARAFAC (CP)
The CP decomposition was presented independently as canonical decom-position (CANDECOMP by [30]) and parallel factor analysis (PARAFAC [31, 38]). CP is a direct extension of matrix factorization to higher order data sets. The decomposition originates from Cattell’s theory of paral-lel proportional profiles [39]. Cattell stated that two independent real-izations of similar data sets could be decomposed jointly with a simulta-neous factor analysis. This process learns a common projection matrix that differs only in the scale of factors for the two data sets and captures the intrinsic axis of the underlying factors. Parallel factor analysis [31] extends this conceptualization to a tensor (a set of matrices placed to-gether), allowing the projections of FA to differ only in their scales in the third mode. CP can therefore be seen as multiple factor analysis of a sin-gle phenomenon being performed simultaneously, to infer the empirically meaningful factors.
The CP decomposition is defined in a symmetric way to factorize a tensor into a sum of rank-one tensors, where each rank one tensor is the
Bayesian machine learning and factorizations
outer product of vector loadings in all modes (Figure 2.1-top). For a third-order tensorX ∈RN×D×L, a rank-KCP is represented as:
X= K k=1
zk◦wk◦uk+, (2.3) whereZ∈RN×KandU∈RL×K andW∈RD×K are the latent variables corresponding to the three modes.
This component decomposition is valuable for many applications, as the different rank-1 terms can be related to separate mechanisms that may have contributed to the higher order tensor, making the model read-ily interpretable. Furthermore, the CP factorization solutions are known to be unique up to a given permutation and scaling [40]. These character-istics of CP, make it a suitable choice for the underlying tensor factoriza-tion in the methods presented in this thesis.
Commonly, CP is solved for a givenKvia Alternating Least Squares (ALS) algorithm [41, 42]. ALS finds a locally optimal CP solution by up-dating one loading matrix at a time while keeping others fixed [29]. It estimates the parameters by a least squares approach that is equivalent to maximum likelihood estimate under the assumption of isotropic Gaus-sian noise. Recently, several authors have also solved CP in a BayeGaus-sian setting demonstrating its advantage [43–45].
Rank.Unlike matrix factorizations, in CP the exact rank determination
can be crucially important as both under and over-estimation may result in invalid solutions [29]. The primary reason is that a rank-k CP solution is not guaranteed to be the best rank-k approximation if the true number of factors is larger thank[46]. On the other hand, the factorization could produce artificial splits or noise components if k is set larger than the actual value. Therefore, the best rank-k solution can not be computed sequentially, rather all the factors must be found simultaneously [29]. Determining the CP rank is a challenging problem and solutions based on cross-validation tend to be computationally expensive [47]. Recently, a Bayesian solution for automatic rank identification has been proposed [44], which is also computationally fast, however, its robustness could be further studied.
Degeneracy. Practical application of CP can occasionally suffer from
degenerate solutions, in which two or more components become highly correlated in all the modes and some of the loading values becoming arbi-trarily large. The degenerate solutions are not interpretable and
compli-Bayesian machine learning and factorizations
cate the use of CP [48]. These degeneracies have primarily been observed when data sets having a non-trilinear structure are decomposed with CP [49, 50]. Nevertheless, the strong interpretative power of CP has brought up degeneracies as an important research topic [51–53]. As high neg-ative correlations are a primary characteristic of degeneracies, several researchers have recently studied solutions with strict constraints that force uncorrelatedness, such as orthogonality and non-negativity [52, 53].
2.3.2 Tucker
The Tucker model family [32] defines several levels of factorization, and has three main forms, Tucker-1, Tucker-2, and Tucker-3. The 1-mode fac-torization of Tucker, is the most relaxed formulation that decomposes only one of the modes while Tucker-2 and Tucker-3 factorize two and all three of the modes, respectively. Tucker-1 being the most flexible is also equiva-lent to matrix factorization of a matricized tensor (Figure 2.1, bottom-left). On the other hand, Tucker-3 enforces more structure and is characterized by interactions between a different set of factors in each mode (Figure 2.1, bottom-right). Unlike in CP, in the Tucker-3 model, a factor does not represent an additive source of information; rather, it represents a pat-tern of variation in a given mode only, and the factors are thought to have generated the data by interacting with several other patterns of variation (factors), X ≈ P p=1 Q q=1 R r=1 gp,q,rzp◦wq◦ur.
The loadings Z ∈ RN×P, W ∈ RD×Q and U ∈ RL×R are accompanied with a core tensorG ∈ RP×Q×R that captures the interactions between factors of different modes (Figure 2.1, bottom-right). The complex inter-action of factors viaGmakes interpretation of factors difficult. Moreover, in contrast to the CP factorization, the Tucker model is not guaranteed to provide unique solutions. The Tucker component matrices can be ro-tated, and the core tensorGcounter-rotated to obtain infinite number of models with an equal fit. This rotational ambiguity requires additional constraints to make the solutions interpretable [54, 55]. However, CP can be seen as a restricted version of Tucker-3 with the core tensorG con-strained to be a superdiagonal and of sizeK×K×K. While Tucker better fits complex structures, the CP outperforms it when the data contains tri-linear relationships [56].
Bayesian machine learning and factorizations
Table 2.1.The novel methods applied or developed in this thesis are based on matrix or tensor factorizations as summarized in this table. The matrix factorization methods of Publications I-IV are discussed in Chapter 4 while tensor factor-ization methods of Publications V-VI are described in Chapter 5.
Pub. Matrix Factorization Tensor Factorization I Canonical Correlation Analysis
II Group Factor Analysis III Sparse Group Factor Analysis IV Kernelized Bayesian Matrix
Factorization
V Bayesian Multi-view Tensor Factorization
VI Multi-tensor Factorization Multi-tensor Factorization
This thesis utilizes and develops novel extensions of matrix and ten-sor factorization methods, when multiple data sets are factorized together. The methods are detailed in Chapters 4 and 5, however, a summary of their matrix or tensor nature is presented in Table 2.1.
2.4 Bayesian modeling
Bayesian modeling is being increasingly used in modern machine learning research. The modeling task is to define a model and learn the unknown parameters (or latent variables) using the observed data. The Bayesian data analysis models the uncertainty observed in the true value of an un-known parameter using a probability distribution. This principled means of representing uncertainty is especially advantageous, when the data samples are few and noisy. Therefore, the salient feature of the Bayesian analysis is that when uncertainty exists, it learns a posterior distribution specifying a range of values for the parameter, while taking into account the prior information.
The posterior distribution of the parameter is defined by the likeli-hood and the prior. The likelilikeli-hood function determines the impact of data on the parameter while the prior probability distribution encodes any prior information concerning the parameter. The Bayes theorem gives this for parameterθand dataXas
P(θ|X) = P(X|θ)P(θ) P(X) ,
Bayesian machine learning and factorizations
where the marginalP(X) is the normalization constant integrating the posterior to one. The posterior probabilitiesP(θ|X)can be seen as like-lihoodP(X|θ) weighted by the prior P(θ), where the prior increases or decreases the impact of likelihood in the posterior. In other words, the modeling favors the solutions matching the prior. The prior may be used to encode evidence or expert knowledge into the model. Moreover, it can even assume a ‘non-informative’ setting, which enforces minimal assump-tions so that the data can guide the posterior.
In this thesis, priors are used for inducing structure-revealing pat-terns and regularizing the solutions by giving higher probability to sim-pler representations. The regularization is especially beneficial when the sample count is low, and the level of noise is high.
2.5 Inference and Gibbs sampling
Once the model is specified, the learning task is to compute the poste-rior distribution of the latent variableszand the parametersθ. However, except for only the simplest models, there may not exist closed-form ana-lytical solutions for the posterior evaluation [5]. In such cases, inference of the parameters is performed via approximate schemes.
The approximate methods fall into two broad categories, determinis-tic and sampling approaches [5]. The determinisdeterminis-tic methods use analyt-ical approximations of the posterior distribution. For example, they may assume that the posterior factorizes into simpler distributions. Quite con-trary, the sampling methods work by sampling from the joint posterior and have the property that given infinite computational resources they can generate the exact result. Sampling methods are considered approx-imate because only a finite number of samples can be obtained practi-cally. The deterministic approaches such as the variational inference are usually suitable for simple and smooth distributions, and are faster than sampling methods. On the other hand, as sampling methods obtain the samples from the actual posterior distribution, they are usually more suit-able for complex distributions. Gibbs sampling is one of the most widely used sampling algorithm and is described in the rest of this section. It was used in Publications III, V and VI of this thesis.
Gibbs samplingis a widely applicable approximation algorithm [5]. It simulates observations as approximations of the joint posterior distri-bution without directly sampling from the joint distridistri-bution itself. The
Bayesian machine learning and factorizations
method iterates the samples from the conditional posterior of each able while conditioned on the existing estimates of the remaining vari-ables and the data,
zit∼p(zi|zt−−i1,X, θ).
Here the latent variablesz are split into k sub-parts z = (z1, z2, ...zk), and tindicates the current iteration number of the sampler. In every iteration, each of thek sub-parts is sampled sequentially based on the latest updates of all other parts, improving the simulation at each step. The algorithm is a Markov chain Monte Carlo (MCMC) method, where successively sampling from the conditionals converges to the stationary distribution, which, in this case, is the joint posterior distribution [57]. The samples from the stationary distribution can then be used to approx-imate the joint posterior distribution, the marginal distribution of any of the variables or for computing the expected values of the variables.
In practice, as the chain iterates towards convergence, the initial set of samples prior to the stationary distribution are discarded as theburn in. The samples from successive draws of the posterior may be strongly correlated, in which casethinningmay be used to break the dependence by keeping only the everylthsample [57]. Thezt=0can be initialized in
several ways with sampling from the priors being a common choice. The effect of this random initialization and the stochastic nature of the chains can be partly mitigated by using multiple chains for averaging or selecting a reliable one. Therefore, with its ease of formulation, Gibbs sampling is a simple, reliable and a well studied standard choice.
3. Biological responses to drugs
Cellular response to drugs depends on several factors including the mul-titude of targets the drug can bind and the resulting pathways perturbed. It is also well understood that there are potentially several pathways con-nected with each cellular phenotype. This presents a many-to-many re-lationship from drugs to targets and from pathways to responses, with the majority of this information being unknown. Given this incomplete knowledge, comprehensively modeling the drug responses over a diverse drug library is a goal yet to be achieved. However, as drugs bind to the targets yielding the effects, thebinding is of central importance to the response. This binding of the drug-target pair depends primarily on the structural correspondence of the drug molecule and the binding cavity of the target. Therefore, in principle, the responses to drugs can be modeled comprehensively by learning a mapping between the structural properties of the drugs and their responses, if done on a genome-wide scale.
In this chapter, the response measurements and structural properties of the drugs used in the thesis are presented briefly. Interested readers are referred to more details and the Publications in each section.
3.1 Gene expression measurements
Cellular proteins are the functional blocks executing the mechanisms in every cell. In order to learn the actions or reactions of the cells, it would be ideal to measure the complete protein expression of the cells. However, with the current state of the art, reliable and cost effective techniques are not available and, therefore, approximate alternatives are commonly used. The most widely used means of estimating the type of activity in a cell is the expression of all the genes in a particular condition. These patterns, referred to asgene expression, are well known for their ability
Biological responses to drugs
to differentiate between the different types [58] and the behavior of cells [59]. Studying the changes in gene expression has been valuable in un-derstanding different medical conditions [60], disease processes [61], and otherwise to explore the therapeutic applications of drugs [62]. For exam-ple in cancers, it is valuable to identify the survival-related genes whose expressions are altered by a drug [63].
Microarrays [64] are extensively used for measuring genome-wide gene expressions. They measure the expression of thousands of short prede-fined sequences, which are then preprocessed to obtain gene-level activ-ity. These measurements can be significantly noisy [65], and require pre-processing and corrections prior to their practical use [66]. More recently, RNA sequencing has emerged as a technique with wider coverage for mea-suring gene expression responses [67, 68]. However, this thesis focuses on microarray gene expression data, due to the availability of large-scale drug profiling data sets [3].
A common way of analyzing the processed gene expression data is dif-ferential expression, where the expression of interest is compared with a control signal. This procedure builds the notion of directional changes in expression. For example, comparing post and pre-treatment expression of genes can identify which genes have beenup-regulated (increased in expression) and whichdown-regulated, as a result of a treatment. Dif-ferential expression is usually computed as fold-change, i.e., a log2-ratio between treatment and control. In order to determine which genes have been differentially expressed, standard statistical tests such as the t-test are commonly used to test significances [69]. A large number of genes is usually tested for the significance, and multiple hypothesis correction needs to be carried out. For corrections, the standard methods are the Bonferroni correction and the false discovery rate [70, 71]. With advance-ments in machine learning, it has also become common to study differen-tial gene expression values of several case-control samples directly with computational methods, to test and identify different hypotheses [15, 72]. It is also informative to analyze expression changes in light of prior bi-ological knowledge. In this line, Gene Set Enrichment Analysis [GSEA; 73] and Gene Ontology enrichments [GO; 74] of known biological path-ways and processes have gained significant success. In short, gene ex-pression responses form a valuable genome-wide resource to study cellu-lar responses, in particucellu-lar, drug action mechanisms.
Connec-Biological responses to drugs
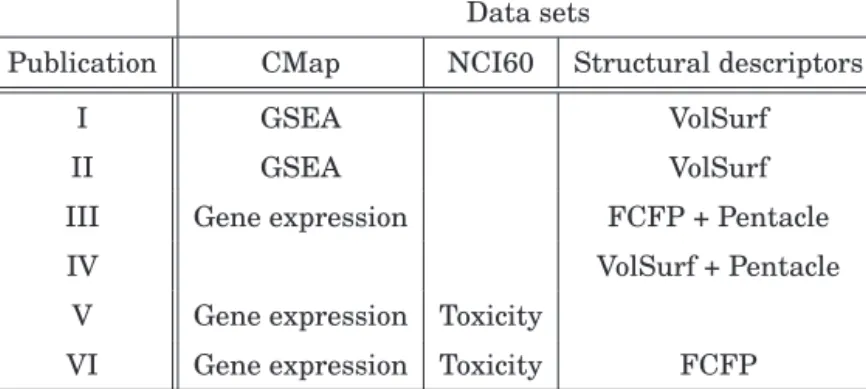
Table 3.1.Data set usage in the publications of this thesis. The data sets are obtained from the CMap and the NCI60 databases, and also the structural descriptors of the drugs. The GSEA and Gene expression present two different represen-tations of the CMap data. The toxicity data set from NCI60 and different types of structural descriptors are described in Sections 3.2 and 3.3, respectively.
Data sets
Publication CMap NCI60 Structural descriptors
I GSEA VolSurf
II GSEA VolSurf
III Gene expression FCFP + Pentacle
IV VolSurf + Pentacle
V Gene expression Toxicity
VI Gene expression Toxicity FCFP
tivity Map database (CMap, [3]) that hosts microarray gene expression responses of several cancer cell lines to over 1300 drugs. The CMap data-base has been successfully used by the scientific community, for example, to discover the mode of action of drugs [16] as well as new biological links between multiple drugs [15]. The three major cell lines used in CMap, HL60, MCF7, and PC3 come from three different cancers, namely blood, breast and prostate cancers. Therefore, this data presents a unique view of the genome-wide responses of cancers to drugs, over a set of 11,000 genes that are measured for each sample. The data set contains∼7000 gene expression measurement samples including replicates. The mea-surements come from three different microarray platforms, with over 85% of the samples profiled with one of them, the Affymetrix HT-HGU133A chip, and was therefore used in this thesis. The data set contains both post and pre-treatment cellular responses of genes and is preprocessed to obtain a treatment vs. control differential gene expression response for each drug-cell pair (further details are given in Publication I). A positive value in differential expression corresponds to up-regulation of the genes while negative corresponds to down-regulation. Gene set summaries were also computed as a dimensionality reduced representation of each sample using GSEA (Publications I and II, Section 4.1). The CMap data set was used in all publications of this thesis except Publication IV as enlisted in Table 3.1.
Biological responses to drugs
3.2 Drug sensitivity measurements
The drug sensitivity analysis aims to identify the concentration threshold of a drug required for a particular pharmacological action. The process is usually conducted by administering multiple different doses of a drug to a cell and measuring the cell viability or inhibition, resulting in a dose-response curve. The dose-dose-response curves can then be used directly in the analysis or summarized in one or more standardized values such as the GI50 (growth inhibition of 50%). Drug profiling presents a phenotypic view of a cell’s response to a drug, and can also be used to describe toxic outcomes depending upon the application [75, 76]. The drug sensitivity measurements have gained significant attention in studying responses of cancer cells, where a set of drugs are tested over a set of cell lines to identify sensitive and resistance behaviors [77, 78].
Large scale drug profiling has led to the possibility of not only identi-fying sensitivity or toxicity patterns of the drugs [79], but to also search for genomic markers that may be indicative of the responses [80, 81]. Sev-eral studies have recently been conducted to measure drug sensitivity of human cancer cell lines against large collections of drugs, along with ge-nomic profiling of the cells to identify potential biomarkers [78, 82]. On a complementary front, drug treatment gene expression data has also re-cently been shown as a better classifier of drug toxicity than chemical descriptors of the drugs [83].
The NCI60 is the largest panel of drug sensitivity data measured with over 40,000 compounds tested on 60 different cancer cell lines [77]. The data set has been used in several studies, for example to establish the mechanisms of action of the compounds [84, 85] and to predict their cy-totoxicity [75, 86]. In this thesis, dose-response summaries are obtained from NCI60 for all the common drugs and cell lines that have correspond-ing drug treatment gene expression measurements in CMap [3]. The data set presents three response measures, the GI50 (growth inhibition of 50%), LC50 (50% lethal concentration) and TGI (total growth inhibition). The measurements are then preprocessed to obtain a positive value if the concentration of the drug used in the Connectivity Map was toxic (higher than the dose-response values), and negative otherwise. The transformed data set therefore represents concentration-dependent toxicity values and has been used in Publications V and VI of the thesis (Table 3.1).
Biological responses to drugs
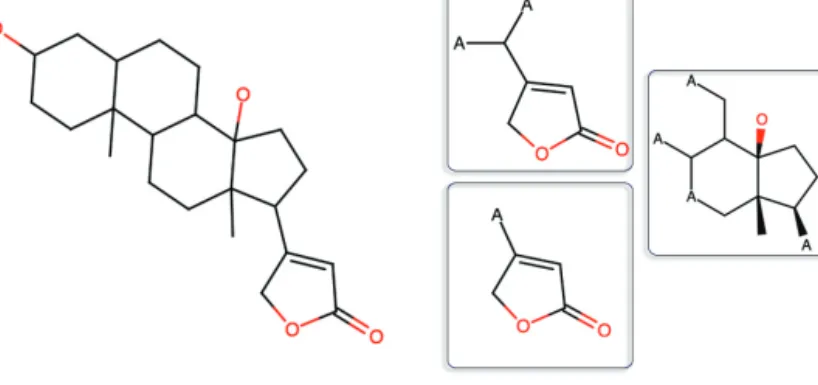
Figure 3.1.2D Fingerprints of an example compound (digitoxigenin). Left: The 2D structure of digitoxigenin is shown. Right: The 2D fingerprints represent the compound as structural fragments. In this example, Functional Connec-tivity Fingerprints (FCFP4, Section 3.3.1) are used to compute the structural fragments of digitoxigenin. A total of 34 fragments are found in digitoxigenin, 3 of which are shown here.
3.3 Structural descriptors
Structural descriptors of drugs represent each compound with a set of features of its structure and function. Different types of 2D and 3D de-scriptors exist, each optimized for different criteria [87]. The selection of appropriate types of descriptors is important, especially in this work as the aim is to represent drug molecules in a way that assists capturing the biological functions. Some of the key descriptor types are elaborated and reasoned in the rest of this section. One or more of these descriptor sets are used in each publication of this thesis, except Publication V as enumerated in Table 3.1.
3.3.1 2D fingerprints
The 2-dimensional fingerprints represent the structural and functional properties of drugs by formulating the presence or absence of the frag-ments, allowing easy visual inspection (Figure 3.1). MACCS fingerprints are one of the traditional examples of 2D fingerprints that represent drugs with a predefined set of 166 structural fragments [88]. The Functional Connectivity Fingerprints [FCFP; 89]) are an advanced formulation of the 2D circular topological fingerprints. They have been designed specif-ically for modeling of structure-activity relationships and similarities be-tween the drug, and, therefore, have been a descriptor of choice in such
Biological responses to drugs
studies [90–92]. FCFP can represent variation in novel structures as they compute the fragments dynamically, instead of using a predefined set. Therefore, FCFP can be used for identifying 2D substructures that make novel compounds structurally similar and are responsible for biological activity.
3.3.2 3D descriptors
Amongst a host of 3D descriptors, those based on molecular interaction fields (MIFs) are well suited for structure-activity modeling and drug dis-covery [93]. Instead of describing the molecules structural skeleton, these MIFs take a complementary approach and sketch out the interaction po-tential of a compound with a set of different probes. For a compound, this could potentially be used to characterize interaction sites around the molecule or summarize the different physicochemical, pharmacophoric, and shape-based properties that are relevant for its pharmaceutical ap-plication. When analyzing multiple compounds with MIFs, extracting the relevant information, and the alignment of molecules have traditionally been the major bottlenecks. However, recent advancements such as the VolSurf and Pentacle have substantially overcome these.
VolSurf
The 3-dimensional VolSurf descriptors [94] are based on molecular inter-action fields and are specifically designed for optimization of pharmacoki-netic properties. Unlike the 2D fingerprints, which represent the struc-tural fragments, VolSurf describes the generic physicochemical properties of the molecules. They are, therefore, capable of grouping together com-pounds that have different chemical structure yet possess the same type of chemical properties. VolSurf summarizes the interaction contours from MIF by computing shape and volume-related statistics into a set of prede-fined descriptors. These include interactions such as lipophilic, lipophobic, hydrophilic, and hydrophobic, resulting in a set of 76 structural features. Pentacle
The Pentacle descriptors are advanced 3-dimensional field distance de-scriptors [95] that also use molecular interaction fields to capture the functional properties. They encode the detailed interaction potential of the compounds with the chemical probes, at dynamically computed mark-ers. These interaction potentials represent the molecule (its charge and
Biological responses to drugs
shape) as the target molecule would see it. Therefore, Pentacle descrip-tors can group together compounds with different chemical structures, but having similar interaction potential with a receptor. This characteristic is important in the applications of this thesis, as it allows grouping together compounds that bind into the same binding pocket despite structural dif-ferences, which traditional fingerprints are unable to recognize. In com-parison to VolSurf, Pentacle descriptors are more detailed and describe pharmacophore features extensively. The dimensionality of the resulting Pentacle descriptors depends on the size of the molecules and is usually much higher than VolSurf. Very recently, both VolSurf and Pentacle have shown success in structure-activity analysis [96–98].
4. Multi-view models for drug
responses
In modern chemical systems biology, the high-throughput profiling of a compendium of compounds against genomically heterogeneous cancer cell lines has unveiled diverse and interesting relationships between the re-sponses. Several computational approaches have used massively high-dimensional genome-wide responses to investigate the drug action mech-anisms [12, 15, 16, 99]. On the other hand, various studies use the chem-ical properties of the drugs to predict their univariate effects [97, 100]. To combine these complementary approaches, this research formulates the hypothesis that drug structure-response relationships can be studied on the systems-wide level in a data-driven manner. Such systematic stud-ies are valuable as they may ultimately assist in improving drug design and personalizing treatments. Specifically, this chapter pursues machine learning methods to model the relationships between structural descrip-tors of drugs and their corresponding genome-wide responses, over multi-ple types of cancer.
The first aim here is to study the effects of chemical structure in the context ofmultidimensionalbiological readouts, rather than to use a sin-gle target ‘activity’ as in the conventional QSAR studies [13]. When the goal is to search for relationships between two multivariate data sets in an unbiased fashion, dependency modeling based approaches such as canon-ical correlation analysis (CCA) match the objective directly. Section 4.1 uses canonical correlation analysis (CCA) on the largest genome-wide drug profiling data resource (CMap, section 3.1) and a set of chemical features, in search of correlated patterns (Publication I). The study for-mulates the structure-response problem in a dependency modeling frame-work and presents a systematic pipeline for analysis of the genome-wide responses.
suc-Multi-view models for drug responses
cessfully identifies both known and novel insights; and also opens up newer horizons to be explored. The study also suggested that multiple diseases may produce response patterns that may be partly specific to only one or few of the diseases (cancer types). Such response patterns, if existing, may be discovered through multi-source modeling. Section 4.2 presents a novel multi-view model, and applies in collaboration to explore patterns between drug structures and their responses over multiple dis-eases (Publications II and III). The results illustrate the advantages of the improved methodology. Finally, multi-source modeling is also evaluated for prediction of drug targets in section 4.3 (Publication IV).
4.1 Canonical correlation analysis for drug responses
The structure-response relationships can be learned comprehensively by searching for linksbetween drug structures and their genome-wide re-sponses. This translates to the machine learning task of identifying la-tent interactions between multivariate structural descriptors of drugs and their corresponding multivariate (genome-wide) responses. Publication I proposes a data-driven solution to model the hidden interactions in a sys-tematic manner. The interactions are hypothesized to describe the un-derlying biological processes, and are identified by discovering the joint low-dimensional subspace that relates drug structures with cellular re-sponses.
The analysis is based on the differential gene expression response of 1159 drugs originating from the Connectivity Map database [3] (sec-tion 3.1). In order to reduce the dimensionality of this gene expression data and to bring in prior knowledge of known biological responses, Gene Set Enrichment Analysis (GSEA) [73] was performed. For GSEA, the cu-rated gene sets (C2) from the Molecular Signatures Database1[73] were selected for enrichment, as they are both carefully curated and cover over 90% of the genes in this data. These include gene sets from online path-way databases and knowledge of domain experts. A few example gene sets are theHSA05221_acute_myeloid_leukemia (AML)that lists known genes involved in AML,ET743_Sarcoma_upenumerates genes up-regulated in sarcoma’s as a result of treatment with Trabectedin (an anti-cancer drug), and theOxiadative_Phosphorylationwhich is a metabolic pathway. The GSEA summarizes the gene-level expression into a gene set activation
Multi-view models for drug responses
profile. As a result, the 11,327 genes from CMap were summarized into 1321 gene sets. On the other hand, the chemical space of the 1159 drugs was represented by the 3D VolSurf descriptors (section 3.3.2). VolSurf comprises of 76 descriptors that are capable of grouping together com-pounds having the same type of chemical properties despite having differ-ent chemical structures.
4.1.1 Dependency modeling via canonical correlations
For discovering relationships in a data-driven way, the computational task is to model the dependencies between the two data sets (structural descriptors and gene set responses) in a comprehensive fashion. CCA, fitting the goal directly, discovers a joint low-dimensional representation that splits the two input spaces (chemical and biological) into distinct com-ponents. Each of the components statistically correlates the patterns of one space (chemical descriptors) with those of the other space (biologi-cal response). As drugs generate diverse effects, component-based models are suitable for segregating the multiple different responses. Therefore, with CCA, the joint decomposition of the structuresponse data sets re-sults into correlated components, which are hypothesized to describe the underlying biological phenomena driving cancer drug response. The key assumption here is that if there is any statistical dependency between the patterns in the chemical space and the biological responses, these pat-terns are then informative for developing hypotheses about the mecha-nisms of drug actions.
Methodologically, CCA is an established data integration approach that maximally explains the dependency between two data sets [8]. The method linearly projects the data sets to obtain a maximally correlated low-dimensional representation. This low-dimensional representation aka theshared spaceor thecomponentscapture the statistically shared pat-terns between the two data sets, whereas patpat-terns specific to any one of the data set are considered noise and ignored. This split matches exactly to the assumption that shared structure-response patterns are of prime interest.
Analogous to most genomics data sets, the CMap gene set profiles have more dimensions than the number of samples with several highly correlated variables. In such a situation, there is a potential for the CCA covariance matrices to become ill-conditioned, which could result in nu-merical inaccuracies while computing the inverse. This is a classical