Evaluation of Process Model
Matching Techniques
Inauguraldissertation
zur Erlangung des akademischen Grades
eines Doktors der Naturwissenschaften
der Universität Mannheim
vorgelegt von
Elena Kuß
aus Schweinfurt
Korreferent: Prof. Dr. Henrik Leopold, Kühne Logistics University Hamburg Tag der mündlichen Prüfung: 15. März 2019
Abstract
Business process models are commonly used to document a company’s operations. They describe internal processes in a chronological and logical order. Business process model matching refers to the automatic detection of semantically similar correspondences in process models. The output of those matching techniques is the basis for many applications. Currently, most research effort has been undertaken to improve the performance of such matching techniques. However, to support the improvement of process model matching techniques further, efficient and fair evaluation strategies are required. Moreover, information about the matching task, regarding the complexity of a data set have to be gathered. In the current literature, complexity is mostly associated with different level of granularity, thus1 : mor n : mcorrespondences. However, the evaluation should also account for differ-ent complexity aspects of the matching task, for example syntactical overlap of correspondences. Moreover, the evaluation of matching results actually strongly depends on the application. In this thesis, we therefore propose an application dependent evaluation. On the one hand, we introduce a non-binary evaluation, which better reflects the uncertainty of a gold standard and propose evaluation metrics, based on this non-binary gold standard which take different application scenarios into account. On the other hand, we propose a conceptually novel evalu-ation procedure, which offers detailed informevalu-ation about strength and weaknesses of matchers without manually processing the matcher output. It therefore helps to find optimal application scenarios for specific matching techniques. It can further serve as a basis for a prediction for future matching tasks. We conduct experiments to show the insights gained by the introduced evaluation metrics and methods. Moreover, we apply the metrics at the OAEI 2016 and 2017.Zusammenfassung
Geschäftsprozessmodelle sind in fast jedem größeren Unternehmen zu finden. Sie beschreiben firmeninterne Prozesse in einer chronologischen bzw. logischen Ab-folge. Solche Prozessmodelle können sehr große Datenmengen beinhalten, teil-weise mit mehreren hunderttausend Prozessmodellen. Solche Datenmengen lassen sich händisch kaum bewältigen, daher müssen sie beispielsweise automatisch bear-beitet werden. Hierzu werden häufig “Matching Technologien” verwendet. Um zu erkennen wie gut solche Technologien in der Praxis funktionieren, bedarf es ef-fizienter Evaluierungstechniken. Aktuell werden dafür hauptsächlich Metriken aus dem Information Retrieval herangezogen, die auf einem binären Goldstan-dard basieren. In der Praxis zeigt sich jedoch, dass solche binären GoldstanGoldstan-dards die tatsächliche Komplexität eines Datensatzes nicht korrekt widerspiegeln. Die Erstellung eines solchen Goldstandards ist einerseits sehr subjektiv und anderer-seits gibt es nicht immer eine richtige oder falsche Lösung. Um diese “Unsicher-heiten” zu berücksichtigen, schlagen wir einen nicht-binären Goldstandard vor, welcher (alle) mögliche Korrespondenzen eines Datensatzes enthält. Darüber hin-aus entwickeln wir Evaluierungsmetriken, welche nicht-binäre Werte erlauben und eine Evaluierung je nach Anwendungsfall zulassen. Somit wird die Perfor-mance der Matcher aus unterschiedlichen Blickwinkeln betrachtet. Darüber hin-aus präsentieren wir eine konzeptionell neuartige Evaluierungsmethode, welche detailierte Informationen über die Performance der Matcher bietet. Dabei wird der Datensatz und Matcher-Output automatisiert in verschiedene Komplexitätsstufen eingeteilt. Die Ergebnisse erlauben zudem optimale Matching-Szenarien für spezi-fische Matcher abzuleiten. Die eingeführten Metriken und Evaluierungsmethoden wurden bereits bei der OAEI 2016 und 2017 angewendet.Contents
Abstract iii
Zusammenfassung v
List of Figures xi
List of Tables xiii
1 Introduction 1
1.1 Business Process Modeling . . . 1
1.2 Business Process Model Matching . . . 3
1.3 Research Questions . . . 5
1.3.1 Gold Standard Creation . . . 5
1.3.2 Absence of a “Perfect Match” . . . 7
1.3.3 How to Evaluate Process Model Matching Techniques? . . . 9
1.4 Contribution . . . 10
1.5 Thesis Outline . . . 13
2 Background and Basic Definitions 15 2.1 Basic Notions and Definitions . . . 16
2.2 Introduction to Metrics from Information Retrieval . . . 19
3 Process Model Matching Contests (PMMCs) 23 3.1 Data Sets of the Process Model Matching Contest . . . 24
3.1.1 University Admission Data Set (UA) . . . 24
3.1.2 Birth Registration Data Set (BR) . . . 25
3.1.3 Asset Management Data Set (AM) . . . 26
3.2 Results of the PMMC 2015 . . . 28
3.3 Comparison of the Results of the PMMC 2015 to the Results of the PMMC 2013 . . . 30
3.4 Conclusions . . . 32
4 Related Work 35 5 Probabilistic Evaluation 43 5.1 Definition of a Non-binary Gold Standard . . . 44
5.2 Probabilistic Precision, Recall, and F-Measure . . . 46
5.3 Relative Distance . . . 50
5.4 Experiments . . . 53
5.4.1 Results . . . 54
5.4.2 Attributes of the Non-binary Gold Standard . . . 54
5.4.3 Evaluation Using Probabilistic Precision, Recall, F-Measure 58 5.4.4 Evaluation Using Bounded Probabilistic Precision, Recall, and F-Measure . . . 61
5.4.5 Evaluation Using Relative Distance . . . 63
5.4.6 Robustness of the Results . . . 64
5.5 Summary, Observations and Findings . . . 67
6 Ranking-based Evaluation 71 6.1 Introduction to the Ranking-based Evaluation . . . 72
6.1.1 Evaluating with Confidence Values . . . 73
6.1.2 Foundations of the Ranking-based Evaluation . . . 74
6.2 Experiments of the Ranking-based Evaluation . . . 78
6.2.1 Results of the Ranking-based Evaluation . . . 79
6.2.2 Visualization of the Results . . . 82
6.3 Conclusions . . . 90
7 Evaluation by Automatic Classification to Matching Patterns 93 7.1 Introduction to the Automatic Classification into Matching Patterns 95 7.2 The Categories . . . 98
7.3 Metrics for the Categories . . . 102
7.4 Experiments . . . 104
7.4.1 Computational Results . . . 104
Contents 7.4.3 Results of the Matching Patterns using Probabilistic
Evalu-ation . . . 109
7.5 Conclusions . . . 110
8 Summary, Conclusions and Outlook 113 8.1 Thesis Summary . . . 114
8.2 Future Research . . . 116
8.2.1 Semi-automatically Generated Synthetic Test Scenarios . . 117
8.2.1.1 Transformation Rules of the Synthetic Test Sce-narios . . . 117
8.2.1.2 Conclusions . . . 119
8.2.2 Evaluation Portal . . . 119
8.2.3 Predicting the Performance of Matchers . . . 126
8.2.4 Additional Future Research Directions . . . 130
List of Figures
1.1 Two process models and possible correspondences as shown in (Kuss et al., 2016) . . . 3 1.2 Two process models and possible correspondences as shown in Kuss
et al. (2016) . . . 7 3.1 Example of a (small) process model of the University Admission
data set . . . 25 3.2 Example of a cutout of a process model of the Birth Registration
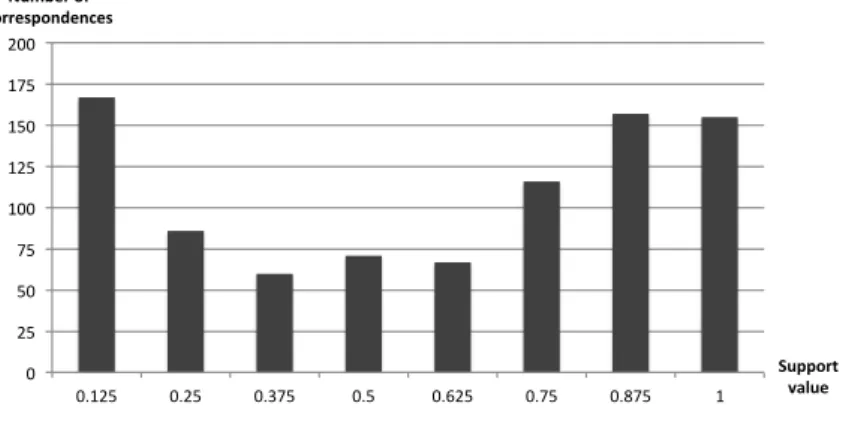
data set . . . 26 3.3 Example process model of the Asset Management data set . . . 27 5.1 Average support values of the test cases . . . 55 5.2 Distribution of support values in the non-binary gold standard of
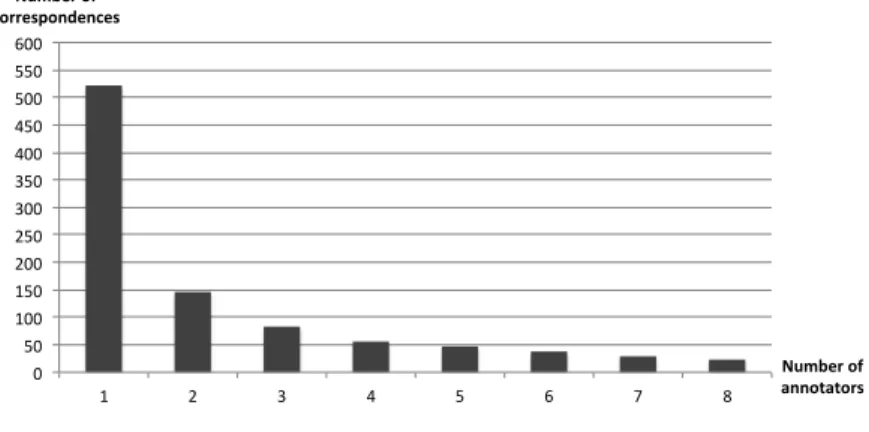
the University Admission data set . . . 56 5.3 Average increase of number of correspondences with additional
annotators . . . 57 5.4 ProP, ProR, and ProFM for different values ofτ . . . 62 5.5 Development of probabilistic evaluation measures with increasing
number of annotators . . . 66 6.1 Plots for a matcher with a rank-correlation of 1 . . . 82 6.2 Visualization of rank-correlation results for University Admission
data set. . . 83 6.2 Visualization of rank-correlation results for University Admission
data set (continued). . . 84 6.2 Visualization of rank-correlation results for University Admission
6.3 Visualization of rank-correlation results for the Birth Registration
data set. . . 87
6.3 Visualization of rank-correlation results for the Birth Registration data set (continued). . . 88
7.1 Example of a categorized reference alignment . . . 102
7.2 Structural dependencies of the categories . . . 103
8.1 Start of the Evaluation Portal . . . 121
8.2 Process of uploading the matcher output . . . 122
8.3 Upload of the matcher output, which should be evaluated . . . 123
8.4 Choice of evaluation metrics . . . 124
List of Tables
3.1 Data sets of the PMMC 2015 (Antunes et al., 2015) and 2013
(Cayo-glu et al., 2013a) . . . 24
3.2 Characteristics of the test data sets of the PMMC 2015 (Antunes et al., 2015) . . . 27
3.3 Results of University Admission data set . . . 29
3.4 Results of University Admission data set with subsumption . . . 29
3.5 Results of Birth Registration data set . . . 30
3.6 Results of Asset Management data set . . . 30
3.7 Avg and max results of the PMMC 2015 (Antunes et al., 2015) com-pared to 2013 (Cayoglu et al., 2013a) . . . 31
5.1 Exemplary matcher output and metrics . . . 48
5.2 Exemplary matcher output and metrics for Bounded probabilistic FM atτ = 0.75with the matchers of Table 5.1 . . . 50
5.3 Illustration of Relative Distance . . . 52
5.4 Results of probabilistic evaluation of the University Admission data set with non-binary gold standard . . . 59
5.5 Effect of gold standard on assessment of output of matcherAML-PM 59 5.6 Results of probabilistic evaluation of the Birth Registration data set with non-binary gold standard . . . 60
5.7 Results of probabilistic evaluation with non-binary gold standard for the University Admission data set . . . 63
5.8 Results of probabilistic evaluation with non-binary gold standard for the Birth Registration data set . . . 65
6.1 Range of confidence values of process matchers participating in the PMMC 2015 and the OAEI 2016/2017 . . . 73
6.2 Example of correlation coefficient calculation for an alignmentA
computed by a matching technique and the gold standardG. The
resulting correlation coefficient isρ= -0.07102 . . . 76
6.3 Behavior of rank-correlation illustrated by the output of eight ex-emplary matchers. . . 78
6.4 Results for the seven considered matchers from the University Ad-mission data set from the PMMC 2015 and the OAEI 2016/2017 for three evaluation procedures . . . 79
6.5 Results for the five considered matchers from the Birth Registration data set from the PMMC 2015 for three evaluation procedures. . . . 80
6.6 Number of computed alignments with the corresponding Union with the non-binary gold standard of the matchers exemplary for the University Admission data set . . . 81
7.1 Results of University Admission data set . . . 105
7.2 Results of Asset Management data set . . . 105
7.3 Results of Birth Registration data set . . . 106
7.4 False-positive (FP) and false-negative (FN) alignments for the three data sets and all matchers, assigned to the categories . . . 108
7.5 Results of Birth Registration data set using probabilistic evaluation 110 7.6 Results of University Admission data set using probabilistic evaluation 110 8.1 Summary of the introduced Evaluation Approaches . . . 116
8.2 Characteristics of the University Admission data set (with n=2) . . 127
8.3 Characteristics of the Birth Registration data set (with n=2) . . . 127
8.4 Characteristics of the Asset Management data set (with n=2) . . . . 127
8.5 Characteristics of the University Admission data set (with n=3) . . 128
8.6 Characteristics of the Birth Registration data set (with n=3) . . . 128
1
Introduction
In this chapter, we provide an introduction to the field of business process modeling. We focus our review on the main challenges of the evaluation techniques of process model matchers. In this context, we formulate research questions in the area of evaluating process matching techniques, which are addressed in this thesis. We then summarize the contributions of the thesis.1.1 Business Process Modeling
Business process modeling is a growing discipline in many companies. Conceptual models, like business process models, are commonly used to document a company’s operations. It aims in documenting the business processes within a company or institution. Business process modeling is widely used within a company for many reasons: For example to achieve transparency of the business processes or to make the processes comprehensible.
Weske (2012) describes a business process as follows:
“A business process consists of a set of activities that are performed in coordination in an organizational and technical environment. These activities jointly realize a business goal. Each business process is enacted by a single organization, but it may interact with business processes performed by other organizations.”
Consequently, business processes are targeted controlling instruments of oper-ations within a company or institution. Therefore the economical point of view of the process is transformed into a technical process. Within such processes, the activitiesof the process models describe an event or task. Examples for notations which are used to document business process models areBusiness Process Model-ing and Notation(BPMN) (Owen and Raj, 2003),Event-driven Process Chain(EPC) (Van der Aalst, 1999),Unified Modeling Language(UML) (Eriksson and Penker, 2000) orPetri-Nets(Murata, 1989; Van der Aalst, 1998).
Concrete applications are for instance the automation of manufacturing pro-cesses, the improvement of manufacturing propro-cesses, to generally increase the quality or to save costs. Thereforebusiness process modeling is part ofbusiness process management. Business Process Management contains the techniques, man-agement and tools which support the design and analysis of business processes. Business Process Models contain one or more Business Processes. In particular, applications are in the context of “Industry 4.0”, “Internet of things” and “Smart factory”. In this context, process models can be used, e.g., to fully automate the pro-duction process in factories. Another application of the development of business processes models is the quality management and best practices.
In some cases, the amount of data is too huge for manual processing business processes. The China railway company, for instance, stores more than 200 000 business process models (Ekanayake et al., 2011). This amount is too huge for manual processing, therefore in such cases automatic processing is required. One prominent example is the automatic matching of process models. In the next sec-tion we introduce to process model matching and provide an overview of current challenges in this field.
1.2 Business Process Model Matching
1.2 Business Process Model Matching
Business process model matching is concerned with the detection of similarities in business process models. On the one hand, the control flow of the process models is an important feature, on the other hand, semantic similarities of the labels are compared. The matching of the activities of the process models are called correspondences. Generally spoken, a matcher is a tool which automatically detects correspondences in business process models, or which supports an individual in generating correspondences, in order to save effort and time.
Figure 1.1: Two process models and possible correspondences as shown in (Kuss et al., 2016)
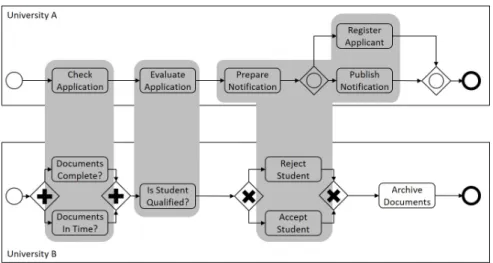
To highlight the challenges associated with such a matching task, we illustrate such specific difficulties in the example depicted in Figure 1.1. It shows two pro-cess models describing the steps students have to undertake to be admitted for the graduate programs of two different universities; in this case University A and University B. Possible correspondences are illustrated by gray shades.
Consider, for instance, the correspondence between “Check application” from University A and “Documents complete?” as well as “Documents in Time?" in the process of University B. A matching technique must be able to detect that in the process of University A a pre-check of the application is made, which is described at University B with the question if the documents are complete and in time. Such correspondences are1 : m correspondences (in this case 1:2 correspondences). Similarly, a matching system has to detect the presence of complex correspondence
between “Prepare Notification”, “Register Applicant” as well as “Publish Notification” with “Reject Student” and “Accept Student”. To automatically recognize that the latter three activities relate to a stream of action that can be referred to “Accept or Reject Student”, requires the recognition of complex semantic relationships. (This is an example for ann:mcorrespondence, here 3:2). Another complex matching is the correspondence between the activity “Evaluate” and “Is student Qualified?”. Here, a matching technique must be capable to automatically recognize that both activities evaluate if a student is suitable. This is especially challenging because on the one hand the words have no syntactical overlap and on the other hand one activity is a verb while the other activity is a sentence. Another challenge is the fact that not all activities from one process model are matched in the corresponding model (like in this example the activity “Archive Documents”).
Systems that automatically perform such matching tasks are calledmatching techniquesor shortlymatchers. To address such challenges associated with process model matching, many different matching techniques have been proposed in recent years. Typically, these techniques combine different measures to quantify the struc-tural as well as the textual similarity between the considered process models. The first matching techniques that have been defined combined structural measures such as the graph edit distance with syntactic text similarity measures such as the Levenshtein distance (Dijkman et al., 2009; Weidlich et al., 2010a). More recent techniques also consider semantic relationships between words, most commonly by building on the lexical database WordNet (Cayoglu et al., 2013b; Klinkmüller et al., 2013; Leopold et al., 2012). A few techniques also employ alternative strategies. Ex-amples include matching techniques incorporating human feedback (Klinkmüller et al., 2014), techniques selecting the most promising similarity measures based on prediction (Weidlich et al., 2013a), techniques selecting the best correspondences based on voting (Meilicke et al., 2017), and techniques that employ machine learn-ing (Sonntag et al., 2016). Weidlich et al. (2010a) presents a method forn:mnode matching.
Process matching techniques are relatively rarely used in practice compared to their many application scenarios. In order to fully exploit the potential in practice, the performance of process matching techniques needs to be improved. Consider-ing the variety of matchConsider-ing techniques that have been defined in previous work, a key question is how toevaluatethe performance of these techniques. While the specific technologies or model-related aspects exploited by the matching technique
1.3 Research Questions do not change how a matching technique needs to be assessed, the question is how to fairly quantify to what extent the generated correspondences are correct. Over-all, it can be observed that most research efforts are spend in advancing the process matching techniques compared to the advancement of their evaluation. However, the improvement process of process model matching techniques is closely linked to an efficient and fair evaluation. Current evaluation mostly relies on a ranking of the evaluated matching techniques. It provides a quantitative analysis of the matching results. However, it does not provide a detailed qualitative analysis. This research gap is filled in this thesis.
The Process Model Matching Contests (PMMCs) (Antunes et al., 2015; Cayoglu et al., 2013a) are the leading forum for the evaluation of process model match-ing techniques. However, these evaluation experiments assess the performance of matching techniques through a ranking. Consequently, they only provide limited information about the performance of matching techniques, e.g., detailed infor-mation about the strength and weaknesses of a matching technique are missing. However, the progress of process model matching techniques is strongly influenced by the available evaluation techniques. Important is that the evaluation techniques are “fair” and that they can be computed efficiently, i.e., without (intensive) manual labor.
In the next section, we discuss research questions which we address in this thesis.
1.3 Research Questions
In this section, we motivate and introduce the main research questions, which are addressed in this thesis.
1.3.1 Gold Standard Creation
The Oxford Dictionary1defines agold standardas follows:
“A thing of superior quality which serves as a point of reference against which other things of its type may be compared.”
Translated into the domain of process model matching, a gold standard is defined as the optimal result of a “perfect” matcher. But which result is literally optimal is
not that clear or conclusive as it may appear; in fact, this is highly subjective. We will elaborate on this in details below.
The gold standard, as of the state-of-the-art, has the following main weaknesses: • In evaluation experiments at least three experts are required to define a gold standard, who then discuss about the correspondences which have to be in-cluded into the gold standard. The correspondences which are considered by only one annotator, or a minority of annotators, is not considered in the gold standard, and thus in the evaluation treated as a wrong correspondence. If three different domain experts are asked to create a gold standard, each expert will identify a different set of correspondences as correct. The orga-nizers of the two Process Model Matching Contests (PMMC) 2013 and 2015 stated that there was not even a single pair of process models where two annotators fully agreed on (Antunes et al., 2015; Cayoglu et al., 2013a). This illustrates that it comes with high risk to define only a single set of correct correspondences. In other words, creating a gold standard is a highly subjec-tive task. This is ignored currently. For example, if three experts congregate to discuss about a gold standard, then the resulting gold standard strongly depends on those three experts.
• The procedure to yield a gold standard is very time consuming, since the experts need to discuss and agree on each of the correspondences.
• Generally, the definition of a gold standard has a high effect on the evaluation of matching techniques. All correspondences which are not part of the gold standard are considered as wrong, thus negatively affecting the performance of matchers. A binary evaluation does not differentiate if a correspondence is totally unrelated (thus wrong) or if a correspondence is arguable but related. This leads to unclear evaluation results.
• There is a considerable loss of information when forcing the experts to agree on one single set of correspondences. All other correspondences are excluded from the gold standard. This information is lost in the gold standard. Therefore, there is a need for a more fine-grained evaluation, which takes the arguability of correspondences into account. In the next section, we illustrate this in more detail with an example.
1.3 Research Questions
1.3.2 Absence of a “Perfect Match”
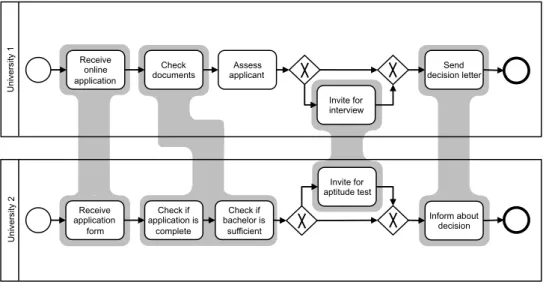
State-of-the-art evaluation procedures for process model matching techniques aim in assessing which of the correspondences identified by a matching technique are correct. While there seems to be no way to circumvent this basic assessment, there are nevertheless several problems attached to it. To illustrate these problems, consider the example depicted in Figure 1.2. It shows two simplified process models from the Process Model Matching Contest (PMMC) 2015 (Antunes et al., 2015). Possible correspondences are shown by gray markings.
Receive online application U ni ve rsi ty 1 U ni ve rsi ty 2 Check
documents applicant Assess
Invite for interview Send decision letter Receive application form Check if application is complete Check if bachelor is sufficient Inform about decision Invite for aptitude test
Figure 1.2: Two process models and possible correspondences as shown in Kuss et al. (2016)
Upon closer inspection of the correspondences shown in Figure 1.2, it becomes clear that, it is not that obvious to classify which correspondences are actually cor-rect. While there are arguments in favor of many of the correspondences, there are also counter arguments in many cases. Consider, for instance, the correspondence between “Receive online application” from the first University and “Receive applica-tion form” in the process of the second University. On the one hand, we can argue that these activities do not correspond to each other because the former relates to an online procedure, whereas the second refers to a paper-based application. On the other hand, we can argue in favor of this correspondence because both activ-ities deal with the receipt of an application document. Moreover, for the overall process, the concrete implementation of an activity is not important as long as the result of the activity is the same. Thus, it is disputable whether or not to accept
this correspondence as correct. There are similar arguments for matching “Invite for interview” on “Invite for aptitude test”. An interview is clearly a different assess-ment instruassess-ment than an aptitude test, which makes the correspondence disputable. However, we can argue again that the result of the activity is the same with respect to the overall process. By performing one of these activities, relevant knowledge is acquired that helps to decide upon the suitability of the applicant. Similar ar-guments can be given in favor or against the other correspondences depicted in Figure 1.2. Consider, for example, the correspondence “Send decision letter” and “Inform about decision”. On the one hand it can be argued in favor of this
correspon-dence, because the activities share the same purpose. However, on the other hand, the activity “Inform about decision” does not specify how this is conducted. And therefore one can argue against this correspondence.
These examples illustrate that it may be hard and, in some cases, even impossible to agree on a singlecorrectset of correspondences. Despite this, the evaluation of process model matching techniques currently depends on the definition of such a set of correct correspondences referred to asgold standard. This alignment is used in an evaluation context to distinguish between correct and incorrect correspondences given an alignment generated by a matching system. It finally is used for the computation of Precision, Recall, and F-Measure, which are the traditional measures used to evaluate process model matching techniques (cf. Antunes et al. (2015); Cayoglu et al. (2013a); Leopold et al. (2012); Weidlich et al. (2010a, 2013b)). Those binary evaluation measures are not always a suitable measure, since it does not fully account for the complexity of the matching task. The binary evaluation clearly states which correspondences are correct and which are not. But as we explained above, sometimes this is blurred. A binary gold standard, however, implies that any correspondence that is not part of the gold standard is incorrect and, thus, negatively affects the above mentioned metrics. This raises the question of why the performance of process model matching techniques is determined by referring to a single correct solution when human annotators may not even agree on what this correct solution is. To take the uncertainty in matching tasks into account, different evaluation metrics are required, which examine the performance of matchers from different perspectives.
1.3 Research Questions
1.3.3 How to Evaluate Process Model Matching Techniques?
In the previous section, we stated the problems associated with the definition of one single “perfect match”. Another important question is the evaluation technique. Currently the evaluation of process model matching techniques almost exclusively relies on Precision, Recall and F-Measure. Those measures rely on such a binary gold standard, as described above. Moreover, the metrics do not provide infor-mation about strength and weaknesses of the matchers. However, an important feature of an efficient evaluation technique is to identify potential for improvement. Therefore, it is necessary to provide a detailed overview about specific strength and weaknesses of the matchers. Besides the limitation of a fair assessment of the matching techniques, in the Process Model Matching Contests the evaluation experiments only provide a grading and ranking of the participating matching techniques. The evaluation experiments do not aim in providing a detailed analy-sis about specific strength and weaknesses of matching techniques and, therefore, do not aim in providing a feedback about possibilities for improvement. To pro-vide such feedback, currently it is necessary to manually process and interpret the matcher output. One central research question in this thesis is therefore how to automatize this expensive task.
Moreover, one central research question to achieve deeper insights about the performance of matchers is, how to determine what defines the complexity of a matching task. This is necessary to determine which matchers are able to perform well on complex data sets. In the current literature, complexity of process model matching tasks is associated with the different level of granularity of the process models, thus resulting in1 :morn:mcorrespondences (cf. Antunes et al. (2015); Makni et al. (2015); Weidlich et al. (2010b)). Although this is one aspect which makes a matching task complex, this is not the only one. In fact, complexity is for instance associated with the extent of syntactic overlap of the activities to be matched. If we look into details, we can observe that1 :mcorrespondences mostly have a low syntactic overlap, since the same activity is expressed in a different level of granularity, thus different ways.
Therefore, we propose an evaluation procedure, which classifies the matching task and matching results into different levels of complexity.
1.4 Contribution
This thesis contributes to the body of knowledge in several ways. The most signifi-cant contributions of this thesis can be summarized as follows:
• We propose a new approach towards a gold standard. We name it non-binary gold standard. To obtain this non-binary gold standard, experts individu-ally develop their own gold standard. Each assignment among the experts’ choices is then treated as a vote for the individual correspondence. In this way, each correspondence is assigned with a specific so-called support value. As a result a non-binary gold standard is derived. The proposed non-binary gold standard has the following three main advantages: First, the introduced non-binary gold standard incorporates the uncertainty of the correspondences, in contrast to the state-of-the-art gold-standard. In hardly any practical case “the true” gold standard is achievable. To define a single set of correct
cor-respondences strongly depends on the point of view of the annotators, but even more on the application. Therefore, relying on a binary gold standard does not account for the true complexity of a matching task. Moreover, it also does not account for the subjectivity, which is associated with such a task. Second, it is not necessary to fully agree on one single gold standard. This avoids the sophisticated task to agree on each correspondence, which is actually only feasible for a small group of annotators. Third, because it is no longer necessary to discuss about each correspondence among the an-notators, a higher number of annotators can contribute to the definition of a non-binary gold standard. This higher number of annotators additionally may increase the quality of the non-binary gold standard. The approach is presented in Section 5.1.
• We introduce a new evaluation procedure which fairer assesses the perfor-mance of matchers, since it takes the arguability of correspondences into account. We adapt Precision, Recall and F-Measure (ProP, ProR and ProFM), to allow non-binary values, derived from the non-binary gold standard. Fur-thermore, we introduce a new distance-based measure (ReD), which comple-ments the metrics from Information Retrieval. These metrics are presented in Section 5.2 and Section 5.3.
1.4 Contribution • We develop Bounded versions of ProP, ProR and ProFM, which are adapted to exclude values below a specific threshold in the non-binary gold standard. The non-binary evaluation identifies characteristics of a matcher to derive optimal matching scenarios for the matchers. In this way, we can identify matchers which focus on finding correspondences with a high support value in the data set. On the one hand such high-support correspondences are the most “sure” correspondences, however on the other hand such correspon-dences are also often rather obvious. For instance, “trivial” corresponcorrespon-dences mostly have a high support value in the non-binary gold standard. These Bounded versions of ProP, ProR and ProFM are presented in Section 5.2. • We introduce a fully non-binary evaluation procedure. In this evaluation
procedure, we consider the confidence values of the matchers, but not with their absolute values. Instead, the matcher output as well as the non-binary gold standard are transformed into a ranked collection of correspondences. Then, the confidence and support values are compared with respect to this ranking through a ranking-based correlation. In this way, it can also be assessed if the confidence values of the matchers reflect a realistic confidence of the correspondences. This evaluation method is presented in Chapter 6. • We propose a conceptually novel evaluation method, which is a
category-dependent evaluation via matching patterns. The idea is to automatically divide the matching task as well as the matcher output into categories with different complexity levels. Then standard metrics, like Precision, Recall and F-Measure, can be applied to each of the categories separately. We fur-ther compute the false-positive and false-negative alignments for each of the categories. In this way, we obtain an in-depth evaluation providing de-tailed information about the computed correspondences, where no manually processing of the matcher output is required. This category-dependent eval-uation better reveals strength and weaknesses of a matcher. The evaleval-uation procedure further allows to tune matchers to specific applications. The evalu-ation via matching patterns further allows for an assessment of the data set: it informs about the complexity of the matching task through the identification of the complexity and fraction of correspondences of a data set. Moreover, the quality of the gold standard can be assessed indirectly, e.g., quality and quantity of manual annotations. This is introduced in Chapter 7.
• We provide synthetic test cases, which complement the above described matching patterns, with attributes which cannot be assigned automatically. We furthermore provide an evaluation platform, where all metrics, intro-duced in this thesis, can be accessed. The synthetic data set and “Evaluation Portal” are described in Section 8.2.1 and Section 8.2.2.
• We apply the concepts and metrics introduced in this thesis at the OAEI 2016 and 2017 (Achichi et al., 2016, 2017).
Some of the work presented in this thesis has already been published:
• Kuss, Leopold, Van der Aa, Stuckenschmidt and Reijers: A probabilistic eval-uation procedure for process model matching techniques. Data & Knowledge Engineering, 2018
• Kuss, Leopold, Meilicke and Stuckenschmidt: Ranking-based evaluation of process model matching. On the Move to Meaningful Internet Systems. OTM 2017 Conferences: Confederated International Conferences: CoopIS 2017 • Kuss and Stuckenschmidt: Automatic classification to matching patterns for
process model matching evaluation. ER-Forum-Demos 2017
• Achichi et al.: Results of the Ontology Alignment Evaluation Initiative 2016. International Workshop on Ontology Matching co-located with the 16th In-ternational Semantic Web Conference (ISWC 2017)
• Kuss, Leopold, Van der Aa, Stuckenschmidt and Reijers: Probabilistic evalua-tion of process model matching techniques. ER 2016
• Achichi et al.: Results of the Ontology Alignment Evaluation Initiative 2016. International Workshop on Ontology Matching co-located with the 15th In-ternational Semantic Web Conference (ISWC 2016)
• Antunes et al.: The Process Model Matching Contest 2015. GI-Edition: Lec-ture Notes in Informatics, 2015
Publication which is not subject of the thesis:
• Meilicke, Leopold, Kuss, Stuckenschmidt and Reijers: Overcoming individ-ual process model matcher weaknesses using ensemble matching. Decision Support Systems, 2017
1.5 Thesis Outline
1.5 Thesis Outline
The remainder of the thesis is organized as follows:
• Chapter 2Background and Basic Definitions: introduces to basic notions and definitions, which we use as basis in this thesis. Moreover, we introduce the most common metrics from Information Retrieval, which we refer to in our experiments in this thesis.
• Chapter 3Process Model Matching Contests: in this chapter we present the results of the Process Model Matching Contest 2015 and compare those results to the results of the first Process Model Matching Contest 2013. Furthermore, in this chapter the data sets, which we refer to in this thesis, are described. • Chapter 4Related Work: discusses related work in the field of process model
matching evaluation and the evaluation of related fields like schema matching and ontology matching.
• Chapter 5Probabilistic Evaluation: in this chapter, the non-binary gold stan-dard is introduced. Moreover, we present the novel evaluation metrics, which are based on the non-binary gold standard.
• Chapter 6Ranking-based Evaluation: in this chapter, we introduce the com-pletely non-binary evaluation procedure, where we use the confidence values, given by some matchers, to calculate the Spearman’s rank correlation. • Chapter 7Evaluation by Automatic Classification to Matching Patterns: we
present our conceptually new evaluation procedure, where all correspon-dences of the data set as well as matcher output are classified into different categories, depending on the complexity level.
• Chapter 8Summary, Conclusions and Outlook: in this chapter, we summarize the main results of the thesis. Moreover, we give a comprehensive outlook of future research and present first results. Furthermore, we introduce an evaluation portal, where the metrics can be accessed.
2
Background and Basic
Definitions
In this chapter, we provide an overview of the basic notions and definitions, which we refer to in this thesis. These definitions serve as a basis of our own definitions, which we state in the corresponding chapters. Moreover, we provide a brief intro-duction to the most common metrics in the field of Information Retrieval, which are commonly used in state-of-the-art evaluation experiments.The chapter is organized as follows. Section 2.1 discusses the basic definitions in the context of business process modeling and process model matching, to lay the foundation for business model matching evaluation. Section 2.2 discusses basic notions in the field of Information Retrieval. Those notions are widely used in evaluation experiments of process model matching techniques and related fields like ontology matching and schema matching.
2.1 Basic Notions and Definitions
In the first chapter, we introduced the field of business process modeling and the matching of such process models. In the following, we provide a formal definition of the basic terms which we refer to in this thesis.
Based on the definition by Klinkmüller et al. (2014), we define a process model, and the corresponding set of activities, as follows:
Definition 1(Process model, set of activities). LetLbe a set of labels andT be a
set of events. Then a process modelPis a tuple(N, E, λ, τ), in which: • N is the set of nodes;
• E ⊆N ×N is the set of edges;
• λ:N → Lis a function that maps nodes to labels; and
• τ :N → T is a function that assigns types to nodes,
and which satisfies∀a∈act(P) ={a|a∈N ∧τ(a) = activity}
|{n|n∈N,(a, n)∈E}| ≤ 1 and (2.1)
|{n|n∈N,(n, a)∈E}| ≤ 1. (2.2)
Setact(P), also denoted byA, is called the set of activities for process modelP.
The definition of a process model involves the set of eventsT. Possible events
in a process model depend on the notation/format of the process models. Examples are “and”, “or”, “xor”. In our case, mainly the activities are relevant types of events for our considerations. Currently, the matching of process models is mostly based on a comparison of the label strings of the activities in the process models to be matched. Examples for such labels are “Check application” or “Register child”.
For a process modelP, we require that each nodeahas at most one control flow edge originating froma, as ensured by condition (2.1). Similarly, (2.2) ensures that each activity nodeahas at most one control flow edge into the nodea.
Definition 2(Process Model Matching). Given two Process ModelsP1andP2, the
goal of process model matching is to automatically identify pairs of equivalent or similar activities fromact(P1)×act(P2).
2.1 Basic Notions and Definitions By definition, process model matching aims at automatically identifying which activities in the process model describe an equal or similar behavior/task. Hence, activities fromP1 andP2, which relate to one of these tasks, are matched with
activities which describe the same or a similar task. Such pairs of activities are also calledcorrespondencesoralignments.
Matching techniques, which automatically identify such correspondences in process models, are also called matchers. Mostly the matching of process models is based on the labels strings of the activities. However, some matchers also take structural or background information into account. The result of a matching is called matcher output, which we formally define in the following:
Definition 3(Matcher output). For two process modelsP1andP2with their activity
setsA1andA2, a matcher outputOis a subset of all possible alignments, i.e.,O ⊆
A1×A2.
A matcher output is not just any random subset of possible alignments. Rather, the goal of a matcher is to identify activities which describe the same or a similar task. This is reflected in the matcher outputO.
In this thesis, we are not only interested in these activity pairs, but also in the confidence that the two activities are matched correctly. For that reason, we define a confidence of an alignment or correspondence betweenP1andP2as a function
A:act(P1)×act(P2)→[0,1].
We refer toA(a1, a2) as the confidence of correspondence(a1, a2) from the set
act(P1)×act(P2).
In the following, we distinguish between two types of alignments:
1. A binary alignment is an alignment that uses only two different
confi-dence values, i.e.,A(a1, a2) ∈ {0, α}for all(a1, a2) ∈ act(P1)×act(P2)
and someα >0. Typicallyαis set to 1. Therefore, a binary alignment only distinguishes between (probably) correct and (probably) incorrect correspon-dences.
2. A non-binary alignmentis an alignment that uses more than two values
from the range [0,1]. It can thus be used to assign confidence scores for
only between correct and incorrect. We define such an assignment in Section 5.1.
Binary as well as non-binary alignments can be created by human experts, by matching techniques, or by a combination of manual effort and automated match-ing techniques. Therefore, this distinction holds for correspondences, created by matching techniques (matcher output) as well as manually generated human as-sessments (gold standard). In all of these cases, confidence scores can be used to express in how far one should trust in the correctness of a generated correspon-dence. However, most of these approaches do not associate a clear probabilistic meaning to a specific value within a non-binary correspondence. This means, for example, that we cannot assume that a correspondence with a confidence of 1.0 will be correct for sure nor can we assume that a confidence score of 0.5 means that the probability that the correspondence is correct is exactly 50%. Nevertheless, all approaches have in common that a higher confidence value is intended to refer to a higher probability for being correct.
Based on the previous discussion, we define a binary gold standard as follows:
Definition 4(Binary Gold standard). LetA1andA2be the sets of activities of two
process modelsP1 andP2, respectively. Then, a binary human assessment can be
captured by the subsetH ⊆ A1 ×A2 and the confidence functionA : act(P1)×
act(P2) → {0,1}withA(a1, a2) = 1for all(a1, a2) ∈ H and 0 otherwise. Each
element(a1, a2) ∈ H specifies that a human assessor considers the activitya1 to
correspond to the activitya2. Such a binary human assessment is also called gold
standard or reference alignment.
Note two specific details related to this definition. First, Definition 4 also allows for one-to-many(1 :m)and many-to-many(n:m)relationships. If, for instance,
the elements(a1, a2)and(a1, a3)are both part ofH, then there exists a
one-to-many relationship between the activitya1 and the two activitiesa2anda3. The
advantage of capturing a complex correspondence based on several elementary correspondences is that the matching technique is not required to identify the entire complex correspondence. If it, for instance, identifies(a1, a2)but not(a1, a3), it
would at least get credit for having identified(a1, a2). Second, the information that
is available for deciding about a possible correspondence may vary from model to model. In general, we assume that the decision will be mainly based on the labels. If available, however, also data objects can provide valuable input.
2.2 Introduction to Metrics from Information Retrieval Such a binary gold standard is derived from an undefined number of annota-tors, resulting in one single gold standard, which the annotators have to agree on. Based on the definition of a binary gold standard, in Section 5.1, we define a non-binary gold standard in which we allow the assignment of non-binary values to the correspondences of the gold standard. This is an important generalization of the definition of a binary gold standard, which lies the necessary foundation for our proposed evaluation procedures.
In the evaluation experiments in this thesis, the task of a matcher is to match the process models pair-wise. The result of the matchers is then compared to a manually generated gold standard. The task of a matcher is to identify semantically similar alignments, i.e., to identify the correspondences of the gold standard. Because it is rarely possible to reach a perfect matching, i.e.,O=H, the matcher output needs to be evaluated. In the next section, we briefly introduce a selection of evaluation metrics, from the field of Information Retrieval, which we refer to in the evaluation experiments in this thesis.
2.2 Introduction to Metrics from Information Retrieval
In process model matching the metrics from Information Retrieval are widely used for evaluation experiments (Van Rijsbergen, 1979). Researchers in this field com-pare their matchers to the state-of-the-art by such metrics. This is conducted simi-larly in related fields like schema matching and ontology matching (Do et al., 2002; Euzenat et al., 2011). The advantage of those measures is that they are easy to compute and the results can be intuitively interpreted.
For the calculations of Precision, Recall and F-Measure, the matcher output is compared to a manually generated reference alignment, also called gold standard. Comparing the correspondences computed by a matcher to a manually generated gold standard, then each activity is classified into one of the following four at-tributes, with respect to the specific gold standard:
1. true-positive (TP), which are correctly computed correspondences; 2. true-negative (TN), which are correctly not-computed alignments;
3. false-positive (FP), which are correspondences which are computed but not correct;
4. false-negative (FN), which are correspondences which are correct, but not computed by a matcher.
By definition, those classifications depend on the choice of the particular gold standard. Then, the following formulas define Precision, Recall, F-Measure and Accuracy:
Precision: T P
T P +F P
Recall: T P
T P +F N
F-Measure: 2· Precision·Recall
Precision+Recall
Accuracy: T P +T N
T P +T N +F P +F N .
Therefore, Precision states the fraction of alignments, which are correct on the whole matcher output. Recall states the fraction of correct alignments of the gold standard, which are computed by the matcher. The F-Measure, is the harmonic mean of Precision and Recall. The Accuracy states the fraction of correct classi-fied correspondences, compared to all possible correspondences. The significance of the information content of the Accuracy measure is rather small for process model matching evaluation, since the Accuracy is a function of the number of true-negative (TN) correspondences. Typically, in big data sets there is a huge number of true-negative alignments. (This leads to a high absolute number of true-negative alignments). Therefore, the fraction of the relevant alignments on the total data set is low, leading to small differences between the matchers. Consequently, the information content of the Accuracy measure is very limited for the comparison of process model matching techniques. Even weak matchers typically achieve an accuracy of more than 90%.
The above described metrics can be either computed at the micro or the macro average. This distinction has its source in the structure of the matching task. Some data sets consist of a collection of process models, i.e., they contain different test cases. At the macro average, the metrics are computed pair-wise within a test case, then the results are averaged. In contrast, for the micro average, the metrics are calculated for the union of the correspondences of the entire data set.
2.2 Introduction to Metrics from Information Retrieval Macro average may result in inconsistencies, in particular if a test case is small. In this case it is possible that empty test cases exist, which can result in an inaccurate measurement. To make this clearer, see the following example, taken from the gold standard of the Process Model Matching Contest 2015 (Antunes et al., 2015) of the University Admission data set of the touple “University Frankfurt-University Hohenheim”:
The gold standard of this test case consists of two correspondences: • c1:Wait for results–Waiting for the response
• c2:Rejected–Rejection
There are only two correct correspondences. If a matcher does not detect any of these two correspondences, then the calculation of Precision is undefined. In this small example, where a matcher computes an empty test case, this means for the Precision: 0
0+0. The result for this is undefined. That means actually there is no
result for this test case. One can argue in favor to treat such cases as Precision of 1.0 since the matcher did not compute any correspondence at all, thus no incorrect correspondence is computed. This is very intuitive and was conducted this way in the Process Model Matching Contest 2015 (Antunes et al., 2015). However, on the other hand one can argue that a Precision of 1.0 is not valid since the matcher did not compute any correspondence at all. This shows that such empty alignments lead to unclear results which can be interpreted differently. In the data sets which we use for our evaluations, empty alignments for specific test cases of matchers and gold standards do occur. To avoid such inaccuracies and inconsistencies we always refer to the micro values for the rankings in all evaluation experiments of this thesis. We only use macro values to compare the values to the Process Model Matching Contests (Antunes et al., 2015; Cayoglu et al., 2013a).
In Information Retrieval, additional measures are introduced, e.g., a variety of different F-Measures with a differing weight of Precision and Recall. For more information, we refer the interested reader to Fawcett (2006) and Manning et al. (2008).
We discuss in Chapter 4 a selection of further measures for evaluation experi-ments.
In the next chapter, we introduce the Process Model Matching Contests where those metrics are used to conduct evaluation experiments.
3
Process Model Matching
Contests (PMMCs)
In this chapter, we describe the results of the Process Model Matching Contest 2015 (Antunes et al., 2015). We aim to draw conclusions for future evaluation experiments. Moreover, we compare the results of the Process Model Matching Contest 2015 to the results of the contest 2013 (Cayoglu et al., 2013a), to deduce the improvement of process model matching techniques in this time interval.Moreover, we describe the data sets which are used in this context and which we always take as basis for our evaluation experiments, which we conduct in this thesis.
The chapter is organized as follows, Section 3.1 introduces the data sets of the Process Model Matching Contest 2015 and compares them to the setting of the 2013 contest edition. In Section 3.2 the results of the matchers are presented. While
Section 3.3 compares the results of 2015 to the contest of 2013, Section 3.4 states conclusions which we can draw for future evaluation strategies.
3.1 Data Sets of the Process Model Matching Contest
In 2013, the first Process Model Matching contest was conducted. The idea was to deliver a common basis for evaluation and to indicate the improvement process of the matching techniques. The 2015 contest was part of the EMISA Workshop (Kolb et al., 2015) and included three different data sets (Antunes et al., 2015). Table 3.1 provides a comparison of the data sets which were used in the 2013 and 2015 edition of the contest. As we can see, the two contests share only one data set. (The differences of both University Admission data sets are explained below.)
PMMC 2013 PMMC 2015
University Admission (UA) x x (modified)
University Admission Sub (UAS) – x
Birth Registration (BR) x x
Asset Management (AM) – x
Table 3.1: Data sets of the PMMC 2015 (Antunes et al., 2015) and 2013 (Cayoglu et al., 2013a)
The data sets differ notably, on the one hand, due to the different formats. On the other hand due to their content. The models cover different issues of process modeling.
In the following, we give an overview of the three data sets and present an example for each data set.
3.1.1 University Admission Data Set (UA)
The first data set is the University Admission data set (Figure 3.1). This data set consists of nine admission processes of different German universities. The business process models are in BPMN-format with English text and were created by grad-uate students at the Humboldt University Berlin. In the Process Model Matching Contest 2013, the data set was in Petri-Nets; later it was transformed into BPMN. Moreover, the gold standard was improved compared to the 2013 version. In 2015, two gold standards were used. The first gold standard contains only activity
equiv-3.1 Data Sets of the Process Model Matching Contest alence, where the activities are classified as equivalent. The second gold standard also included activity subsumptions. This means that one activity is a subsump-tion of the corresponding activity. The data set contains abbreviasubsump-tions which are specific for the described processes. For instance, the abbreviation “GPA” stands for “Grade Point Average”. This is a grading scale to rank students according to their qualifications. A similar abbreviation is used in the second data set, the Birth Registration data set. However, in the context of the Birth Registration data set the abbreviation “GBA” has a different meaning. This illustrates one difficulty as-sociated with process model matching, where abbreviations may be used and are context-dependent in their meaning.
Figure 3.1: Example of a (small) process model of the University Admission data set
3.1.2 Birth Registration Data Set (BR)
The Birth Registration data set contains nine birth registration processes from Ger-many, Russia, South Africa, and the Netherlands. The business process models are in Petri-Nets and contain Englisch text. The models were created by graduate students at the Humboldt University Berlin and in the context of a process analy-sis in Dutch municipalities. It can be observed that the data set contains inexact language combinations, as well as dutch abbreviations. One example is again the abbreviation “GBA”, which is again used in a process model label. However, in this context “GBA” stands for “Gemeentelijke Basisadministratie Persoonsgegevens”, which is a local residents registration office. Abbreviations like this are especially difficult to detect for matching techniques, since the models are supposed to be in
English, but have to detect Dutch abbreviations. Moreover, the transitions contain label like “t3” and “t9”. This is also the case for some “places”, like for example “p6” or “p13” in our example (Figure 3.2). Therefore, a suitable match of such labels can only be performed if matchers take structural dependencies into account.
Figure 3.2: Example of a cutout of a process model of the Birth Registration data set
3.1.3 Asset Management Data Set (AM)
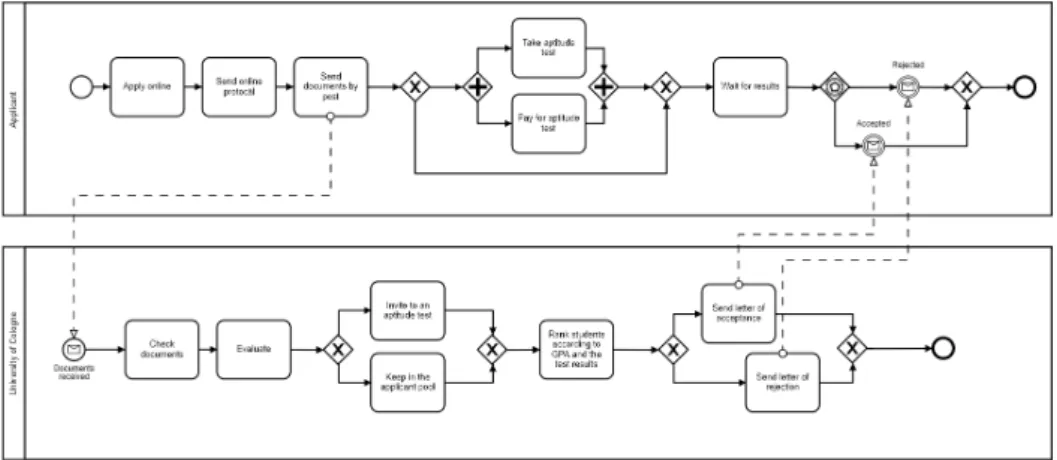
The Asset Management data set was firstly introduced in the 2015 process matching contest. The data set consists of 36 model pairs, derived from 72 models from the SAP Reference Model Collection. The process models cover different aspects from the area of finance and accounting. They are EPC models in EPML format, with English text. The data set is very specific due to the high amount of technical terms. The matchers need to have knowledge about those special technical terms. Some examples of such terms and specific abbreviations are covered in the example in Figure 3.3.
3.1.4 Characteristics of the Three Data Sets
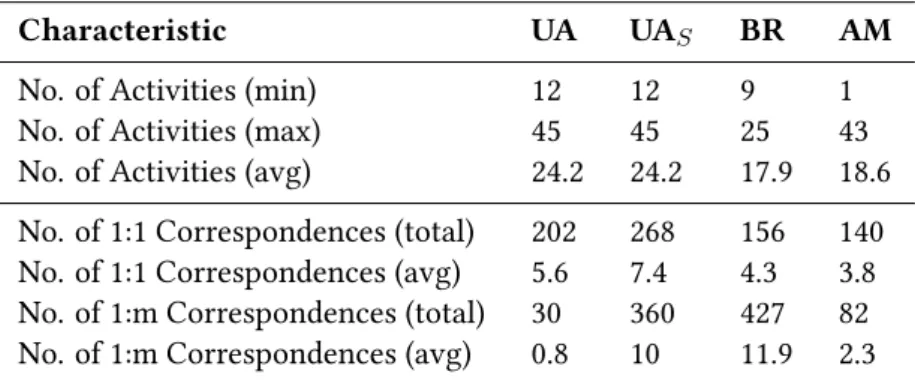
Table 3.2 summarizes some characteristics of the three data sets with its corre-sponding four gold standards. It states the size of the process models as well as the different level of granularity, by stating the minimal and maximal number of activ-ities and the number of1 :mcorrespondences. Such correspondences are difficult
3.1 Data Sets of the Process Model Matching Contest
Figure 3.3: Example process model of the Asset Management data set
Characteristic UA UAS BR AM
No. of Activities (min) 12 12 9 1
No. of Activities (max) 45 45 25 43
No. of Activities (avg) 24.2 24.2 17.9 18.6
No. of 1:1 Correspondences (total) 202 268 156 140
No. of 1:1 Correspondences (avg) 5.6 7.4 4.3 3.8
No. of 1:m Correspondences (total) 30 360 427 82
No. of 1:m Correspondences (avg) 0.8 10 11.9 2.3
Table 3.2: Characteristics of the test data sets of the PMMC 2015 (Antunes et al., 2015)
to detect, since they describe either a subset or a subsumption of the corresponding activity. We can see from the numbers in Table 3.2, that the Birth Registration data set consists of a high number of1 :mcorrespondences. This additionally increases the complexity of the data set, besides the characteristics which we state above. As we can see in Table 3.2, the number of1 :mcorrespondences increases for the gold standard which includes subsumptions. However, in some process model pairs the
1 :mcorrespondences are actually no subsumptions, but due to different level of granularity.
In the following, we give one example for such an1 :m(1:2) correspondence for the pair “University Cologne” and “IIS Erlangen”:
• “Check Application” – “Check application in time” • “Check Application” – “Check application complete”
This example illustrates an equivalence correspondence, because the same activ-ity is described in different level of detail, but describes the same process. Therefore, the 1:2 correspondence results from different level of granularity in the two process models. In fact, it is not an actual subsumption.
However, the data sets also contain subsumptions. An example for such a sub-sumption, in this case a1 : 3subsumption, are the correspondences:
• “Rank with applicants” – “Sum scores” • “Rank with applicants” – “Reject application” • “Rank with applicants” – “Accept application”
In this case, the subsumption correspondence do not describe an equal activity of the application process, but one activity is a subsumption of the other activity. Both kind of1 :mcorrespondences can be found in the data sets.
3.2 Results of the PMMC 2015
In the experiments of the contest the gold standards of the evaluation experiments were publicly available, except of the gold standard of the Asset Management data set. In the results (Tables 3.3 – 3.6), we state the micro- as well as the macro-values of Precision, Recall and F-Measure as described in Section 2.2. The reason is that in the 2013 edition of the contest only macro-values were computed. Therefore, to compare the results, we need to compare the macro-values of Precision, Recall and F-Measure. The best results for each metric in each data set are always highlighted in bold.
The results for the University Admission data set (Table 3.3) illustrate a high diversity of the quality of the matching results. The best F-Measure (micro-average) results are obtained by the RMM/NHCM (0.668), RMM/NLM (0.636) and MSSS (0.608).
For the University Admission data set, a second gold standard was used which included subsumptions to the gold standard. The results are shown in Table 3.4. Again the matcher RMM/NHCM achieves the best F-Measure (micro average of
3.2 Results of the PMMC 2015
Precision Recall F-Measure
Approach ∅-mic ∅-mac SD ∅-mic ∅-mac SD ∅-mic ∅-mac SD
RMM/NHCM .686 .597 .248 .651 .61 .277 .668 .566 .224 RMM/NLM .768 .673 .261 .543 .466 .279 .636 .509 .236 MSSS .807 .855 .232 .487 .343 .353 .608 .378 .343 OPBOT .598 .636 .335 .603 .623 .312 .601 .603 .3 KMSSS .513 .386 .32 .578 .402 .357 .544 .374 .305 RMM/SMSL .511 .445 .239 .578 .578 .336 .543 .477 .253 TripleS .487 .685 .329 .483 .297 .361 .485 .249 .278 BPLangMatch .365 .291 .229 .435 .314 .265 .397 .295 .236 KnoMa-Proc .337 .223 .282 .474 .292 .329 .394 .243 .285 AML-PM .269 .25 .205 .672 .626 .319 .385 .341 .236 RMM/VM2 .214 .186 .227 .466 .332 .283 .293 .227 .246 pPalm-DS .162 .125 .157 .578 .381 .38 .253 .18 .209
Table 3.3: Results of University Admission data set
Precision Recall F-Measure
Approach ∅-mic ∅-mac SD ∅-mic ∅-mac SD ∅-mic ∅-mac SD
RMM/NHCM .855 .82 .194 .308 .326 .282 .452 .424 .253 OPBOT .744 .776 .249 .285 .3 .254 .412 .389 .239 RMM/SMSL .645 .713 .263 .277 .283 .217 .387 .36 .205 KMSSS .64 .667 .252 .273 .289 .299 .383 .336 .235 AML-PM .385 .403 .2 .365 .378 .273 .375 .363 .22 KnoMa-Proc .528 .517 .296 .282 .281 .278 .367 .319 .25 BPLangMatch .545 .495 .21 .247 .256 .228 .34 .316 .209 RMM/NLM .787 .68 .267 .211 .229 .308 .333 .286 .299 MSSS .829 .862 .233 .19 .212 .312 .309 .255 .318 TripleS .543 .716 .307 .205 .224 .336 .297 .217 .284 RMM/VM2 .327 .317 .209 .27 .278 .248 .296 .284 .226 pPalm-DS .233 .273 .163 .316 .328 .302 .268 .25 .184
Table 3.4: Results of University Admission data set with subsumption
0.452), however the results decrease considerably, due to a strong decrease of Recall, which is halved, and at the same time a weak increase of Precision.
The results of the Birth Registration data set are given in Table 3.5. The matchers results are not as good as the results obtained for the University Admission data set. The best matcher (OPBOT) achieves a micro F-Measure of0.565. The reason
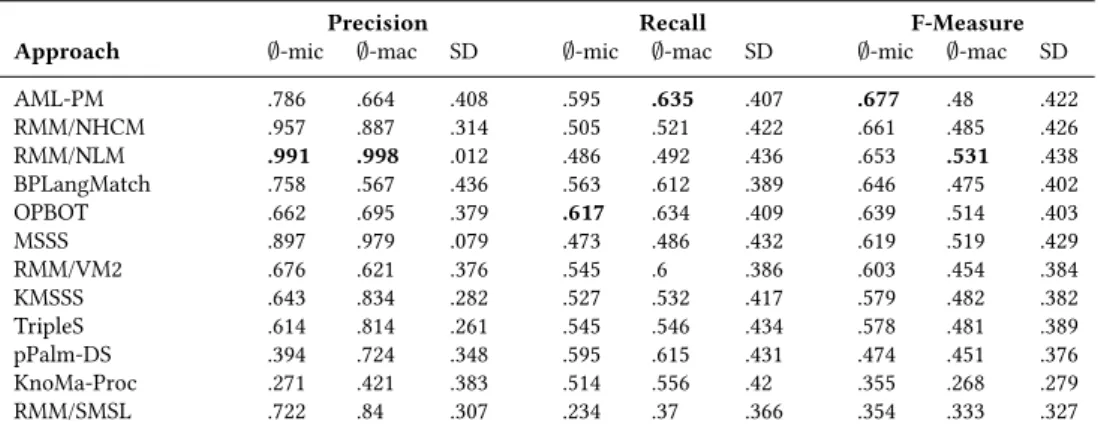
may be a higher complexity level of the Birth Registration data set. However, it may be also an issue of the quality of the gold standard. For the Asset Management data set (Table 3.6), the best results are achieved by AML-PM (micro F-Measure of 0.677). The results show that no matching technique has a high performance on all tested data sets.
Precision Recall F-Measure
Approach ∅-mic ∅-mac SD ∅-mic ∅-mac SD ∅-mic ∅-mac SD
OPBOT .713 .679 .184 .468 .474 .239 .565 .54 .216 pPalm-DS .502 .499 .172 .422 .429 .245 .459 .426 .187 RMM/NHCM .727 .715 .197 .333 .325 .189 .456 .416 .175 RMM/VM2 .474 .44 .2 .4 .397 .241 .433 .404 .21 BPLangMatch .645 .558 .205 .309 .297 .22 .418 .369 .221 AML-PM .423 .402 .168 .365 .366 .186 .392 .367 .164 KMSSS .8 .768 .238 .254 .237 .238 .385 .313 .254 RMM/SMSL .508 .499 .151 .309 .305 .233 .384 .342 .178 TripleS .613 .553 .26 .28 .265 .264 .384 .306 .237 MSSS .922 .972 .057 .202 .177 .223 .332 .244 .261 RMM/NLM .859 .948 .096 .189 .164 .211 .309 .225 .244 KnoMa-Proc .234 .217 .188 .297 .278 .234 .262 .237 .205
Table 3.5: Results of Birth Registration data set
Precision Recall F-Measure
Approach ∅-mic ∅-mac SD ∅-mic ∅-mac SD ∅-mic ∅-mac SD
AML-PM .786 .664 .408 .595 .635 .407 .677 .48 .422 RMM/NHCM .957 .887 .314 .505 .521 .422 .661 .485 .426 RMM/NLM .991 .998 .012 .486 .492 .436 .653 .531 .438 BPLangMatch .758 .567 .436 .563 .612 .389 .646 .475 .402 OPBOT .662 .695 .379 .617 .634 .409 .639 .514 .403 MSSS .897 .979 .079 .473 .486 .432 .619 .519 .429 RMM/VM2 .676 .621 .376 .545 .6 .386 .603 .454 .384 KMSSS .643 .834 .282 .527 .532 .417 .579 .482 .382 TripleS .614 .814 .261 .545 .546 .434 .578 .481 .389 pPalm-DS .394 .724 .348 .595 .615 .431 .474 .451 .376 KnoMa-Proc .271 .421 .383 .514 .556 .42 .355 .268 .279 RMM/SMSL .722 .84 .307 .234 .37 .366 .354 .333 .327
Table 3.6: Results of Asset Management data set
3.3 Comparison of the Results of the PMMC 2015 to the
Results of the PMMC 2013
In the following, we summarize the results of the 2015 contest and compare it with the results of the 2013 contest. The 2013 contest took place as part of the “4th International Workshop on Process Model Collections: Management and Reuse” (Cayoglu et al., 2013a). We want to learn in how far we can observe a progress of the matching techniques, in average but also compared to the best performances in 2013 and 2015.
To directly compare the results of 2013 to 2015, the setting has to be the same. This is not the case for those two PMMCs. The only data set which is unmodified
3.3 Comparison of the Results of the PMMC 2015 to the Results of the PMMC 2013 compared to the 2013 edition is the Birth Registration data set. Therefore, we use this data set for our comparisons.
In 2013, the best results were achieved by RefMod-Mine/NHCM with an macro average F-Measure of 0.45. (Note that we compare the macro values, because in the 2013 edition, only the macro values were computed.) Three matchers could not outperform those results from 2013: pPalm-DS (0.426), RMM/NHCM (0.416), and RMM/VM2 (0.402). In 2015, the best matcher on this data set is the matcher OPBOT with macro average F-Measure of 0.54. This is a significant improvement compared to 2013. However, the OPBOT did not participate in 2013. Therefore, it might be more telling to compare the average results of the participating matchers of 2013 to the average participating matchers of 2015 (which is≈0.35) in 2015 and
average approach in 2013 (≈0.29). This indicates a small progress. However, as
we indicate in the previous section, the Birth Registration data set is rather special in its characteristics. Therefore, it is difficult to draw a final conclusion about the progress of the matching systems only from this data set.
To compare the results even though the data sets differ, we can compare the average and best F-Measure for the matching techniques. Table 3.7 provides those information. We compare the two data sets which are used in the 2013 edition of the contest, even though the University Admission data set has been modified, compared to 2013. Thus, the comparison is only a hint about the improvement over the past two years. Again, we compare the macro-values of F-Measure, due to the missing micro-values in the contest 2013. As we can see, the results indicate a limited progress from 2013 to 2015 with regard to the average results. However, for the results of the best matchers, we observe a stronger increase of the macro F-Measure. UA BR Average Result 2013 (FM) .30 .29 Best Result 2013 (FM) .41 .45 Average Result 2015 (FM) .37 .35 Best Result 2015 (FM) .57 .54
Table 3.7: Avg and max results of the PMMC 2015 (Antunes et al., 2015) compared to 2013 (Cayoglu et al., 2013a)
3.4 Conclusions
In this chapter, we provided an introduction to the data sets of the Process Model Matching Contest 2015, which are a running example for our experiments in this thesis.
As we can observe from the results, most matchers aim in a high Precision and therefore miss a considerable amount of correspondences. To understand which correspondences are especially challenging for the matchers, it would be necessary to manually process the matcher output. The experiments from the PMMCs do not provide further information about the individual performance of matchers.
Only OPBOT and RMM/NHCM have a balanced Precision and Recall. More-over, only OPBOT and RMM/NHCM achieve rather good results for all data sets in the 2015 edition. To include the subsumptions into the gold standard leads to a strong decrease of Recall, with a small increase of Precision for some matchers, since most of the subsumption correspondences are not computed by the matchers. However, in the gold standard of the matching contest they do not always resemble real subsumptions, partially they are actually equivalence correspondences which results from different level of granularity of the process models. Therefore, the information content of this test data set is questionable, since it is a mixture of subsumptions and equivalence correspondences, which should be actually part of the “main” gold standard of the data set. This also explains the small increase of Precision of some matchers.
Moreover, we compared the results of the Process Model Matching Contest 2013 with the results of 2015, to measure the improvement in those two years. We can observe from the comparison that the progress to 2015 is limited, even though the different settings of the PMMCs make a comparison difficult and can only be considered as a hint.
Furthermore, we can state that the evaluation experiments in the two contests do not provide further information about the performance of matchers. It is much more a grading of the tested matching techniques.
Moreover, it does not provide detailed information about the gold standards. In fact, the gold standard has a high effect on the evaluation results. As we argued already in Section 1.3.2, the “perfect match” (gold standard) which is used for the evaluation experiments of the process model matching contest is in fact highly questionable. The organizers of the contest 2015 improved the gold standard