i TH E FI S C A L SU R V E Y O F ST A T E S • SP R I N G 2 0 1 2
THE NATIONAL GOVERNORS
ASSOCIATION
Founded in 1908, the National Governors Association (NGA) is the collective voice of the nation’s governors and one of Washington, D.C.’s, most respected public policy organiza-tions. Its members are the governors of the 50 states, three territories and two commonwealths. NGA provides governors and their senior staff members with services that range from representing states on Capitol Hill and before the Adminis-tration on key federal issues to developing and implementing innovative solutions to public policy challenges through the NGA Center for Best Practices. NGA also provides manage-ment and technical assistance to both new and incumbent governors.
2011-2012 Executive Committee
Governor Dave Heineman, Nebraska, Chair
Governor Jack Markell, Delaware, Vice Chair
Governor John Hickenlooper,Colorado
Governor Mitch Daniels, Indiana
Governor Deval Patrick, Massachusetts
Governor Mark Dayton, Minnesota
Governor Chris Christie, New Jersey
Governor Mary Fallin,Oklahoma
Governor Christine O. Gregoire, Washington
Dan Crippen, Executive Director
THE NATIONAL ASSOCIATION OF
STATE BUDGET OFFICERS
Founded in 1945, NASBO is the instrument through which the states collectively advance stage budget practices. The major functions of the organization consist of research, policy devel-opment, education, training, and technical assistance. These are achieved primarily through NASBO’s publications, mem-bership meetings, and training sessions. Association member-ship is composed of the heads of state finance departments, the states’ chief budget officers, and their deputies. All other state budget office staff are associate members. NASBO has four standing committees on major issues, Health and Human Services; Financial Management and Reporting; Education; and a 2011-2012 Critical Issue Committee on Lessons Learned from the Downturn. NASBO is an independent professional and education association and is also an affiliate of the National Governors Association.
2011-2012 Executive Committee
John Hicks,Kentucky, President
John Nixon,Michigan, Past President
Jason Dilges,South Dakota, President-Elect
Linda Luebbering,Missouri, Member-at-Large
David Treasure,Maryland, Member-at-Large
Thomas Mullaney,Rhode Island, Eastern Regional Director
Wayne Hammon,Idaho, Western Regional Director
Debbie Dlugolenski,Georgia, Southern Regional Director
Jerry McDaniel,Florida, Chair, Health and Human Services Committee
Gerry Oligmueller,Nebraska, Chair, Fiscal Management and Reporting Committee
Dan Timberlake,Virginia, Chair, Education Committee
George Naughton,Oregon, Chair, 2011-2012 Critical Issue Committee on Lessons Learned from the Downturn
The Fiscal Survey of Statesis published twice annually by the National Association of State Budget Officers (NASBO) and the National Governors Association (NGA). The series was started in 1979. The survey presents aggregate and individual data on the states’ general fund receipts, expenditures, and balances. Although not the totality of state spending, these funds are used to finance most broad-based state services and are the most important elements in determining the fiscal health of the states. A separate survey that includes total state spending, NASBO’s State Expenditure Report, also is conducted annually. The field survey on which this report is based was conducted by NASBO from March through April 2012. The surveys were completed by Governors’ state budget officers in all 50 states. This survey also includes Puerto Rico; however, their data is not included in the 50 state totals.
Fiscal 2011 data represent actual figures, fiscal 2012 figures are estimated, and fiscal 2013 data reflect governors’ recom-mended budgets.
Forty-six states begin their fiscal years in July and end them in June. The exceptions are Alabama and Michigan, with October to September fiscal years; New York, with an April to March fis-cal year; and Texas, with a September to August fisfis-cal year. Additionally, 20 states operate on a biennial budget cycle. NASBO staff member Michael Streepey compiled the data and prepared the text for the report.
vi NA T I O N A LGO V E R N O R SAS S O C I A T I O N • NA T I O N A LAS S O C I A T I O N O FST A T E BU D G E T OF F I C E R S
Preface
budget offices have completed official forecasts, 11 states are projecting $23.2 billion in budget gaps for fiscal 2014. State budget gaps that arise during the fiscal year are primarily solved through a reduction in previously appropriated spending. Fiscal 2012 was the first year since the recession where a large number of states did not make substantial mid-year budget cuts. To date, only eight states have reported a total of $1.7 bil-lion in enacted mid-year budget cuts for fiscal 2012, compared with 19 states enacting $7.4 billion in mid-year budget cuts in fiscal 2011, and 39 states enacting $18.3 billion in cuts in fiscal 2010. In addition to the mid-year budget cuts in fiscal 2012, one state—New York—enacted $340 million in mid-year tax in-creases through personal income tax reform.
Governors are proposing $6.7 billion in new net taxes and fees for fiscal 2013 with proposed sales and income tax increases in California and New York’s personal income tax reform ac-counting for the majority of the increase. Governors have also proposed $2.1 billion in new revenue measures. In response to severe revenue declines during and after the recession, states enacted a combined $31.6 billion in increased taxes and fees along with $17.2 billion in new revenue measures from fiscal 2009 to fiscal 2011. The expiration of temporary tax and fee in-creases, primarily in California and North Carolina, made fiscal 2012 the first year since the beginning of the recession that states’ newly enacted net revenues declined, leaving states with $600 million less from new taxes and fees and $2.6 billion less from revenue measures.
States have also relied on balances, including budget stabiliza-tion funds or “rainy day funds,” to help offset future revenue de-clines and increasing spending demands. Balances reflect the surplus funds that states may use to respond to unforeseen cir-cumstances. After reaching a peak of $69 billion or 11.5 per-cent of general fund expenditures in fiscal 2006, total balance levels fell to $32.5 billion or 5.2 percent of expenditures by the end of fiscal 2010. In fiscal 2012, states’ budgetary reserves slightly decreased, bringing balance levels to $43.6 billion or 6.5 percent of expenditures from $46.4 billion or 7.2 percent of expenditures in fiscal 2011. For fiscal 2013, governors’ recom-mended total balance levels of $53.2 billion, 7.8 percent of ex-penditures. The balance levels of Texas and Alaska make up 46.5 percent of total state balance levels in fiscal 2012 and 51.5 percent in fiscal 2013. The remaining 48 states have balance
levels that represent only 3.8 percent of general fund expendi-tures for fiscal 2012 and 4.0 percent for fiscal 2013.
States made difficult choices in fiscal 2012 partly because of the expiration of billions of dollars in federal support from ARRA. In fiscal 2010 and 2011, states were able to use $112.8 billion in flexible emergency ARRA funding. Spending from these flex-ible funds peaked in fiscal 2010 at $61.2 billion and then fell slightly to $51.6 billion in fiscal 2011. Fiscal 2012 marked the first time since fiscal 2009 that states implemented spending plans without enhanced Medicaid matching rates or substantial support from ARRA’s State Fiscal Stabilization Fund. The ex-piration of funds left states with only $4.5 billion in flexible emer-gency funding in fiscal 2012; that amount is projected to fall to $500 million in fiscal 2013. The drawdown in flexible ARRA funds is mostly due to the expiration of enhanced federal matching rates to states’ Medicaid programs. Improved rev-enue collections, along with successful cost controls, have helped states acclimate to the expiration of ARRA funds. As the economy slowly advances, state general fund spending is expected to increase, although at a slower rate than the his-torical average. Fiscal 2012 budgets have undergone a realign-ment to adjust for a declining share of federal dollars flowing to states through ARRA. Governors’ fiscal 2013 recommended spending plans reflect revenue constraints and an understand-ing that spendunderstand-ing priorities will again face competition for state budget dollars.
State Spending
Governors’ recommended general funding spending of $682.7 billion in fiscal 2013, 2.2 percent above the $668.1 billion esti-mated in fiscal 2012. Fiscal 2012 general fund expenditures are estimated to be 3.3 percent above the $646.8 billion spent in fiscal 2011.
Thirty-nine states recommended increasing general fund ex-penditures for fiscal 2013 compared to fiscal 2012. Even with these proposed increases, 25 states would still have lower gen-eral fund spending in fiscal 2013 compared to the pre-reces-sion peak levels of fiscal 2008.
Eight states have made budget cuts to their fiscal 2012 budg-ets totaling $1.7 billion. This is a significant improvement from fiscal 2011 when 23 states made mid-year budget cuts of $7.8
NA T I O N A LGO V E R N O R SAS S O C I A T I O N • NA T I O N A LAS S O C I A T I O N O FST A T E BU D G E T OF F I C E R S viii
ix TH E FI S C A L SU R V E Y O F ST A T E S • SP R I N G 2 0 1 2 billion and fiscal 2010 when 39 states made $18.3 billion in
mid-year cuts.
Medicaid Costs and Enrollment
Medicaid represents the single largest portion of total state spending, estimated to account for 23.6 percent of total spend-ing in fiscal 2011, the last year for which data is available. In fis-cal 2011, Medicaid comprised 17.4 percent of general fund spending, making it the second largest general fund spending category after K-12 education at 35 percent.
State funds directed towards Medicaid have increased dramat-ically in fiscal 2012, while federal spending rapidly declined due to the expiration of the enhanced federal matching rates tem-porarily authorized by the American Recovery and Reinvest-ment Act. State spending on Medicaid increased by 20.4 percent in fiscal 2012. Meanwhile, federal spending declined by 8.2 percent in fiscal 2012. Overall, governors’ proposed budgets for fiscal 2013 project a slower rate of growth in state Medicaid spending at 3.9 percent. However, even with this re-duced growth rate, Medicaid is still outpacing overall general fund expenditure growth in governors’ recommended budgets. Total Medicaid spending increased by 10.6 percent in fiscal 2011 and 1.1 percent in fiscal 2012, and is projected to in-crease by 3.4 percent in fiscal 2013. Persistent growth in total spending is primarily the result of both increased enrollment due to the lackluster labor market and increased per capita costs for health care. Medicaid enrollment increased by 5.1 percent during fiscal 2011 and 3.3 percent in fiscal 2012, and is pro-jected to increase by 3.6 percent in fiscal 2013. States have undertaken numerous actions to contain Medicaid costs, in-cluding reducing provider payments, cutting prescription drug benefits costs, limiting benefits, reforming delivery systems, ex-panding managed care, and enhancing program integrity ef-forts.
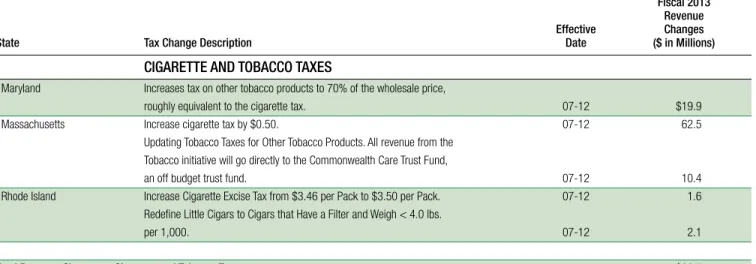
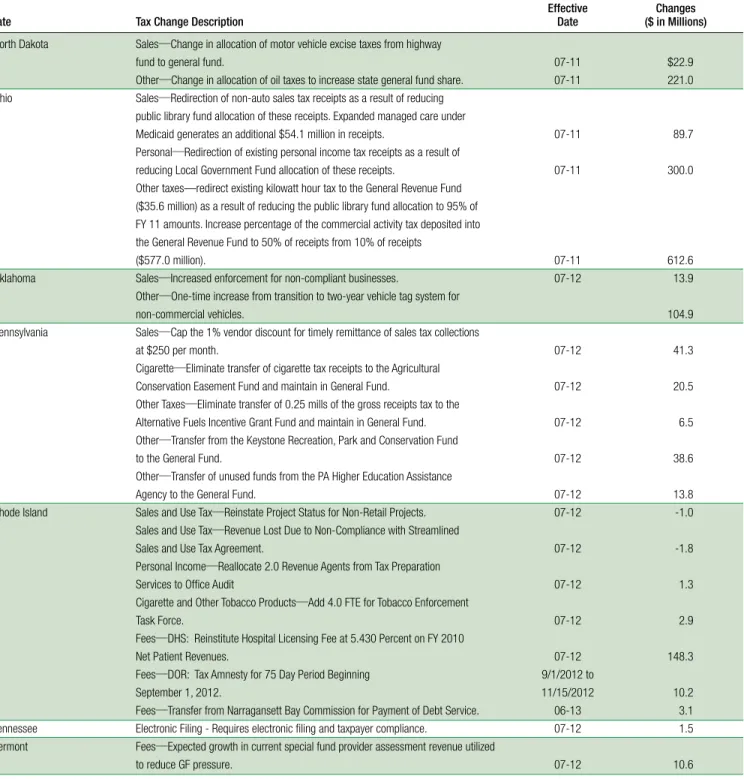
State Revenue Actions
Governors’ fiscal 2013 budgets recommend tax and fee changes that would increase general fund revenues by a cu-mulative $6.7 billion. Ten states recommended net increases while 15 proposed net decreases. Governors also proposed $2.1 billion in additional revenue measure increases. The
pro-posed increases in new taxes and fees in fiscal 2013 are greater than the $600 million in tax and fee decreases that were en-acted in fiscal 2012. However, the changes proposed for fiscal 2013 are considerably less than those adopted during the height of the recession in fiscal 2010, when states enacted $23.9 billion in tax and fee increases.
Fiscal 2012 general fund revenues from all sources, including sales, personal income, corporate income and all other taxes and fees, are exceeding original forecasts in 31 states, on target in six states and below forecasts in 13 states. When comparing current revenue collections to more updated forecasts, 15 states are above projections, 28 states are on target and three states are below. This suggests a number of states could finish fiscal 2012 with modest surpluses. While any surplus is a pos-itive sign, such surpluses are more likely the result of cuts in spending from previous fiscal years as well as conservative rev-enue forecasts.
Current estimates of sales, personal income and corporate in-come taxes combined are expected to finish fiscal 2012 with a 3.7 percent increase from the amounts collected in fiscal 2011. Forty-six states estimated increased sales tax collections in fis-cal 2012, but due to the expiration of temporary sales tax in-creases in California and North Carolina, sales taxes declined by 0.5 percent. Personal income taxes rose by 7.6 percent and corporate income taxes remained nearly flat in fiscal 2012 with a 0.3 percent increase.
General fund revenues are projected to increase by 4.1 percent in fiscal 2013 compared to fiscal 2012 collections. Governors’ recommended fiscal 2013 budgets project a 4.2 percent in-crease in sales tax revenue, 5.8 percent inin-crease in personal income tax revenue and a 2.0 percent increase in corporate income tax revenue. If state revenue collections reach the lev-els put forth in governors’ recommended budgets, fiscal 2013 revenue collections will surpass the pre-recession peak in fiscal 2008.
Generally, 80 percent of general fund revenue is derived from three tax sources: 40 percent from the personal income tax, 33 percent from the sales tax and seven percent from the corporate income tax. The other 20 percent is from various sources.
Year-End Balances
Total balances—ending balances and the amounts in budget stabilization “rainy day” funds—are a crucial tool that states heavily rely on during fiscal downturns and budget shortfalls. After reaching a peak in fiscal 2006 at $69 billion or 11.5 per-cent of general fund expenditures, the severe deterioration in state fiscal conditions resulted in balance levels falling to $32.5 billion or 5.2 percent of expenditures by fiscal 2010. Balance levels increased substantially in fiscal 2011 with states reporting total balance levels of $46.4 billion, 7.2 percent of general fund expenditures, and then declined slightly to $43.6 billion or 6.5 percent of expenditures in fiscal 2012.
Governors recommended raising total balance levels in fiscal 2013 to $53.2 billion or 7.8 percent of general fund expendi-tures. States made progress rebuilding budgetary reserves in fiscal 2011 and fiscal 2012; however, Alaska and Texas, two states with the largest reserves, still account for 46.5 percent of states’ total balances in fiscal 2012. The average of total bal-ances from the remaining 48 states is much lower—from a high of 10.6 percent in fiscal 2006 to 3.8 percent in fiscal 2012. They are projected to reach 4.0 percent by the end of fiscal 2013.
This edition of The Fiscal Survey of Statesreflects actual fiscal 2011, estimated fiscal 2012, and recommended 2013 figures. The data were collected in the spring of 2012.
1 TH E FI S C A L SU R V E Y O F ST A T E S • SP R I N G 2 0 1 2
State Expenditure Developments
CHAPTER ONE
Overview
State budgets displayed financial improvement in fiscal 2012, building on the progress made in fiscal 2011, which marked a turning point from the fiscal fallout caused by the Great Reces-sion. In fiscal 2012, general fund spending has risen 3.3 percent and governors forecast spending to rise again by 2.2 percent in fiscal 2013. If governors’ spending plans reach fruition, the result will be three consecutive years of general fund spending growth, helping states move beyond the state fiscal crisis years of fiscal 2009 and 2010. However, the national economy is re-covering slowly, and revenues are not growing fast enough to fully offset past budget cuts and the expiring Recovery Act funds, indicating fiscal challenges lie ahead for fiscal 2013 and beyond.
State Spending from All Sources
This report captures only state general fund spending. General fund spending represents the primary component of discre-tionary expenditures of revenue derived from general sources which have not been earmarked for specific items. According to the most recent edition of NASBO’s State Expenditure Re-port, estimated fiscal 2011 spending from all sources (general funds, federal funds, other state funds and bonds) is approxi-mately $1.7 trillion with the general fund representing 37.7 per-cent of the total. However, as reper-cently as fiscal 2008, general fund spending accounted for 45.8 percent of total state spend-ing. This decrease in the general fund’s impact on total state spending is evidence of the gap that ARRA funds have helped to fill. Federal funds went from representing 26.3 percent of total state spending in fiscal 2008 to an estimated 34.1 percent in fiscal 2011 due primarily to Recovery Act funds. The compo-nents of total state spending for estimated fiscal 2011 are: Medicaid, 23.6 percent; elementary and secondary education, 20.1 percent; higher education, 10.1 percent; transportation, 7.6 percent; corrections, 3.1 percent; public assistance, 1.6 percent; and all other expenditures, 33.9 percent.
For estimated fiscal 2011, components of general fund spend-ing are elementary and secondary education, 35.0 percent; Medicaid, 17.4 percent; higher education, 11.5 percent; cor-rections, 7.4 percent; public assistance, 1.8 percent; trans-portation, 0.5 percent; and all other expenditures, 26.5 percent.
State General Fund Spending
State general fund spending is forecast to be $682.7 billion based on governors’ proposed budgets for fiscal 2013. This represents an increase of 2.2 percent above the estimated $668.1 billion spent in fiscal 2012. The fiscal 2013 spending in-crease will be the third consecutive yearly inin-crease in general fund expenditures following back-to-back declines in general fund spending in fiscal 2009 and 2010, decreasing by 3.8 per-cent and 6.3 perper-cent respectively. Even with a 2.2 perper-cent in-crease in fiscal 2013, state general fund expenditures will still be $4.6 billion, 0.7 percent, below the $687.3 billion spent in fiscal 2008. Increased state general fund spending in fiscal 2013 is widespread with 39 states proposing a fiscal 2013 budget greater than enacted fiscal 2012 spending plans. How-ever, there are still 25 states with a proposed fiscal 2013 budget with general fund spending levels below fiscal 2008, indicating that many places across the country still face an uphill path to full recovery (See Table 1, Figure 1, and Tables 3 - 5.). For fiscal 2012, six states have general fund expenditures below fiscal 2011 levels, while 19 states had general fund ex-penditure growth between 0 and 4.9 percent, and 25 states had general fund spending growth greater than 5.0 percent. Fiscal 2012 general fund spending increased by 3.3 percent, improving on the largest increase in state spending since 2008, which occurred in fiscal 2011(See Table 2 and Table 6).
NA T I O N A LGO V E R N O R SAS S O C I A T I O N • NA T I O N A LAS S O C I A T I O N O FST A T E BU D G E T OF F I C E R S 2
TABLE 1
State Nominal and Real Annual Budget Increases,
Fiscal 1979 to Fiscal 2013
State General Fund
Fiscal Year Nominal Increase Real Increase
2013 2.2% 2012 3.3 0.8 2011 3.8 1.1 2010 -5.7 -6.3 2009 -3.8 -6.5 2008 4.9 -1.1 2007 9.4 4.4 2006 8.7 2.5 2005 6.5 0.9 2004 3.0 -0.4 2003 0.6 -3.1 2002 1.3 -0.6 2001 8.3 4.3 2000 7.2 2.9 1999 7.7 5.4 1998 5.7 4.1 1997 5.0 3.0 1996 4.5 2.2 1995 6.3 3.3 1994 5.0 2.7 1993 3.3 0.8 1992 5.1 2.9 1991 4.5 0.0 1990 6.4 2.5 1989 8.7 5.6 1988 7.0 3.2 1987 6.3 2.7 1986 8.9 5.6 1985 10.2 6.1 1984 8.0 3.8 1983 -0.7 -6.3 1982 6.4 -1.1 1981 16.3 5.1 1980 10.0 -0.8 1979 10.1 3.2 1979-2013 average 5.7% 1.6%
Notes: *The state and local government implicit price deflator cited by the Bureau of Economic Analysis in May 2012 is used for state expenditures in determining real changes. Fiscal 2011 figures are based on the change from fiscal 2010 actuals to fiscal 2011 actuals. Fiscal 2012 figures are based on the change from fiscal 2011 actuals to fiscal 2012 estimated. Fiscal 2013 figures are based on the change from fiscal 2012 estimated figures to fiscal 2013 recommended.
3 TH E FI S C A L SU R V E Y O F ST A T E S • SP R I N G 2 0 1 2
Figure 1:
Annual Percentage Budget Increases, Fiscal 1979 to Fiscal 2013
-10 -5 0 5 10 15 20 25 2011 2013 2010 2009 2008 2007 2006 2005 2004 2003 2002 2001 2000 1999 1998 1997 1996 1995 1994 1993 1992 1991 1990 1989 1988 1987 1986 1985 1984 1983 1982 1981 1980 1979 Nominal Per
centage Budget Incr
ease
Fiscal Year
TABLE 2
State General Fund Expenditure Growth,
Fiscal 2012 and 2013
Number of States
Fiscal 2012 Fiscal 2013 Spending Growth (Estimated) (Recommended)
Negative growth 6 9
0.0% to 4.9% 19 33
5.0% to 9.9% 16 8
10% or more 9 0
NOTE: Average spending growth for fiscal 2012 (estimated) is 3.3 percent; average spending growth for fiscal 2013 (recommended) is 2.2 percent. See Table 6 for state-by-state data.
NA T I O N A LGO V E R N O R SAS S O C I A T I O N • NA T I O N A LAS S O C I A T I O N O FST A T E BU D G E T OF F I C E R S 4
TABLE 3
Fiscal 2011 State General Fund, Actual (Millions)
Rainy
Beginning Total Ending Day Fund
Region/State Balance Revenues Adjustments Resources Expenditures Adjustments Balance Balance
Alabama** 72 6,855 0 6,927 7,359 -483 51 0 Alaska** 0 7,673 23 7,696 5,450 277 1,969 12,981 Arizona** -6 7,250 1,131 8,375 8,372 0 3 0 Arkansas 0 4,479 0 4,479 4,479 0 0 0 California* ** -4,507 93,489 927 89,910 91,549 1,439 -3,079 -3,797 Colorado* ** 137 7,086 150 7,373 6,928 0 446 157 Connecticut** 0 17,708 450 18,157 17,921 0 237 0 Delaware* 537 3,531 0 4,069 3,271 0 798 186 Florida 1,573 22,960 0 24,533 23,787 0 746 279 Georgia* ** 1,138 16,559 498 18,195 17,064 0 1,131 328 Hawaii -22 5,117 0 5,095 4,969 0 126 10 Idaho** 0 2,445 74 2,519 2,450 0 69 0 Illinois* ** 130 28,306 8,411 36,847 29,175 7,203 469 0 Indiana** 831 13,384 -54 14,161 13,050 -12 1,124 57 Iowa** 0 5,899 0 5,899 5,344 0 555 440 Kansas -27 5,882 0 5,855 5,667 0 188 0 Kentucky** 80 8,859 197 9,136 8,789 58 290 0 Louisiana** -108 7,770 106 7,768 7,782 0 -14 647 Maine 7 2,945 -10 2,942 2,859 63 20 71 Maryland** 344 13,537 347 14,228 13,238 0 990 624 Massachusetts* ** 903 33,075 0 33,978 32,078 0 1,901 1,379 Michigan** 187 7,385 1,198 8,770 8,217 0 554 2 Minnesota* ** 440 16,184 0 16,623 15,335 0 1,289 9 Mississippi 5 4,600 0 4,605 4,554 0 50 176 Missouri** 185 7,110 716 8,011 7,631 0 379 247 Montana** 311 1,783 -1 2,092 1,747 5 340 0 Nebraska** 297 3,494 33 3,824 3,322 0 502 313 Nevada** 314 3,261 148 3,722 3,459 -61 324 0 New Hampshire* ** 75 1,384 2 1,460 1,311 122 27 9 New Jersey* ** 804 28,913 -680 29,038 28,168 0 870 0 New Mexico* ** 278 5,468 62 5,808 5,307 0 501 501 New York* ** 2,302 54,447 0 56,749 55,373 0 1,376 1,206 North Carolina 237 19,157 194 19,588 19,006 0 582 296 North Dakota** 313 1,532 865 2,710 1,651 62 997 386 Ohio 510 27,763 0 28,274 27,429 0 845 0 Oklahoma** 42 5,750 -33 5,759 5,417 249 93 249 Oregon** -368 6,509 0 6,141 6,105 0 35 10 Pennsylvania** -294 26,347 3,160 29,213 28,140 0 1,073 0 Rhode Island** 22 3,084 -81 3,025 2,956 0 69 130 South Carolina* ** 246 5,633 0 5,879 5,167 0 712 712 South Dakota** 0 1,163 -15 1,148 1,148 0 0 107 Tennessee** 241 10,747 193 11,181 9,996 590 595 284 Texas** 917 39,767 -831 39,853 38,717 0 1,136 5,012 Utah -28 4,659 154 4,785 4,725 0 60 233 Vermont* ** 0 1,157 71 1,228 1,162 66 0 54 Virginia 132 16,166 0 16,299 15,457 0 841 299 Washington** -561 14,648 645 14,731 14,823 0 -92 1 West Virginia** 552 4,064 0 4,616 3,772 51 793 659 Wisconsin** 26 12,912 642 13,580 13,565 -70 86 0 Wyoming** 0 1,580 0 1,580 1,580 0 0 752 TERRITORIES Puerto Rico** 0 8,134 1,016 9,150 9,150 0 0 0 Total $8,268 $651,470 $678,432 $646,818 $22,056 $25,012
5 TH E FI S C A L SU R V E Y O F ST A T E S • SP R I N G 2 0 1 2
TABLE 4
Fiscal 2012 State General Fund, Estimated (Millions)
Rainy
Beginning Ending Day Fund
Region/State Balance Revenues Adjustments Resources Expenditures Adjustments Balance Balance
Alabama** 51 6,967 293 7,311 7,499 -188 0 0 Alaska** 0 8,928 54 8,982 6,935 382 1,665 14,783 Arizona** 3 7,634 1,276 8,913 8,521 0 392 0 Arkansas 0 4,567 0 4,567 4,567 0 0 0 California* -3,079 88,606 0 85,527 86,513 0 -986 -1,704 Colorado* ** 157 7,400 125 7,682 7,155 61 465 465 Connecticut 0 18,670 0 18,670 18,658 0 12 0 Delaware* ** 798 3,406 0 4,204 3,654 0 551 186 Florida 746 23,635 -30 24,351 23,387 374 590 494 Georgia* ** 1,131 17,428 0 18,559 17,428 0 1,131 328 Hawaii 126 5,525 0 5,651 5,545 0 106 26 Idaho** 69 2,553 39 2,661 2,529 28 104 0 Illinois** 469 31,392 1,829 33,690 28,483 4,738 469 276 Indiana** 1,124 14,170 228 15,522 13,742 -11 1,791 61 Iowa** 0 6,000 394 6,394 6,000 4 390 596 Kansas 188 6,243 0 6,431 6,129 0 303 0 Kentucky** 290 9,102 209 9,601 9,402 179 20 122 Louisiana** -14 8,067 55 8,108 8,094 14 0 647 Maine** 19 2,951 151 3,122 3,125 -4 0 42 Maryland** 990 14,016 240 15,246 15,041 0 205 672 Massachusetts* ** 1,901 32,519 0 34,420 32,881 0 1,539 1,393 Michigan** 554 7,986 914 9,454 8,959 0 495 258 Minnesota* ** 1,289 16,607 0 17,896 16,803 0 1,093 658 Mississippi 51 4,685 0 4,735 4,735 0 0 87 Missouri** 379 7,301 422 8,103 7,977 0 126 248 Montana 340 1,848 0 2,187 1,808 0 379 0 Nebraska** 502 3,643 -253 3,893 3,481 231 181 421 Nevada** 324 2,692 341 3,356 3,114 0 242 39 New Hampshire* ** 27 1,381 -11 1,397 1,248 137 13 9 New Jersey* 870 29,390 0 30,260 29,673 0 587 0 New Mexico* ** 501 5,576 11 6,088 5,600 0 488 488 New York* ** 1,376 57,214 0 58,590 56,915 0 1,675 1,306 North Carolina 583 18,823 319 19,724 19,683 0 41 296 North Dakota** 997 2,065 295 3,357 2,128 0 1,229 386 Ohio** 845 27,173 0 28,018 27,863 0 155 247 Oklahoma** 93 5,846 -32 5,907 5,799 0 108 0 Oregon** 35 6,741 -35 6,741 6,602 0 139 46 Pennsylvania** 1,073 25,812 210 27,095 27,161 -160 93 0 Rhode Island** 69 3,201 -91 3,179 3,173 0 6 150 South Carolina* ** 712 5,749 0 6,461 5,617 108 737 737 South Dakota** 0 1,216 32 1,249 1,211 28 10 97 Tennessee** 595 11,188 76 11,859 11,391 83 385 306 Texas** 1,136 41,152 -766 41,521 43,911 0 -2,390 6,135 Utah 60 4,751 56 4,867 4,867 0 0 233 Vermont* ** 0 1,189 43 1,232 1,234 -1 0 58 Virginia 841 16,104 0 16,945 16,399 0 546 302 Washington** -92 14,772 92 14,772 15,635 0 -863 129 West Virginia** 793 4,016 4 4,812 4,246 151 415 850 Wisconsin** 86 13,388 675 14,149 13,996 -77 230 0 Wyoming** 0 1,580 0 1,580 1,580 0 0 752 TERRITORIES Puerto Rico** 0 8,650 610 9,260 9,260 0 0 0 Total $19,005 $662,864 $689,035 $668,094 $14,866 $32,623
6 NA T I O N A LGO V E R N O R SAS S O C I A T I O N • NA T I O N A LAS S O C I A T I O N O FST A T E BU D G E T OF F I C E R S
TABLE 5
Fiscal 2013 State General Fund, Recommended (Millions)
Rainy
Beginning Ending Day Fund
Region/State Balance Revenues Adjustments Resources Expenditures Adjustments Balance Balance
Alabama** 0 7,068 16 7,084 6,842 0 242 0 Alaska** 0 8,218 0 8,218 6,402 0 1,816 16,517 Arizona** 392 8,018 1,141 9,551 8,963 0 588 0 Arkansas 0 4,728 0 4,728 4,728 0 0 0 California* -986 95,389 0 94,404 92,553 0 1,850 1,132 Colorado* ** 283 7,621 27 7,931 7,483 0 447 292 Connecticut 0 19,318 0 19,318 19,266 0 52 0 Delaware* ** 551 3,598 0 4,148 3,653 0 495 194 Florida** 590 24,602 626 25,823 24,766 0 1,056 709 Georgia* 1,131 18,260 0 19,391 18,260 0 1,131 328 Hawaii 106 5,778 0 5,884 5,808 0 76 69 Idaho** 104 2,700 -148 2,656 2,656 0 1 26 Illinois** 469 32,140 1,800 34,409 29,418 4,522 469 276 Indiana** 1,791 14,536 -13 16,314 14,251 425 1,639 64 Iowa** 0 6,252 286 6,538 6,244 -2 296 625 Kansas 303 6,252 0 6,555 6,090 0 465 0 Kentucky** 20 9,394 273 9,686 9,540 94 52 72 Louisiana** 0 8,407 0 8,407 8,407 0 0 647 Maine** 0 3,022 -84 2,938 2,945 -7 0 42 Maryland** 205 14,721 431 15,357 15,325 0 33 721 Massachusetts* ** 1,539 33,561 0 35,101 33,863 0 1,238 1,088 Michigan** 495 8,430 264 9,189 9,148 0 42 388 Minnesota* ** 1,093 17,230 0 18,323 17,316 0 1,008 658 Mississippi 0 4,708 0 4,708 4,614 0 94 100 Missouri** 126 7,586 353 8,064 7,964 0 100 250 Montana 379 1,929 0 2,308 1,885 0 423 0 Nebraska** 181 3,780 -149 3,812 3,551 5 256 414 Nevada** 242 2,844 332 3,419 3,176 0 243 39 New Hampshire* ** 13 1,415 -11 1,417 1,259 131 27 9 New Jersey* 587 31,515 0 32,101 31,801 0 300 0 New Mexico* 488 5,724 0 6,211 5,706 0 505 505 New York* ** 1,675 58,715 0 60,390 58,592 0 1,798 1,306 North Carolina 41 19,884 39 19,965 19,938 0 27 296 North Dakota** 1,229 2,074 305 3,608 2,215 16 1,377 403 Ohio** 155 29,092 0 29,247 29,033 0 214 247 Oklahoma** 108 6,252 0 6,359 5,973 0 386 0 Oregon 139 6,986 0 7,125 7,010 0 115 46 Pennsylvania** 93 27,060 0 27,153 27,139 4 11 4 Rhode Island** 6 3,366 -101 3,271 3,269 0 1 169 South Carolina* ** 737 5,988 -134 6,591 5,802 101 688 688 South Dakota** 0 1,234 39 1,272 1,246 10 16 113 Tennessee** 385 11,530 -50 11,865 11,583 282 0 356 Texas** -2,390 41,587 -452 38,745 37,139 0 1,606 7,321 Utah 0 4,961 121 5,082 5,073 0 9 233 Vermont* ** 0 1,258 39 1,297 1,301 -4 0 65 Virginia 546 16,645 0 17,191 17,178 0 13 438 Washington** -863 15,512 -7 14,643 15,764 0 -1,121 265 West Virginia** 415 4,150 0 4,565 4,215 -68 417 900 Wisconsin** 230 13,675 606 14,511 14,766 -410 155 0 Wyoming** 0 1,580 0 1,580 1,580 0 0 765 TERRITORIES Puerto Rico** 0 8,750 333 9,083 9,083 0 0 0 Total $12,606 $690,291 $708,451 $682,698 $20,654 $38,776
7 TH E FI S C A L SU R V E Y O F ST A T E S • SP R I N G 2 0 1 2
TABLE 6
General Fund Nominal Percentage Expenditure
Change, Fiscal 2012 and Fiscal 2013**
Fiscal Fiscal Region/State 2012 2013 Alabama 1.9% -8.8% Alaska 27.3 -7.7 Arizona 1.8 5.2 Arkansas 2.0 3.5 California -5.5 7.0 Colorado 3.3 4.6 Connecticut 4.1 3.3 Delaware 11.7 0.0 Florida -1.7 5.9 Georgia 2.1 4.8 Hawaii 11.6 4.7 Idaho 3.2 5.0 Illinois -2.4 3.3 Indiana 5.3 3.7 Iowa 12.3 4.1 Kansas 8.2 -0.6 Kentucky 7.0 1.5 Louisiana 4.0 3.9 Maine 9.3 -5.8 Maryland 13.6 1.9 Massachusetts 2.5 3.0 Michigan 9.0 2.1 Minnesota 9.6 3.1 Mississippi 4.0 -2.5 Missouri 4.5 -0.2 Montana 3.5 4.3 Nebraska 4.8 2.0 Nevada -10.0 2.0 New Hampshire -4.9 0.9 New Jersey 5.3 7.2 New Mexico 5.5 1.9 New York 2.8 2.9 North Carolina 3.6 1.3 North Dakota 28.9 4.1 Ohio 1.6 4.2 Oklahoma 7.1 3.0 Oregon 8.1 6.2 Pennsylvania -3.5 -0.1 Rhode Island 7.3 3.0 South Carolina 8.7 3.3 South Dakota 5.4 2.9 Tennessee 14.0 1.7 Texas 13.4 -15.4 Utah 3.0 4.2 Vermont 6.1 5.5 Virginia 6.1 4.8 Washington 5.5 0.8 West Virginia 12.6 -0.7 Wisconsin 3.2 5.5 Wyoming 0.0 0.0 TERRITORIES Puerto Rico 1.2 -1.9 Average 3.3% 2.2%
**Fiscal 2012 reflects changes from fiscal 2011 expenditures (actual) to fiscal 2012 expenditures (estimated). Fiscal 2013 reflects changes from fiscal 2012 expenditures (estimated) to fiscal 2013 expenditures (recommended).
Budget Cuts, Budget Gaps, and the
Recovery Act
One of the clearest signs of state fiscal stress is mid-year budget cuts, as these actions are evidence that states will not be able to meet previously set revenue collections forecasts. Through the first 10 months of fiscal 2012, eight states have made $1.7 billion in mid-year cuts (See Table 7). In fiscal 2011, 19 states made mid-year budget cuts totaling $7.4 billion. In fiscal 2010, 39 states made mid-year budget cuts totaling $18.3 billion, and in fiscal 2009, 41 states made mid-year budget cuts, totaling $31.3 billion. In sharp contrast to fiscal 2009 and fiscal 2010, minimal mid-year cuts in fiscal 2012 in-dicate that states fiscal situations are stabilizing and most have successfully adapted spending plans to the current economic environment.
In fiscal 2012, the primary program areas where many states made mid-year general fund expenditure cuts were K-12, higher education and corrections. Out of the eight states that made net mid-year cuts, six states cut K-12 education, seven states cut higher education, and seven states cut corrections. Medicaid also experienced cuts by a number of those states making mid-year cuts. Transportation and public assistance spending, both small portions of overall state general fund spending, drew the smallest number of mid-year cuts from states.
In addition to reduced spending, legislatively approved in-creases in taxes and fees can also be used to solve budget gaps. In fiscal 2012, the state of New York approved $340 mil-lion in mid-year cumulative tax and fee changes. Changes in personal income taxes accounted for all of the cumulative in-crease in tax and fee collections.
Mid-year budget cuts are almost always in response to budget gaps, differences between enacted levels of spending and
an-ticipated revenue collections. Revenue collections fell short of enacted spending levels in fiscal 2011 and fiscal 2012, which left states to solve $146.3 billion in budget gaps over the two year time period. Four states reported $3.1 billion in ongoing budget gaps that must be closed by the end of fiscal 2012. Continued improvement of state revenues collections is pro-jected to result in significantly less gaps between spending and revenue in fiscal 2013, indicating that future budget gaps will likely decline as state revenues surpass peak 2008 levels. Al-though not all state budget offices have completed forecasts, thus far 19 states are projecting $30.7 billion in budget gaps for fiscal 2013 and 11 states are projecting $23.2 billion in budget gaps for fiscal 2014.
In order to eliminate budget gaps, states engaged in a number of actions in fiscal 2012. States are also planning strategies for closing potential budget gaps in fiscal 2013 and fiscal 2014. In fiscal 2012, the actions taken most consistently were targeted cuts, which were put in place by 30 states, as well as reduced local aid, which occurred in 17 states. Five states addressed the budget gap by making use of their “rainy day” fund. States also helped solve budget gaps by reducing the budgetary im-pact of state personnel costs with 15 states implementing em-ployee layoffs and 12 states cutting state emem-ployee benefits. To eliminate fiscal 2013 budget gaps, 26 states expect to use specific, targeted cuts, while 11 states anticipate across the board cuts. Another 14 states reported fiscal 2013 budget gaps will be partly solved with reduced aid to localities and 5 states will draw on “rainy day” funds. Additionally, a number of states continue to look to their workforce to help reduce budget gaps, with 11 states recommending layoffs and 9 states rec-ommending cuts to state employee benefits. While few states were able to project how budget gaps will be addressed in fis-cal 2014, several expect targeted cuts will be part of the solu-tion(See Tables 14, 15, and 16).
9 TH E FI S C A L SU R V E Y O F ST A T E S • SP R I N G 2 0 1 2
TABLE 7
Mid-Year Budget Cuts Made After the Fiscal 2012 Budget Passed**
FY 2012Size of Cuts Programs or Expenditures Region/State ($ in Millions) Exempted from Cuts
Alabama $187.9 Debt Service
California 821.7
Connecticut 78.7 Municipal Aid
Hawaii 10.3 Non-discretionary and non-general fund programs.
Louisiana 251.2 K-12 Minimum Foundation Program
Missouri* 113.2 K-12 Foundation Formula
Pennsylvania* 156.4
Washington 91.0 Basic Education, Higher Education, Debt Service, Retirement contributions
Total $1,710.4 —
10 NA T I O N A LGO V E R N O R SAS S O C I A T I O N • NA T I O N A LAS S O C I A T I O N O FST A T E BU D G E T OF F I C E R S
Table 8
Fiscal 2012 Mid-Year Program Area Cuts
K-12 Higher Public
Region/State Education Education Assistance Medicaid Corrections Transportation Other
Alabama x x Alaska Arizona* Arkansas California x x x x x Colorado Connecticut x x x x Delaware Florida Georgia* x Hawaii x x x x Idaho* Illinois Indiana Iowa Kansas Kentucky Louisiana x x x x x x Maine* x x x x Maryland Massachusetts Michigan Minnesota Mississippi Missouri x x x x x Montana Nebraska Nevada New Hampshire New Jersey New Mexico New York North Carolina North Dakota Ohio Oklahoma Oregon Pennsylvania x x x x x x Rhode Island South Carolina South Dakota Tennessee Texas Utah Vermont Virginia Washington x x x x x x x West Virginia Wisconsin Wyoming TERRITORIES Puerto Rico Total 7 9 3 6 8 3 8
11 TH E FI S C A L SU R V E Y O F ST A T E S • SP R I N G 2 0 1 2
Table 9
Fiscal 2013 Recommended Program Area Cuts
K-12 Higher Public
Region/State Education Education Assistance Medicaid Corrections Transportation Other
Alabama X X X X Alaska X Arizona Arkansas California X X X X Colorado X Connecticut X X Delaware X Florida X X Georgia Hawaii X X X Idaho* Illinois X X X Indiana Iowa Kansas X X X Kentucky X X X Louisiana X X X Maine X X X X Maryland Massachusetts X Michigan X X Minnesota X X X X Mississippi X X X X X Missouri X X Montana Nebraska Nevada X X X X New Hampshire New Jersey X X X New Mexico New York X North Carolina North Dakota Ohio* X X Oklahoma Oregon Pennsylvania X X X X Rhode Island X X South Carolina South Dakota Tennessee Texas Utah Vermont X X X Virginia X Washington X X X X X X X West Virginia Wisconsin Wyoming TERRITORIES Puerto Rico X X X X Total 7 13 14 9 13 7 12
12 NA T I O N A LGO V E R N O R SAS S O C I A T I O N • NA T I O N A LAS S O C I A T I O N O FST A T E BU D G E T OF F I C E R S
Table 10
Fiscal 2012 Mid-Year Program Area Cuts (Millions)
K-12 Higher Public
Region/State Education Education Assistance Medicaid Corrections Transportation Other Total
Alabama $0.0 $0.0 $0.0 $68.4 $0.0 $0.0 $119.5 $187.9 Alaska Arizona Arkansas California* 350.6 302.0 18.6 20.0 130.5 821.7 Colorado Connecticut 3.2 6.6 2.5 66.4 78.7 Delaware Florida Georgia* 32.3 32.3 Hawaii 3.6 1.0 0.2 5.5 10.3 Idaho Illinois Indiana Iowa Kansas Kentucky Louisiana* 3.5 116.2 53.8 12.3 24.4 41.0 251.2 Maine* 5.5 0.8 4.0 0.5 10.8 Maryland Massachusetts Michigan Minnesota Mississippi Missouri* 19.8 3.1 13.9 2.0 74.4 113.2 Montana Nebraska Nevada New Hampshire New Jersey New Mexico New York North Carolina North Dakota Ohio Oklahoma Oregon Pennsylvania 14.3 26.4 2.1 23.0 0.6 90.0 156.4 Rhode Island South Carolina South Dakota* Tennessee Texas Utah Vermont Virginia* Washington 4.0 38.0 7.0 1.0 41.0 91.0 West Virginia Wisconsin Wyoming TERRITORIES Puerto Rico Total $384.7 $505.1 $45.1 $156.8 $67.5 $26.0 $568.3 $1,753.5
13 TH E FI S C A L SU R V E Y O F ST A T E S • SP R I N G 2 0 1 2
Table 11
Fiscal 2013 Recommended Program Area Adjustments (Millions)
K-12 Higher Public
Region/State Education Education Assistance Medicaid Corrections Transportation Other Total
Alabama -$307.8 -$43.1 $0.0 -$143.8 $0.0 $0.0 -$42.2 -$536.9 Alaska 16.9 6.3 9.5 45.1 33.4 -7.5 175.4 279.1 Arizona* 222.5 29.0 61.3 96.7 30.4 198.2 638.1 Arkansas California* 3,877.0 -871.0 -979.8 195.4 -1,077.0 -44.6 5,516.0 6,616.0 Colorado* 75.2 -30.2 138.7 11.7 71.4 266.8 Connecticut 147.9 19.0 -8.7 103.3 -51.4 348.6 558.7 Delaware* 62.8 2.7 8.5 24.1 3.1 -65.3 35.9 Florida 869.0 -248.3 490.0 -115.5 328.6 1,323.8 Georgia 251.4 103.1 208.5 67.1 63.5 359.3 1,052.9 Hawaii -19.7 -4.2 2.7 1.9 -4.3 176.1 152.5 Idaho 31.7 24.4 44.8 8.6 17.0 126.5 Illinois 31.8 68.3 -89.3 87.1 -111.9 -2.0 694.5 678.5 Indiana Iowa 39.0 32.0 49.0 14.0 96.0 230.0 Kansas -42.0 42.0 -10.0 163.0 3.0 -195.0 -39.0 Kentucky -21.9 -66.2 -100.4 -188.5 Louisiana* 28.4 -23.1 279.1 -55.1 -100.5 128.8 Maine -4.8 -3.2 -47.5 -0.3 10.2 -45.6 Maryland* 28.8 27.9 31.8 0.1 28.7 458.9 576.1 Massachusetts 156.4 22.9 11.6 604.7 142.8 -14.7 837.7 1,761.4 Michigan* 47.2 -3.8 -126.0 93.3 259.1 269.8 Minnesota* 636.7 -0.3 -16.7 -23.0 0.9 -84.8 512.8 Mississippi -97.4 -53.5 -36.4 366.7 -15.0 -98.4 66.0 Missouri 193.9 -53.2 8.0 6.0 11.4 -6.2 159.9 Montana* Nebraska 9.4 8.9 6.7 36.6 1.0 7.5 70.1 Nevada 25.7 0.1 -0.1 -17.2 -2.5 -12.2 -6.2 New Hampshire New Jersey 212.5 114.6 -0.9 -148.1 -30.6 91.0 918.0 1,156.5 New Mexico 97.2 13.4 0.1 41.0 9.1 33.2 194.0 New York* 358.0 137.0 244.0 239.0 -41.0 338.0 385.0 1,660.0 North Carolina North Dakota Ohio -2.1 1.8 -23.2 -23.5 Oklahoma 99.7 25.1 124.8 Oregon Pennsylvania* 324.7 -247.9 -150.5 214.1 4.3 -5.8 -161.4 -22.5 Rhode Island 69.0 11.1 -0.3 -25.9 1.1 71.6 126.6 South Carolina 3.8 1.5 176.2 65.2 246.7 South Dakota* 48.8 22.8 7.5 34.5 2.7 4.0 35.7 156.0 Tennessee 83.5 18.4 0.9 74.5 50.4 359.3 587.0 Texas Utah 111.0 23.4 27.8 156.5 25.4 40.3 384.4 Vermont* -1.1 -6.3 -0.5 -7.9 Virginia 180.5 108.4 7.8 150.4 38.9 -23.9 168.3 630.4 Washington -644.0 -140.0 -66.0 -20.0 -52.0 -3.0 -176.0 -1,101.0 West Virginia 7.6 4.5 32.4 52.8 14.4 14.2 125.9 Wisconsin* Wyoming TERRITORIES Puerto Rico -65.3 52.3 21.2 -18.4 -1.2 -165.8 -177.2 Total $7,063.5 -$895.3 -$905.1 $3,523.8 -$961.5 $494.7 $10,604.7 $18,924.9
14 NA T I O N A LGO V E R N O R SAS S O C I A T I O N • NA T I O N A LAS S O C I A T I O N O FST A T E BU D G E T OF F I C E R S
Table 12
Enacted Mid-year Fiscal 2012 Revenue Actions by Type of Revenue and Net Increase or Decrease*
(Millions)
Personal Corporate Cigarettes/ Motor Other
Region/State Sales Income Income Tobacco Fuels Alcohol Taxes Fees Total
Alabama $0.0 Alaska 0.0 Arizona 0.0 Arkansas 0.0 California 0.0 Colorado 0.0 Connecticut 0.0 Delaware 0.0 Florida 0.0 Georgia 0.0 Hawaii 0.0 Idaho 0.0 Illinois 0.0 Indiana 0.0 Iowa 0.0 Kansas 0.0 Kentucky 0.0 Louisiana 0.0 Maine 0.0 Maryland 0.0 Massachusetts 0.0 Michigan 0.0 Minnesota 0.0 Mississippi 0.0 Missouri 0.0 Montana 0.0 Nebraska 0.0 Nevada 0.0 New Hampshire 0.0 New Jersey 0.0 New Mexico 0.0 New York* 385.0 -45.0 340.0 North Carolina 0.0 North Dakota 0.0 Ohio 0.0 Oklahoma 0.0 Oregon 0.0 Pennsylvania 0.0 Rhode Island 0.0 South Carolina 0.0 South Dakota 0.0 Tennessee 0.0 Texas 0.0 Utah 0.0 Vermont 0.0 Virginia 0.0 Washington 0.0 West Virginia* -11 -22.0 -33.0 Wisconsin 0.0 Wyoming 0.0 TERRITORIES Puerto Rico 0.0 Total -$11.0 $385.0 -$67.0 $0.0 $0.0 $0.0 $0.0 $0.0 $307.0
NA T I O N A LGO V E R N O R SAS S O C I A T I O N • NA T I O N A LAS S O C I A T I O N O FST A T E BU D G E T OF F I C E R S 16
TABLE 13
Strategies Used to Reduce or Eliminate Budget Gaps, Fiscal 2012
Higher Education Court Transportation/User Related Related Motor Vehicle Business Early Salary
Region/State Fees Fees Fees Related Fees Related Fees Layoffs Furloughs Retirement Reductions
Alabama X Alaska Arizona* X X X X X Arkansas California* X X X X X X Colorado* Connecticut* X X X Delaware Florida X Georgia Hawaii* X X X X X Idaho Illinois X X Indiana Iowa Kansas X X Kentucky Louisiana X X Maine Maryland* X X X X Massachusetts X Michigan* X X Minnesota Mississippi Missouri X Montana Nebraska* X Nevada* X X X X X X X X New Hampshire New Jersey New Mexico* X New York* X North Carolina North Dakota Ohio X Oklahoma Oregon* X X X X X X X Pennsylvania Rhode Island South Carolina X X South Dakota* X Tennessee* Texas Utah Vermont X X X Virginia Washington X X X West Virginia* Wisconsin* Wyoming TERRITORIES Puerto Rico X Total 9 8 6 8 5 15 3 3 6
NOTE: *See Notes to Table 13 on page 31.
17 TH E FI S C A L SU R V E Y O F ST A T E S • SP R I N G 2 0 1 2
TABLE 13
(Continued)Strategies Used to Reduce or Eliminate Budget Gaps, Fiscal 2012
Cuts to State Across- Rainy Gaming/
Employee the-Board Targeted Reduce Reorganize Day Lottery Gambling Other
Region/State Benefits Percent Cuts Cuts Local Aid Agencies Privatization Fund Expansion Expansion (Specify)
Alabama X X Alaska Arizona* X X X X X Arkansas California* X X X X Colorado* X X X Connecticut* X X X X Delaware Florida X X X X X X Georgia X X Hawaii* X X X X X Idaho X Illinois X X X Indiana Iowa Kansas X X X X Kentucky X X Louisiana X Maine X X Maryland* X X X X X X Massachusetts X X X Michigan* X X X X X Minnesota Mississippi Missouri X X Montana Nebraska* X X X Nevada* X X X X X X New Hampshire New Jersey New Mexico* X X X X X X New York* X X X X X X North Carolina North Dakota Ohio X X X X Oklahoma X X Oregon* X X X X X Pennsylvania X X Rhode Island X X South Carolina X X South Dakota* X X X X Tennessee* X Texas X X Utah Vermont X X X Virginia Washington X X X X West Virginia* X Wisconsin* X X X X X X Wyoming TERRITORIES Puerto Rico X X Total 12 15 30 17 16 4 5 3 1 16
18 NA T I O N A LGO V E R N O R SAS S O C I A T I O N • NA T I O N A LAS S O C I A T I O N O FST A T E BU D G E T OF F I C E R S
TABLE 14
Strategies Used to Reduce or Eliminate Budget Gaps, Fiscal 2013
Higher Education Court Transportation/User Related Related Motor Vehicle Business Early Salary
Region/State Fees Fees Fees Related Fees Related Fees Layoffs Furloughs Retirement Reductions Alabama Alaska Arizona* Arkansas California* X X X X X Colorado* Connecticut Delaware Florida X Georgia Hawaii* X X X X Idaho Illinois X Indiana Iowa Kansas X Kentucky Louisiana X X Maine X Maryland* X X X Massachusetts X Michigan* Minnesota Mississippi Missouri Montana Nebraska* X Nevada* X X X X X X X X New Hampshire New Jersey New Mexico* New York* North Carolina North Dakota Ohio X Oklahoma* Oregon* X X X X X X X Pennsylvania Rhode Island* X X X X South Carolina South Dakota Tennessee* Texas Utah Vermont X X X Virginia Washington X X X West Virginia* Wisconsin Wyoming TERRITORIES Puerto Rico Total 7 6 4 6 5 11 2 1 4
NOTE: *See Notes to Table 14 on page 33.
19 TH E FI S C A L SU R V E Y O F ST A T E S • SP R I N G 2 0 1 2
TABLE 14
(Continued)Strategies Used to Reduce or Eliminate Budget Gaps, Fiscal 2013
Cuts to State Across- Rainy Gaming/
Employee the-Board Targeted Reduce Reorganize Day Lottery Gambling Other
Region/State Benefits Percent Cuts Cuts Local Aid Agencies Privatization Fund Expansion Expansion (Specify)
Alabama X X X Alaska Arizona* X Arkansas California* X X X X X Colorado* X Connecticut Delaware Florida X X X X Georgia X X Hawaii* X X X X Idaho Illinois X X Indiana Iowa Kansas X X X Kentucky X X X Louisiana X X Maine X X X X Maryland* X X X X X Massachusetts X X X Michigan* X Minnesota Mississippi Missouri X X X X X Montana Nebraska* X X X Nevada* X X X X X X New Hampshire New Jersey New Mexico* New York* X X X X X North Carolina North Dakota Ohio X X X X Oklahoma* X X Oregon* X X X X X Pennsylvania X X X Rhode Island* X X X South Carolina South Dakota Tennessee* X Texas X X Utah Vermont X X Virginia Washington X X X X West Virginia* X Wisconsin X X X X Wyoming TERRITORIES Puerto Rico x Total 9 11 26 14 9 4 5 3 0 12
20 NA T I O N A LGO V E R N O R SAS S O C I A T I O N • NA T I O N A LAS S O C I A T I O N O FST A T E BU D G E T OF F I C E R S
TABLE 15
Strategies Used to Reduce or Eliminate Budget Gaps, Fiscal 2014
Higher Education Court Transportation/User Related Related Motor Vehicle Business Early Salary
Region/State Fees Fees Fees Related Fees Related Fees Layoffs Furloughs Retirement Reductions Alabama Alaska Arizona Arkansas California* X X X Colorado Connecticut Delaware Florida Georgia Hawaii X X X Idaho Illinois Indiana Iowa Kansas Kentucky Louisiana Maine Maryland Massachusetts Michigan* Minnesota Mississippi Missouri Montana Nebraska Nevada New Hampshire New Jersey New Mexico New York North Carolina North Dakota Ohio Oklahoma Oregon Pennsylvania Rhode Island South Carolina South Dakota Tennessee* Texas Utah Vermont Virginia Washington West Virginia* Wisconsin Wyoming TERRITORIES Puerto Rico Total 2 1 1 1 0 1 0 0 0
NOTE: *See Notes to Table 15 on page 34.
21 TH E FI S C A L SU R V E Y O F ST A T E S • SP R I N G 2 0 1 2
TABLE 15
(Continued)Strategies Used to Reduce or Eliminate Budget Gaps, Fiscal 2014
Cuts to State Across- Rainy Gaming/
Employee the-Board Targeted Reduce Reorganize Day Lottery Gambling Other
Region/State Benefits Percent Cuts Cuts Local Aid Agencies Privatization Fund Expansion Expansion (Specify) Alabama Alaska Arizona Arkansas California* X X X X Colorado Connecticut Delaware Florida Georgia Hawaii X X Idaho Illinois Indiana Iowa Kansas Kentucky Louisiana Maine Maryland X X Massachusetts Michigan* X Minnesota Mississippi Missouri Montana Nebraska Nevada New Hampshire New Jersey New Mexico New York North Carolina North Dakota Ohio Oklahoma Oregon X Pennsylvania Rhode Island South Carolina South Dakota Tennessee* X Texas Utah Vermont Virginia Washington West Virginia* X Wisconsin Wyoming TERRITORIES Puerto Rico Total 1 1 4 1 1 0 0 0 0 4
22 NA T I O N A LGO V E R N O R SAS S O C I A T I O N • NA T I O N A LAS S O C I A T I O N O FST A T E BU D G E T OF F I C E R S
Chapter 1 Notes
Notes to Table 3
Fiscal 2011 State General Fund, Actual
For all states, unless otherwise noted, transfers into budget stabilization funds are counted as expenditures, and transfers from budget stabilization funds are counted as revenues.
Alabama Expenditure adjustments include an adjustment for across the board cuts of ($414.2M) and reversions and other adjustments of ($68.6M)
Alaska Revenue adjustments: $21.4 reappropriation or carry forward, $1.9 corp. dividend adjustment. Expenditure adjustments: Net of PEF draw and funding, plus any CBR or SBR transfers to savings. Rainy Day = $10,348.4 CBR, $2,632.6 SBR.
Arizona Adjustments to revenue include revenues from the temporary 1% sales tax increase, enacted agency budget transfers and county transfers.
California Represents adjustment to the Beginning Fund Balance. This consists primarily of adjustments to Major Taxes and K-12 spending. Colorado Adjustments to revenues are per Tables 1a and 1b in the OSPB March 2012 forecast, reflects line 3, net transfers to the GF. Connecticut Transfer of reserves from FY 2010 into General Fund.
Georgia Agency surplus returned.
Idaho Adjustments included transfers from the following: Budget Stabilization Fund—$30,134,600; Economic Recovery Reserve Fund —$48,846,700; Division of Human Resources Fund—$756,000, Attorney General—$532,200, and $500,000 from the Blind Commission.
Illinois Revenue Adjustments include: transfers in, inter-fund borrowing proceeds, short-term borrowing proceeds, pension obligation bond proceeds, tobacco revenue securitization proceeds. Expenditure Adjustments include: transfers out, pay-down of accounts payable, repayment of short-term borrowing.
Indiana Revenue Adjustments: Transfer from General Fund to Rainy Day Fund Expenditure Adjustments: Local Option Income Tax Dis-tributions; PTRF Adjust for Abstracts.
Iowa Ending Balance of General Fund is transferred to the Reserve Funds in the subsequent fiscal year. After the Reserve Funds hit their statutorily set maximum amounts; the remainder of the funds are transferred back to the General Fund in the subsequent fiscal year.
Kentucky Revenue includes $99.8 million in Tobacco Settlement funds. Adjustment for Revenues includes $72 million that represents ap-propriation balances carried over from the prior fiscal year, and $125.1 million from fund transfers into the General Fund. Adjust-ment to Expenditures represents appropriation balances forwarded and to the next fiscal year and budgeted balances to be expended in the next fiscal year.
Louisiana Revenues Adjustments—Includes transfers from various funds $28.7; transfer from Over collections Fund $26.9; transfer from Incentive Fund $4.0; carry-forward from FY09-10 $12.7; carry-forward of Interim Emergency Board appropriations $1.1; re-ap-propriation of capital outlay from various prior years $32.8. Actual State General Fund collections were less than official projections adopted by the Revenue Estimating Conference (REC) on May, 2011 in the amount of ($107.9).
Maryland Revenue adjustments reflect a $5.2 million reimbursement from the reserve for Sustainable Community Tax Credits, $8.0 million reimbursement from the reserve for Biotechnology Tax Credits, and transfers of $333.9 million from other special funds. Massachusetts Includes balances in all budgeted funds included in the state's definition of fiscal balance, Chapter 29 of the Massachusetts
General Laws.
Michigan Fiscal 2011 revenue adjustments include the impact of federal and state law changes ($1,428.6 million); revenue sharing pay-ments to local government units (-$426.8 million); and deposits from state restricted funds ($196.5 million).
23 TH E FI S C A L SU R V E Y O F ST A T E S • SP R I N G 2 0 1 2 Minnesota Ending balance includes cash flow account of $266 million, budget reserve account of $8.7 million and appropriations carried
forward of $37.9 million.
Missouri Revenue adjustments include transfers from other funds into the general revenue fund, including $572.4M from enhanced FMAP authorized in the American Recovery and Reinvestment Act of 2009.
Montana Adjustments to revenues and expenditures are attributable to prior year activity.
Nebraska Revenue adjustments are transfers between the General Fund and other funds. Among others, this includes a $112 million trans-fer from the General Fund to the Property Tax Credit Cash Fund as well as a $154 million transtrans-fer to the General Fund from the Cash Reserve Fund (Rainy Day Fund).
Nevada FY 11 revenue adjustments include fund sweeps and reversions. FY 11 expenditure adjustments include transfers between FY 10 and FY 11, supplemental and one-time appropriations, and reduction of appropriations approved by the 26th special session. New Hampshire Revenue Adjustments: + $2.1 million transfer from the Liquor Fund and +$124 million transfer to the Education Trust fund. New Jersey Budget versus GAAP entries, and net transfers to other funds.
New Mexico Adjustment includes one-time fiduciary tax payment of $36 million and transfer for solvency of $26 million.
New York Total expenditures are not adjusted for the impact of delaying the end-of-year school aid payment ($2.06 billion) from March 2010 to the statutory deadline of June 1, 2010, which was done to carry forward the FY 2010 budget shortfall into FY 2011. The ending balance includes $1.2 billion in rainy day reserve funds, $136 million in a community projects fund, $13 million reserved for debt reduction and $21 million reserved for litigation risks.
North Dakota Revenue adjustments are an $830.0 million transfer from the permanent oil tax trust fund and a $35.0 million transfer from the lands and minerals trust fund to the general fund. Expenditure adjustments include a $61.4 million transfer to the budget stabi-lization fund and miscellaneous adjustments and transfers.
Oklahoma FY-2011 Revenue adjustment is the difference in cash flow. The Expenditure adjustment refers to the deposit made into the Rainy Day Fund at the end of the fiscal year.
Oregon Rainy Day Fund balance includes normal RDF (primarily General Fund) plus an Education Stability Fund (primarily Lottery Funds). Balances in RDF & ESF may include donations.
Pennsylvania Revenue adjustments include a $0.25 million adjustment to the beginning balance, $93.7 million in prior year lapses, $1,756.5 million in Enhanced Federal Medical Assistance Percentage, $921.4 million in federal State Fiscal Stabilization Funds and $387.8 million in federal Education Jobs Funds. The year-end transfer to the Rainy Day Fund (25% of the ending balance) was suspended for FY 2011.
Puerto Rico Included $1.0 billion from the Local Stabilization Fund to cover operational expenses expected to be reduced through the fiscal year 2011.
Rhode Island Adjustments to revenues reflect a transfer to the Budget Stabilization Fund.
South Carolina Rainy Day Balance = 3% General Reserve ($166.3) + 2% Capital Reserve ($107.7) + Surplus Contingency Reserve ($367.1) + Agency Appropriation Balances Carried Forward Next FY ($70.6).
South Dakota Adjustments in Revenues: $9.9 million addition to revenue is from time receipts; $26.1 million decrease to revenue is a one-time refund of taxes.
Tennessee Adjustments (Revenues) $91.4 million transfer from debt service fund unexpended appropriations. $169.5 million transfer from Rainy Day Fund.-$67.5 million transfer to dedicated revenue reserves. Total $193.4 million Adjustments (Expenditures) $323.7 million transfer to capital outlay projects fund. $13.1 million transfer to state office buildings and support facilities fund. $253.3 million transfer to reserves for unexpended appropriations. Total $590.1 million, Ending Balance $371.3 million, reserve for appropriations 2010-2011. $223.0 million unappropriated budget surplus at June 30, 2011. $0.9 million undesignated balance, $595.2 million.
24 NA T I O N A LGO V E R N O R SAS S O C I A T I O N • NA T I O N A LAS S O C I A T I O N O FST A T E BU D G E T OF F I C E R S
Texas Adjustment is net of transfer to Rainy Day Fund (-$1,087.6m) and Comptroller adjustment to general fund dedicated account balances (+$256.4m).
Vermont Adjustments equals transfers in or out of the General Fund.
Washington Fund transfers between General Fund and other accounts, and balancing to the final audited ending balance.
West Virginia Fiscal Year 2011 Beginning balance includes $418.7 million in Reappropriations, Unappropriated Surplus Balance of $102.6 million, and FY 2010 13th month expenditures of $30.6 million. Revenues Adjustments are prior year redeposits. Expenditures include Regular, Surplus and Reappropriated funds and $30.6 million of 31 day prior year expenditures. Expenditure adjustment represents the amount transferred to the Rainy Day Fund. The ending balance is mostly the historically carried forward reappro-priation amounts that will remain and be reappropriated to the next fiscal year, the 13th month expenditures & unappropriated surplus balance.
Wisconsin Revenue adjustments include Transfers out of General Fund, -$14.8; Other Revenue, $632.4; Tribal Gaming, $24.7. Expenditure adjustments include Designation for Continuing Balances, $8.2; and Unreserved Designated Balance, -$78.5.
Wyoming WY budgets on a biennial basis. To arrive at annual figures certain assumptions and estimates were required.
Notes to Table 4
Fiscal 2012 State General Fund, Estimated
For all states, unless otherwise noted, transfers into budget stabilization funds are counted as expenditures, and transfers from budget stabilization funds are counted as revenues.
Alabama Revenue adjustment includes an increase for an Alabama Trust Fund transfer for a calculation error of $266.4M and other one-time revenues of $27M. Expenditure adjustments are for across the board cuts.
Alaska Revenue adjustments: $53.6 reappropriation or carry forward. Expenditure adjustments: Net of PEF draw and funding, plus any CBR or SBR transfers to savings. Rainy Day = $10,380.9 CBR, $4,402.1 SBR.
Arizona Adjustments to revenue include revenues from the temporary 1% sales tax increase and enacted agency budget transfers. Colorado This reflects the GA actions as of this writing (based on JBC supplemental package as passed/DOC as presently reflected in
bill, plus a $61.4M set-aside for the Department of Health Care Policy and Financing. See Table 1b in OSPB March 2012 forecast, FY 2011-12.
Delaware FY 2012 revenue estimate is as of December, 2011 meeting of the Delaware Economic and Financial Advisory Council. Florida Preliminary estimates associated with the General Appropriations Act and other bills passed during the 2012 Legislative Session. Georgia General Fund revenues includes $165.6 million for the Mid Year Adjustment Reserve for education.
Idaho Adjustments included transfers from the following: Non-endowed Millennium Fund—$21,959,000, Liquor Division—$8,000,000, Judicial Branch cash transfer—$276,500, and Permanent Building Fund—$10,000,000. Expenditures adjustments include sup-plementals—$23,912,300 and deficiency warrants—$4,225,700.
Illinois Revenue Adjustments include: transfers in. Expenditure Adjustments include: transfers out, increase of accounts payable. Indiana Revenue Adjustments: FY07-11 Corporate E-check Revenue; Miscellaneous Revenue; Local Option Income Tax Adjustment;
25 TH E FI S C A L SU R V E Y O F ST A T E S • SP R I N G 2 0 1 2 Iowa Revenue adjustments include $391.5 million of residual funds transferred to the General Fund after the Reserve Funds were
filled to their statutorily set maximum amounts. Also included in revenue adjustments is $2 million of funds recommended to be transferred to the General Fund to cover the indirect costs for regulation of gaming facilities by the Department of Public Safety. Expenditure adjustments include $7.5 million of adjustments to standing appropriations, $6.5 million of supplemental appropri-ations netted against anticipated reversion of appropriappropri-ations. Ending balance of the General Fund is transferred to in the current fiscal year to the Reserve Funds in the subsequent fiscal year. After the Reserve Funds are at the statutorily set maximum amounts, the remainder of the funds are transferred back to the General Fund in that subsequent fiscal year.
Kentucky Revenue includes $94.3 million in Tobacco Settlement funds. Adjustment for Revenues includes $57.5 million that represents appropriation balances carried over from the prior fiscal year, and $151.6 million from fund transfers into the General Fund. Ad-justment to Expenditures represents appropriation balances forwarded and to the next fiscal year and budgeted balances to be expended in the next fiscal year.
Louisiana Revenues Adjustments—Includes carry-forward balances $16.6; Transfer of $38.1 from various funds. Per statute, the FY10-11 deficit was presented to the Joint Legislative Committee Budget on December 16, 20FY10-11. Per R.S. 39:75, the Governor issued an Executive Order calling for an adjustment to appropriated SGF expenditures in FY 2011-2012 of ($251.2).
Maine FY 12 beginning balance differs from FY 11 ending balance due to Controller’ s year-end adjustments. FY 2012 Adjustments (Revenue) includes benefit of one-day inter-fund borrowing of $91M.
Maryland Revenue adjustments reflect a $4.0 million reimbursement from the reserve for Heritage Tax Credits, $8.0 million reimbursement from the reserve for Biotechnology Tax Credits, and transfers of $228.3 million from other special funds.
Massachusetts Includes balances in all budgeted funds included in the state's definition of fiscal balance, Chapter 29 of the Massachusetts General Laws.
Michigan Fiscal 2012 revenue adjustments include the impact of federal and state law changes ($1,044.5 million); revenue sharing pay-ments to local government units (-$340.0 million); and deposits from state restricted funds ($209.6 million). Fiscal 2012 estimated expenditures and fiscal 2013 recommended spending include one-time spending financed from one-time revenues of $527.4 million and $525.2 million, respectively.
Minnesota Ending balance includes cash flow account of $350 million and budget reserve account of $657.6 million.
Missouri Revenue adjustments include transfers from other funds into the general revenue fund, including $67.4M from enhanced FMAP authorized in the American Recovery and Reinvestment Act of 2009 and 209.9M from the enhanced FMAP authorized in the Education Jobs and Medicaid Assistance Act.
Nebraska Revenue adjustments are transfers between the General Fund and other funds. Per Nebraska law, includes a transfer of $145 million to the Cash Reserve Fund (Rainy Day Fund) of the amount the prior year's net General Fund receipts exceeded the official forecast. Among others, also includes a $110 million transfer from the General Fund to the Property Tax Credit Cash Fund as well as a $37 million transfer to the General Fund from the Cash Reserve Fund (Rainy Day Fund) for budget stabilization. Revenue adjustments also include a $25 million transfer from the General Fund for the University of Nebraska Innovation Campus to jump-start significant new investment in research infrastructure. Expenditure adjustments are reappropriations ($230.6 million) of the unexpended balance of appropriations from the prior fiscal year.
Nevada FY 12 revenue adjustments include increases in various taxes that will sunset June 2013, redirection of fees to the general fund, and a line of credit.
New Hampshire Revenue Adjustments: + $136.5 to be moved to the Education Trust Fund at year end. New Mexico Adjustment includes transfer for solvency of $11.4 million.
New York The ending balance includes $1.3 billion in rainy day reserve funds, $284 million reserved to cover costs of potential retroactive labor settlements with certain unions, $51 million in a community projects fund, $13 million reserved for debt reduction and $21 million reserved for litigation risks.
26 NA T I O N A LGO V E R N O R SAS S O C I A T I O N • NA T I O N A LAS S O C I A T I O N O FST A T E BU D G E T OF F I C E R S
North Dakota Revenue adjustments include a $295.0 million transfer from the property tax relief sustainability fund to the general fund. Ohio FY 2012 expenditures includes a $246.9 million transfer to the Budget Stabilization Fund. FY 2012 expenditures includes
esti-mated encumbrances for the end of FY 2012 with the ending balance being the unobligated balance. FY 2013 expenditures are based on FY 2013 enacted appropriations and estimated transfers out.
Oklahoma FY-2012 Revenue adjustment is the difference in cash flow. Expenditure adjustments cannot be estimated at this time. Oregon Revenue adjustment transfers prior biennium ending GF balance to Rainy Day Fund (which can be up to 1% of total budgeted
appropriation).
Pennsylvania Revenue adjustments include a $14.7 million adjustment to the beginning balance and $195 million in prior year lapses. Expen-diture adjustment reflects $160 million in current year lapses. The year-end transfer to the Rainy Day Fund (25% of the ending balance) is proposed to be suspended for FY 2012.
Puerto Rico Includes $610 million from the Local Stabilization Fund to cover operational expenses. Rhode Island Adjustments to revenues reflect a transfer to the Budget Stabilization Fund.
South Carolina Expenditure Adjustment = FY 2011 Capital Reserve transferred to agencies; Rainy Day Balance = 3.5% General Reserve ($183.5) + 2% Capital Reserve ($104.8) + Estimated Surplus Contingency Reserve ($377.8) + Estimated Carry Forward Appropriation, ($70.6).
South Dakota Adjustments in Revenues: $12.2 million addition to revenue is from one-time receipts; $20.2 million addition to revenue is a transfer from budget reserves to pay for emergency expenses. Adjustments to Expenditures: $27.8 million is obligated cash that will be carried forward to pay for FY2013 expenses. The ending balance of $10.0 million is cash that is obligated to the Budget Reserve fund the following fiscal year.
Tennessee Adjustments (Revenues) $94.0 million transfer from debt service fund unexpended appropriations. $4.8 million transfer from Mental Health Trust Fund. -$22.4 million transfer to Rainy Day Fund. Total $76.4 million Adjustments (Expenditures) $64.0 million transfer to capital outlay projects fund. $13.1 million transfer to state office buildings and support facilities fund. $5.4 million transfer to reserves for unexpended appropriations. Total $82.5 million, Ending Balance $385.1 million, reserve for appropriations 2012-2013. $0.3 million undesignated balance, $385.4 million.
Texas Adjustment is net of transfer to Rainy Day Fund (-$1,115.6m) and Comptroller adjustment to general fund dedicated account balances (+$349.5m). The Texas budget is written and balanced on a biennial (two-year) basis. Fund balances are calculated from an appropriations perspective and do not correspond to actual cash balances. Texas projects ending the FY2012-2013 bi-ennium with a general fund balance of more than $1.6 billion. In addition, FY2012 year-to-date tax collections have substantially exceeded the most recent revenue estimate.
Vermont Adjustments are transfers in or out of the General Fund. Washington Fund transfers between General Fund and other accounts.
West Virginia Fiscal Year 2012 Beginning balance includes $425.5 million in Reappropriations, Unappropriated Surplus Balance of $338.8 million, and FY 2011 13th month expenditures of $28.6 million. Revenues Adjustments are prior year redeposits of $0.2m as of 3/31/12 and $3.7m of special revenue funds expired per sb377. Expenditures include Regular, Surplus and Reappropriated funds and $28.6 million of 31 day prior year expenditures. Expenditure adjustment represents the amount transferred to the Rainy Day Fund. The ending balance is mostly the historically carried forward reappropriation amounts that will remain and be reappropriated to the next fiscal year, the 13th month expenditures & unappropriated surplus balance.
Wisconsin Revenue adjustments include Other Revenue, $648.0; Tribal Gaming, $27.2. Expenditure adjustments include Compensation Reserve, $28.8; Transfers to other funds, $27.5; Sum Sufficient Restimate, -$106.3; Legal Settlement, $233.7; Transfer to Budget Stabilization, $45.4; and Lapses, -$306.1.