Sensory and Biomechanical Characterization of Two Painful
Syndromes in the Heel
Raoul Saggini,* Rosa Grazia Bellomo,* Giannapia Affaitati,*
,†Domenico Lapenna,*
,†and Maria Adele Giamberardino*
,†*Department of Medicine and Science of Aging, “G. D’Annunzio” University of Chieti, Chieti, Italy. †Pathophysiology of Pain Laboratory, Ce. S. I., “G. D’Annunzio” Foundation, Chieti, Italy.
Abstract:
This study evaluated sensory and biomechanical assets in 2 heel pain conditions with similar symptoms, entrapment syndrome of the nerve to abductor digiti quinti and myofascial syndrome of abductor hallucis. Thirty-three patients with unilateral heel pain and 20 asymptomatic subjects underwent pressure pain threshold measurement in the painful area in site A (medial process of calcaneal tuberosity, trigger point site of abductor hallucis) and site B (1 cm posteriorly to site A, where the nerve to abductor digiti quinti becomes most superficial) and contralaterally; electroneu-rography of posterior tibial nerve; evaluation of ground-foot reaction on a dynamic platform. Eighteen patients had electric shock–type pain (entrapment syndrome, Group 1), 15 had cramp-like pain (myofascial syndrome, Group 2). Pain thresholds on the affected side versus contralaterally were significantly lower in site B in Group 1 and in site A in Group 2 (P<.001). Nerve conduction velocity was slightly reduced in Group 1 (Pⴝ .05). Ground-foot reaction was significantly altered on the affected side in all patients versus asymptomatic subjects; a significant difference between the 2 sides was found for peak of force (F1) in Group 1 and for all parameters except temporal phase of peak of force (TF3) (Pⴝ.05) for Group 2 (P<.0001). The different sensory and biomechanical patterns of the 2 examined syndromes help the differential diagnosis and consequent therapeutic approach.Perspective:
This study shows different sensory and biomechanical patterns in 2 algogenic condi-tions of the heel with similar pain location. These distinct patterns reflect different pathophysiologic mechanisms in the 2 cases, which has a potential significant impact on treatment.© 2007 by the American Pain Society
Key words:Heel pain, pressure pain thresholds, ground-foot reaction, electroneurography.
P
ain in the heel is a very frequent occurrence in the course of life. Although variable in intensity and frequency, depending on its origin, it is of notable clinical relevance because it can profoundly impair the dynamic motor activity of the individual, causing signif-icant discomfort and disability.1,3,6,7,16,24The clinical examination of a painful heel can reveal various painful sites, each of which can be attributed to a different pathologic state.13The most frequent
patho-logic entities giving rise to heel pain are the following: (1) insertional plantar fasciitis (the so-called heel pain syndrome); (2) acute plantar fascial tear; (3) calcaneal
stress fracture; (4) fat pad atrophy; (5) diffuse plantar fasciitis; (6) entrapment of Baxter’s nerve (nerve to the abductor digiti quinti of foot [ADQ]); (7) inflammatory heel pain (gout, rheumatoid arthritis, ankylosing spon-dylitis; systemic lupus erythematosus; Reiter’s disease); (8) myofascial syndrome of the abductor hallucis muscle (AH) (modified classification from Garrett et al11).
In most circumstances, along the medial aspect of the calcaneal border, 2 painful sites can be identified that are anatomically very close to each other and very diffi-cult to discriminate as far as their origin is concerned. These 2 painful sites produce a rather disabling pain state and can be related to either a myofascial pain syn-drome of the AH or to a compressive synsyn-drome of the nerve to the ADQ.17,18,28,34The differentiation of these 2
conditions is essential for therapeutic purposes.
To understand the clinical problem related to these conditions, a few notes on the anatomy and function of the structures involved in the painful symptoms are
nec-Received April 7, 2006; Revised July 18, 2006; Accepted July 27, 2006. Supported by “G. D’Annunzio” University funds.
Address reprint requests to Maria Adele Giamberardino, MD, via Carlo de Tocco n. 3, 66100 Chieti, Italy. E-mail: mag@unich.it
1526-5900/$32.00
© 2007 by the American Pain Society doi:10.1016/j.jpain.2006.07.002
Available online at www.sciencedirect.com
essary. The AH runs subcutaneously along the posterior half of the medial border of the foot, covering the en-trance of the plantar nerves into the sole. It anchors prox-imally to the medial process of the calcaneal tuberosity and usually attaches distally to the medial aspect of the base of the proximal phalanx of the big toe. Sometimes an accessory AH can be present, extending from the fas-cia superfifas-cial to the posterior tibial nerve, above the medial malleolus, to the middle portion of the main AH. The muscle is provided with a superficial and a deep fascia. The nerve to the ADQ represents either a branch of the posterior tibial nerve or the first branch of the lateral plantar nerve that runs medially underneath the AH fascia between the quadratus plantae and the flexor brevis to reach the ADQ and intrinsic muscles of the little toe. This nerve can become entrapped at the edge of the deep AH fascia where it turns the corner of the medial calcaneal border. The AH is innervated via branches of the medial plantar nerves. The AH normally acts as a flexor and often abductor of the proximal phalanx of the big toe.28
In spite of the clinical relevance of the painful symp-toms related to the described structures, the clinical char-acteristics of the 2 syndromes (myofascial pain syndrome of the AH and entrapment syndrome of the nerve to the ADQ) have not yet been precisely defined. The aim of the present study was therefore to characterize these 2 con-ditions in terms of spontaneous painful symptomatol-ogy, sensory changes in the painful area, and possible changes in electroneurographic parameters and dy-namic motor parameters, such as the ground-foot reac-tion of the subject on a podobarographic platform. Part of the results have already been published in abstract form.26
Materials and Methods
Patients and Subjects
Patients and asymptomatic subjects of both sexes were considered for the study. Inclusion criteria for patients were an age range of 20 to 65 years; no professional sports activity; presence of strictly unilateral heel pain with onsetⱖ30 days before examination, and duration ⱕ120 days (pain conditions of longer duration were ex-cluded to avoid complicated clinical pictures that fre-quently occur in these cases). Further criteria were ab-sence of any pathologic systemic condition (eg, rheumatoid arthritis) or pathologic regional condition in the lower limbs (myofascial, neuropathic, orthopedic) that might manifest with pain symptoms in the heel area; at physical examination of the lower limbs, absence of latent trigger points in muscles whose target area includes the heel zone (soleus, peroneus longus, and bre-vis)34; absence of diabetes; informed written consent to
participate in the study.
Inclusion criteria for asymptomatic subjects were simi-lar to those for patients except that they had to be free from any past or current painful symptoms in the feet.
Patients were recruited at the Rehabilitation Center of the “G. D’Annunzio” University of Chieti. Asymptomatic
subjects were recruited among students of the medical faculty and the medical staff of the Department of Med-icine and Science of Aging at the same University.
Thirty-three patients (19 women and 14 men; age, 21 to 65 years; mean age, 37.9⫾1.9 standard error of the mean [SEM]) meeting the inclusion criteria were selected out of 40 cases examined. They had been having unilat-eral heel pain at the level of the medial calcaneal border for a period of 56.48⫾19 days (mean⫾standard devi-ation) before entering the study.
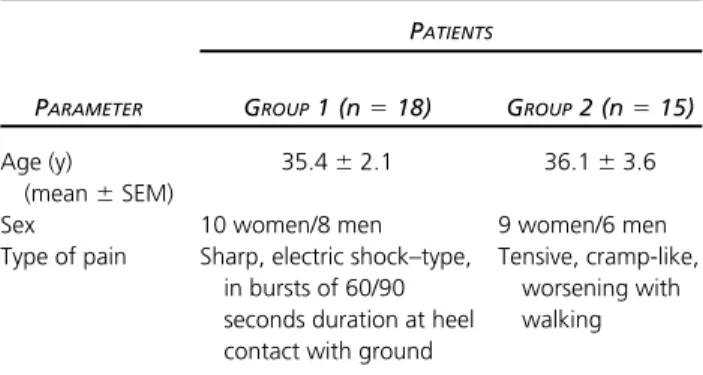
On the basis of the characteristics of their pain, they were subdivided into 2 groups: Group 1 (n⫽18), whose pain was sharp, electric shock–type, appearing in bursts of 60/90 seconds duration each, triggered by the stand-ing position, and Group 2 (n⫽15), with tensive, cramp-like pain exacerbated by walking (Table 1). In both cases the pain was perceived along the medial calcaneal bor-der (Fig 1).
Twenty asymptomatic subjects (13 women and 7 men; age, 20 to 63 years; mean age, 44.4⫾3.4 SEM) (Group 3) meeting the inclusion criteria were selected out of 42 cases examined.
The protocol adhered to the guidelines established by the Declaration of Helsinki and the local Ethic Commit-tee for Human Studies. Written informed consent was obtained from each subject.
Research Design
The research was carried out during a period of 12 months.
On admission to the study, all patients were submitted to physical examination of both feet including clinical procedures for detection of hypersensitivity in the pain-ful area (dermatographism, Head’s technique, pinch pal-pation, digital pressure); measurement of pressure pain thresholds (PPTs) at 2 points in the painful area, bilater-ally8; electroneurographic examination of the posterior
tibial nerve on the affected side; and evaluation of the ground-foot reaction on both the affected and nonaf-fected sides on a podobarometric platform (for the anal-ysis of the peaks of force, F1, F2, F3, and the temporal phases of these peaks, ie, the latency to onset of the peak forces, TF1, TF2, and TF3).5
Asymptomatic subjects were submitted to the same evaluation tests. Electroneurography was performed unilaterally in 10 of them.
Table 1.
Patient Group Classification
PATIENTS
PARAMETER GROUP1 (n⫽18) GROUP2 (n⫽15)
Age (y)
(mean⫾SEM)
35.4⫾2.1 36.1⫾3.6 Sex 10 women/8 men 9 women/6 men Type of pain Sharp, electric shock–type,
in bursts of 60/90 seconds duration at heel contact with ground
Tensive, cramp-like, worsening with walking
The instrumental evaluations (PPTs, electroneurogra-phy, ground-foot) were performed by specialists differ-ent from the one who recruited the patidiffer-ents/subjects and performed the physical examination. These specialists were blinded as to whether the examined subjects were patients or asymptomatic subjects. Each type of instru-mental evaluation was performed by one specialist only for all the examined subjects.
Clinical Maneuvers for Detection of
Hypersensitivity
The presence or absence of hypersensitivity (allodynia/ hyperalgesia)23in the painful area in patients (and in the
corresponding area in asymptomatic subjects) was veri-fied by clinical procedures in the 3 parietal layers. (1) For the skin, dermatographic procedure, with the blunt point of a calibrated dermograph, vertical parallel lines, 1 cm apart, were scratched at a constant pressure (500 g) on the skin overlying the painful area, perpendicular to the medial calcaneal border, starting from approxi-mately 1 cm posterior to site B and finishing 1 cm ante-rior to site A. In this way, 4 lines were drawn, 2 of which were exactly over the A and B sites. In normal skin areas a vasodilatation reaction appeared (red lines), but in al-lodynic areas this reaction did not persist because the ischemic phase of dermatographism took prevalence (white lines)33; Head’s technique modified by Galletti et
al.10 Concentric lines were scratched over the skin
to-ward the area of altered dermatographic reactivity with the needle tip of a calibrated device, allowing constant pressure and angle of inclination (40 g and 25°, respec-tively). The patients exhibited a painful reaction when the border of the allodynic area was reached.15,33,35
(2) For the subcutis-pincer palpation, folds of tissue in the painful area were grasped between thumb and in-dex finger and squeezed; hyperalgesia was revealed if the patients complained of discomfort.36(3) For the
mus-cle, digital pressure was exerted firmly all over the pain-ful area. A painpain-ful reaction by the patients revealed the presence of deep hyperalgesia.36
Measurement of PPTs
PPTs were measured in the following 2 sites: A, level of the medial process of the calcaneal tuberosity; and B, 1 cm posteriorly to site A (Fig 1). These were chosen be-cause B is the site where the nerve to ADQ becomes most superficial, and A is the typical trigger point site of the AH.34
Fischer’s algometer was used for measurements.8
Pres-sure was gradually increased by .1 kgf/sec until the first report of discomfort by the patient. The value corre-sponding to this report was regarded as the PPT for the tested point.
Measurements were always performed by the same operator at the same hour of day (between 10:00AMand
12:00 PM) and for fertile women in the same relative
phase of the menstrual cycle (follicular phase).12
Electroneurographic Evaluation
The electroneurographic evaluation was performed by stimulating the posterior tibial nerve with bipolar meth-odology and cathode placed distally in the retromalleo-lar furrow at the level of the most prominent aspect of the medial malleolus. The responses were simulta-neously derived via Adrian-Bronck needle electrodes in
Figure 1.Schematic representation of the location of sites A and B and of the spontaneous pain distribution in patients (dotted area). (A) Level of the medial process of the calcaneal tuberosity; (B) 1 cm posteriorly to A.
the abductor brevis hallucis for the medial plantar nerve and in the ADQ for the lateral plantar nerve.
The needles were positioned in the 2 muscles at medio-tarsal level; the widest possible signal was searched for by moving the needles lightly to vary the position of their tips in depth.
The evaluated parameter was the latency to motor sponse of the AH and ADQ. An increased latency is re-garded as indicative of the degree of impairment of the motor efferent fibers of the posterior tibial nerve but also of a concomitant involvement of the sensory ent fibers because these course along with motor effer-ent fibers in the posterior tibial nerve.9,31
Description and Evaluation of the
Ground-Foot Reaction
The ground-foot reaction is generated during the stance phase of gait. The stance phase is composed of 5 phases: (1) initial contact (this phase includes the mo-ment when the foot touches the floor); (2) loading re-sponse (this phase begins with initial floor contact and continues until the other foot is lifted for swing); (3) mid stance (this is the first half of the single limb support interval and begins as the other foot is lifted and contin-ues until body weight is aligned over the forefoot); (4) terminal stance (this phase completes single limb sup-port and begins with heel rise and continues until the other foot strikes the ground, and throughout this phase, body weight moves ahead of the forefoot); and (5) pre swing (this final phase of stance begins with initial contact of the opposite limb and ends with ipsilateral toe-off).25
During the ground-foot reaction, F1 is the maximal vertical force expressed during the loading response of the stance-phase; F2 is the maximal vertical force during the single limb support at the mid-stance phase; F3 is the maximal vertical force during the limb advancement at the pre-swing phase; TF1, TF2, and TF3 are defined as the latency to onset of F1, F2, and F3, respectively.25
In the present study, the ground-foot reaction was evaluated by using a podobarographic system consisting of a force platform 6 m long (2.5 m of which were sensi-tive to pressure) (Dynamic Foot System, Florence, Italy).21
The subjects were made to walk freely on the platform, barefoot, without any limitation in the cadence and length of steps. In each subject for both affected and nonaffected legs, maximal values were measured of the F1, F2, and F3 components of the vertical force together with the temporal phases of these components (TF1, TF2, and TF3). The evaluated parameters were recorded via dedicated software and directly displayed on a computer system connected to the podobarographic system. Dur-ing the test, the frequency of samplDur-ing of the system was 100 Hz. Each subject performed 6 trials, and the mean of the 6 tests was calculated for each evaluated parameter.
Statistical Analysis
Means⫾SEM were calculated for all parameters mea-sured for both patients and normal subjects.
For PPTs evaluated in each site (A or B) on both the affected and nonaffected sides, the comparison be-tween the 2 groups of patients and the asymptomatic subjects was performed via 1-way analysis of variance (ANOVA) with post hocttests. The comparison between corresponding sites of the 2 sides of the body for each group of individuals (Group 1, patients with sharp, elec-tric-type pain; Group 2, patients with cramp-like pain; Group 3, asymptomatic subjects) was performed via Wil-coxon sum rank test.
For the latency to onset of the motor response (elec-troneurographic examination), the comparison between the 2 groups of patients and asymptomatic subjects was performed by means of 1-way ANOVA with post hoct
tests.
For peak forces and latency to onset of peak forces on both the affected and nonaffected sides, the comparison between the 2 groups of patients and the asymptomatic subjects was performed via 1-way ANOVA with post hoc
ttests. The comparison between the 2 sides of the body for each group of individuals was performed via Wil-coxon sum rank test.
The level of significance was assessed atP⬍.05.
Results
Clinical Maneuvers for Detection of
Hypersensitivity
In Group 1 patients on the affected side, in A site no superficial allodynia or deep hyperalgesia was detected. In B site there were signs of cutaneous allodynia and subcutaneous and muscle hyperalgesia, ie, positivity for dermatographism and Head’s maneuver (early interrup-tion occurred only of the red line overlying site B; inter-ruption segment was 1-cm long vertically, the transversal extension of the area was further defined via Head’s technique, identifying an approximately 1⫻1 cm skin area of allodynia); tenderness on pinching of the subcu-taneous tissue and exquisite tenderness on digital com-pression.
In Group 2 patients on the affected side, in A site there was cutaneous allodynia (similar dimensions and charac-teristics as for site B in Group1) and subcutaneous and muscle hyperalgesia. Furthermore, this point exhibited the typical characteristics of a myofascial trigger point, ie, it was included in a taut palpable band of muscle fibers and, under firm digital compression, evoked not only local pain but also pain radiating posteriorly toward the heel (along the medial calcaneal border)32; in B site
there was sensory normality at skin level but hyperalge-sia of the subcutaneous tissue and of the muscle.
On the nonaffected side in all patients and on both sides in asymptomatic subjects, all clinical procedures for detection of hypersensitivity at heel level were negative.
PPTs
Fig 2shows threshold values at all sites in both patients and normal subjects.
In Group 1 patients, pain thresholds to pressure
lation in site A (level of the medial process of the calca-neal tuberosity, site of the typical trigger point of the AH) were similar on both sides (P⫽ .64), but in site B (where the nerve to ADQ becomes most superficial) they were significantly lower on the affected side than con-tralaterally (P⬍.0002). Thresholds at all sites were sig-nificantly lower than normal.
In Group 2 patients, thresholds were significantly lower on the affected side than contralaterally in site A (P⬍.0002) but similar on both sides in site B (P⫽.26). Here again, thresholds at all sites were significantly lower than normal.
On the affected side, thresholds in site A (trigger point site) were significantly lower in Group 2 than in Group 1, whereas in site B (nerve site) they were significantly lower in Group 1 than in Group 2. On the nonaffected side, thresholds did not differ in the 2 groups in both sites A (P⫽.14) and B (P⫽.71).
Electroneurographic Evaluation
In Group 1 patients, electroneurography of the poste-rior tibial nerve showed a slight increase in the latency to motor response of the ADQ, but the difference with re-spect to normal was not significant (P⫽.05). In Group 2 patients, no significant changes in this parameter were detected (P⬎.99) (Fig 3).
Ground-Foot Reaction
The ground-foot reaction of the affected side in pa-tients compared with normal subjects showed a signifi-cant reduction of F1 in Group 1 and a signifisignifi-cant reduc-tion of F1, F3, and TF1 in Group 2.
The comparison between the parameters of the af-fected side of the 2 groups of patients showed a signifi-cant difference for F3 and TF1 (Figs 4and5).
On the nonaffected side, the comparison between the
evaluated parameters of both groups of patients and asymptomatic subjects showed no significant difference (1-way ANOVA:P⫽.73 for F1,P⫽.82 for F2,P⫽.61 for F3,P⫽.65 for TF1,P⫽.85 for TF3).
In Group 1, the comparison between the affected and nonaffected sides showed a highly significant difference for F1 (P ⬍ .0001) (comparison between affected and nonaffected sides for F2,P⫽.55; for F3,P⫽.56; for TF1,
P⫽.83; for TF2,P⫽.25; for TF3,P⫽.60).
In Group 2, the comparison between the affected and nonaffected sides showed a highly significant difference for all parameters (P⬍.0001) except TF3 (P⫽.05).
In normal subjects, the comparison between the 2 sides of the body did not show any significant differ-ence (P⬎.90). 0.0 2.5 5.0 7.5 10.0 | | | | | | | | | | | | | | | | | | | | | | | | | | | | | | | | | | | | A ipsi A contra B ipsi B contra
Group 1 Group 2 Group 3 kg-f
*
***
** **
** ***
**
***
***
***
Figure 2.Pain thresholds to pressure stimulation measured at the level of the medial process of the calcaneal tuberosity (A) and 1 cm posteriorly to A (B) in Group 1 (n⫽18, patients with heel pain from entrapment of the nerve to the ADQ), Group 2 (n
⫽15, patients with heel pain from myofascial syndrome of the AH), and in Group 3 (n⫽20, asymptomatic subjects) (means⫾ SEM). A ipsi, A on the affected side; A contra, A on the nonaf-fected side; B ipsi, B on the afnonaf-fected side; B contra, B on the nonaffected side. 1-way ANOVA for thresholds of patients and normal subjects on each evaluated site:P⬍.0006 andP⬍.0001. Asterisks over SEM bars for comparison between patients and asymptomatic subjects. *P⬍.05; **P⬍.01; ***P⬍.001. 2.5 5.0 7.5 | | | | | | | | | | | | Group 1 Group 2 Group 3 msec ADQ AH
Figure 3.Latency to motor response of the ADQ (for lateral plantar nerve) and of the AH (for medial plantar nerve) at elec-troneurographic evaluation in patients with heel pain (Group 1, entrapment of the nerve to ADQ [n⫽18]; Group 2, myofascial syndrome of the AH [n⫽15]) and in asymptomatic subjects (Group 3, n⫽10) (means⫾SEM). Evaluation performed on the affected side in patients and unilaterally in asymptomatic sub-jects. 0 50 100 150 Group 1 Group 2 Group 3 | | | | | | | | | | | | | | | | | | | | | | | | % F1 F2 F3
*** ***
***
***
Figure 4. Vertical forces (F1, F2, and F3) evaluated at the ground-foot reaction, expressed as a percentage of the body weight in Group 1 (n⫽18 patients with heel pain from entrap-ment of the nerve to the ADQ), Group 2 (n⫽15 patients with heel pain from myofascial syndrome of the AH), and Group 3 (n
⫽20 asymptomatic subjects) (means⫾SEM). 1-way ANOVA for F1 and F3 of patients and asymptomatic subjects:P⬍.0001, ***P⬍.001. Asterisks over SEM bars refer to comparison be-tween patients and asymptomatic subjects. 1-way ANOVA for F2 of patients and asymptomatic subjects,P⫽.06. Data related to the affected side in patients and unilaterally in asymptomatic subjects.
Discussion
The results of the present study show that entrapment syndrome of the nerve to ADQ (patients in Group 1) and myofascial syndrome of the AH (patients in Group 2) display different patterns at both sensory and biome-chanical evaluations, in spite of a similar location of spontaneous pain. In particular, on the affected foot the site of maximal tenderness is different in the 2 cases, with exquisite hyperalgesia being at the level of the medial aspect of the calcaneal border in patients with entrap-ment syndrome of the nerve to ADQ (site B) and at the level of the medial process of the calcaneal tuberosity in patients with myofascial pain (site A). This suggests a nerve origin of the pain in the former case, probably as a result of intraneural inflammation induced by mechani-cal compression, which includes the mechanimechani-cal sensitiv-ity of the nociceptor axon and the intrinsic innervation of the nerve, and a muscle origin of the pain in the latter case, with sensitization of muscle nociceptors locally.19,22
Along with the different location of the maximal hy-persensitivity, there is a specific difference in the pattern of the vertical forces developed during the gait on the affected side, ie, in entrapment syndrome there is only a reduction of the maximal force at the contact phase (F1), whereas in myofascial pain syndrome there is a global alteration of all parameters of the dynamics of move-ment. The reason for this different pattern lies probably in the specific function of the AH during gait.25This
mus-cle, in fact, is activated from the middle of the stance phase to the toe-off phase. Because the patients have pain in the muscle, the force developed during these phases is obviously reduced. The earlier development of the maximal force at the contact phase of the rear foot (TF1) is probably related to an increased motor control caused by the painful symptomatology.
The biomechanical data obtained in the present study in patients with entrapment syndrome are in part in agreement with those reported by Liddle et al.20They
found no significant differences in the vertical ground reaction forces between the symptomatic and contralat-eral asymptomatic foot in patients with plantar heel pain, and we found a slight difference between the 2 sides, ie, only concerning the F1 component. The data by
Liddle et al are instead completely different from those found here in patients with myofascial pain syndrome of the AH because these patients present a marked differ-ence in all parameters of the dynamics of movement between the 2 sides. This different outcome in the 2 studies might, however, be linked to the different pain pattern of the considered patients in the 2 cases. In fact, we evaluated patients with pain strictly perceived at cal-caneal level, along the medial border of the heel, whereas Liddle et al studied patients with plantar heel pain. Their patients’ pain appears to be mainly fascial, whereas our patients’ pain is muscular. It seems logical that an impairment of muscle function as a result of the algogenic symptoms has many more repercussions on the dynamics of movement than a fascial pain.27
Whatever the exact mechanisms at the basis of the recorded alterations in the 2 syndromes, which remain to be explored further, we believe that a sensory-biome-chanical evaluation in the patients can help perform the differential diagnosis, in turn indispensable for an effec-tive therapy, which is different in the 2 cases.2
The preferred intervention for myofascial pain syn-drome is extinction of the trigger point through a num-ber of well-established local procedures (eg, spray and stretch or trigger injection), possibly followed by correc-tion of biomechanical alteracorrec-tions through dynamic in-soles.14,27,32,34 Treatment options for entrapment
syn-drome are less precisely codified in the literature; generally, the first approach is conservative and involves infiltration of the painful area with anesthetics and/or corticosteroids,29,30 followed by use of foot orthosis.
When the conservative approach is not sufficient, which happens quite often, surgery is most often required.4
It is clear that a complete sensory-biomechanical eval-uation performed instrumentally, as in the present study, is the best option to obtain maximal information about the characteristics of the 2 painful syndromes. However, even in the absence of appropriate equipment to perform all the tests, the practicing clinician can ob-tain important information by focusing specifically on the characteristics of the spontaneous symptomatology and on the sensitivity of the 2 mentioned points in the heel evaluated with clinical procedures. In the presence of an electric shock–type pain, appearing in bursts mostly at the beginning of the contact of the heel with the ground after a period of rest, an entrapment syndrome should first be suspected, whereas a rather cramp-like, tensive pain that is minimal at the first contact of the heel with the ground after a period of rest, but which increases while walking, is likely to indicate a myofascial pain syndrome. Because the instrumental sensory evalu-ation showed that the site of lowest pain threshold is B for entrapment syndrome and A for myofascial pain syn-drome on the affected side, the clinician should search for these 2 sites in the heel and apply there the manual procedures for detection of pain hypersensitivity in the 3 body wall layers (skin, subcutis, and muscle). On the basis of the outcome of these maneuvers, 3 possible patterns can emerge: (1) hypersensitivity is present in the 3 tissues in B but not in A; this is an isolated entrapment
syn-0 25 50 75 100 Group 1 Group 2 Group 3 | | | | | | | | | | | | | | | | | | | | | | | | % TF1 TF2 TF3
***
***
Figure 5.Latency to onset of vertical forces (TF1, TF2, and TF3). See legend for Figure 4 for additional description. 1-way ANOVA for TF1 of patients and asymptomatic subjects,P⬍.001.
drome; (2) hypersensitivity involves the 3 tissues in A but only the deep layers (subcutis/muscle) in B; in addition, site A has the characteristics of a myofascial trigger point; this is an isolated myofascial pain syndrome (typi-cally characterized by skin/subcutis and muscle hypersen-sitivity to pain in the trigger and only deep hypersensi-tivity in the target area)36; (3) hypersensitivity is present
in the 3 tissues in both A and B; furthermore, site A has the clinical features of a myofascial trigger point. The 2 syndromes are likely to coexist, although the spontane-ous pain of entrapment syndrome might prevail clini-cally. This coexistence is, however, a rare occurrence.
Depending on the diagnostic orientation derived from this clinical approach, the specific treatments already de-scribed above for the syndromes can be undertaken im-mediately, although some instrumental evaluation will be necessary at a certain point to further proceed with
the therapy, if necessary, eg, evaluation of the ground-foot reaction before application of insoles.
In conclusion, to the best of our knowledge the present study provides for the first time full sensory and biome-chanical characterization of 2 painful syndromes of the heel with similar pain location. The different patterns here documented both clinically and instrumentally can represent an important point of reference to be kept in mind in the diagnostic and therapeutic process of these syndromes, which are often so problematic to approach in routine medical practice
Acknowledgments
The authors are grateful to CIRS (Center for Informatics and Statistics of the “G. D’Annunzio” University of Chi-eti) for their help with the statistical analysis of the re-sults.
References
1. Aldridge T: Diagnosing heel pain in adults. Am Fam Phy-sician 70:332-338, 2004
2. Atkins D, Crawford F, Edwards J, Lambert M: A systematic review of treatments for the painful heel. Rheumatology 38:968-973, 1999
3. Barrett SJ, O’Malley R: Plantar fasciitis and other causes of heel pain. Am Fam Physician 15:2200-2206, 1999
4. Baxter DE, Pfeffer GB: Treatment of chronic heel pain by surgical release of the first branch of the lateral plantar nerve. Clin Orthop 279:229-236, 1992
5. Chao EY, Laughman RK, Schneider E, Stauffer RN: Norma-tive data of knee joint motion and ground reaction forces in adult level walking. J Biomech 16:219-233, 1983
6. DiMarcangelo MT, Yu TC: Diagnostic imaging of heel pain and plantar fasciitis. Clin Podiatr Med Surg 14:281-301, 1997
7. Dreben S: Heel Pain: Orthopaedic Knowledge Update— Foot and Ankle. Rosemont, IL, AAOS, 1994
8. Fischer AF: Muscle pain syndrome and fibromyalgia: Pres-sure algometry for quantification of diagnosis and treat-ment outcome. J Musculoske Pain 6:1058-2452, 1998 9. Fu M, De Lisa JA, Kraft GH: Motor nerve latencies through the tarsal tunnel in normal adult subjects: Standard deter-minations corrected for temperature and distance. Arch Phys Med Rehabil 61:243-247, 1980
10. Galletti R, Obletter G, Giamberardino MA, Formica LM, Cicchitti G, Vecchiet L: Pain from osteoarthritis of the knee. Adv Pain Res Ther 13:183-191, 1990
11. Garrett WE, Speer KP, Kirkendall DT: Principles and Prac-tice of Orthopaedic Sports Medicine. Philadelphia, Lippin-cott Williams and Wilkins, 2000
12. Giamberardino MA, Berkley KJ, Iezzi S, de Bigontina P, Vecchiet L: Pain threshold variations in somatic wall tissues as a function of menstrual cycle, segmental site and tissue depth in non-dysmenorrheic women, dysmenorrheic women and men. Pain 71:187-197, 1997
13. Goolsby MJ: Diagnosis and treatment of heel pain. J Am Acad Nurse Pract 15:485-486, 2003
14. Graboski CL, Gray DS, Burnham RS: Botulinum toxin A versus bupivacaine trigger point injections for the treat-ment of myofascial pain syndrome: A randomised double blind crossover study. Pain 118:170-175, 2005
15. Head H: Studies in Neurology. London, Fronde, 1920 16. Hendrix CL, Jolly GP, Garbalosa JC, Blume P, DosReme-dios E: Entrapment neuropathy: The etiology of intractable chronic heel pain. J Foot Ankle Surg 37:273-279, 1998 17. Johnston MR: Nerve entrapment causing heel pain. Clin Podiatr Med Surg 11:617-624, 1994
18. Jolly GP, Zgonis T, Hendrix CL: Neurogenic heel pain. Clin Podiatr Med Surg North Am 22:101-113, 2005
19. Kobayashi S, Baba H, Uchida K, Shimada S, Negoro K, Takeno K, Yayama T, Yamada S, Yoshizawa H: Localization and changes of intraneural inflammatory cytokines and in-ducible-nitric oxide induced by mechanical compression. J Orthop Res 23: 771-778, 2005
20. Liddle D, Rome K, Howe T: Vertical ground reaction forces in patients with unilateral heel pain - a pilot study. Gait Posture 11:62-66, 2000
21. Macellari V, Giacomozzi C, Saggini R: Spatial-temporal parameters of gait: Reference data and a statistical method for normality assessment. Gait Posture 10:171-181, 1999 22. Mense S: The pathogenesis of muscle pain. Curr Pain Headache Rep 7:419-425, 2003
23. Merskey H, Loeser JD, Dubner R: The Paths of Pain 1975-2005. Seattle, WA, IASP Press, 2005
24. Narvaez JA, Narvaez J, Ortega R, Aguilera C, Sanchez A, Andia E. Painful heel: MR imaging findings. Radiographics 20:333-352, 2000
25. Perry J: Gait Analysis: Normal and Pathological Function. New York, NY, SLACK Incorporated, 1992
26. Saggini R, Bellomo R, Cancelli F, De Antoni A, Parabita M, Giamberardino MA: Sensory and biomechanical charac-terization of two painful syndromes in the heel. J Musculo-ske Pain 9:48, 2001
27. Saggini MA, Giamberardino MA, Gatteschi L, Vecchiet L: Myofascial pain syndrome of the peroneus longus: Biome-chanical approach. Clin J Pain 12:30-37, 1996
28. Sarrafian SK: Anatomy of the Foot and Ankle. Philadel-phia, Lippincott, 1983
29. Schon LC: Plantar fasciitis/heel pain, in Schon LC (ed): Current Practice in Foot and Ankle Surgery. New York, NY, Mc Graw-Hill, 1993, pp 254-257
30. Schon LC: Nerve entrapment, neuropathy, and nerve dysfunction in athletes. Orthop Clin North Am 25:47-59, 1994
31. Schon LC, Glennon TP, Baxter DE: Heel pain syndrome: Electrodiagnostic support for nerve entrapment. Foot Ankle 14:129-135, 1993
32. Simons DG, Travell JG, Simons LS: Travell & Simons’ Myo-fascial Pain and Dysfunction: The Trigger Point Manual. vol
1. Upper Half of Body. Baltimore, MD, Williams & Wilkins, 1999
33. Teodori U, Galletti R: Il dolore in sede profonda ed in sede parietale, in Teodori U, Galletti R (eds): Il Dolore nelle Affezioni degli Organi Interni del Torace. Rome, Italy, Ediz-ioni Pozzi, 1962, pp 59-73
34. Travell JG, Simons DG: Myofascial Pain and Dysfunction: The Trigger Point Manual. Baltimore, MD, Williams & Wilkins, 1983
35. Vecchiet L, Giamberardino MA, Dragani L, Albe-Fessard D: Pain from renal/ureteral calculosis: Evaluation of sensory thresholds in the lumbar area. Pain 36:289-295, 1989 36. Vecchiet L, Pizzigallo E, Iezzi S, Affaitati G, Vecchiet J, Giamberardino MA: Differentiation of sensitivity in differ-ent tissues and its clinical significance. J Musculoske Pain 6:33-45, 1998