1876-6102 © 2016 The Authors. Published by Elsevier Ltd. This is an open access article under the CC BY-NC-ND license (http://creativecommons.org/licenses/by-nc-nd/4.0/).
Peer-review under responsibility of the organizing committee of CUE 2015 doi: 10.1016/j.egypro.2016.06.027
Energy Procedia 88 ( 2016 ) 76 – 81
ScienceDirect
CUE2015-Applied Energy Symposium and Summit 2015: Low carbon cities and urban
energy systems
ENVIRONMENTAL AND CLIMATE CHANGE
CO-BENEFITS ANALYSIS OF WIND POWER GENERATION
IN CHINA
Jin Yang*
School of Humanities and Economic Management, China University of Geosciences, Beijing 100083, China
Abstract
In China, the fossil energy consumption in electricity generation leads to a large quantity of greenhouse gas (GHG) and air pollutant emissions. Along with the rapid development of renewable power generation technologies, especially wind power, substantial environmental emissions were avoided due to the substitution of fossil fuel combustion. The co-benefits approach, which uses resources efficiently to solve multiple environmental problems, provides a new angle for the power generation and deployment. In this paper, the environmental co-benefits of wind power penetration in China were calculated. The regional distribution of environmental co-benefits was also mapped. Based on the co-benefits analysis results, the wind power deployment pathways are designed to enlarge the environmental co-benefits in the whole country level.
© 2015 The Authors. Published by Elsevier Ltd.
Selection and/or peer-review under responsibility of CUE
Keywords: Wind power; Environmental co-benefits; Regional distribution
Nomenclature
2 j,i,CO
Q CO2 emissions from fuel i of region j
,
E
j i Fuel i consumption of region j2 , ,CO j i
COEF CO2 emission coefficient of fuel i in region j
* Corresponding author. Tel.: +86-10-82322078
E-mail address:yangjin@cugb.edu.cn
© 2016 The Authors. Published by Elsevier Ltd. This is an open access article under the CC BY-NC-ND license (http://creativecommons.org/licenses/by-nc-nd/4.0/).
j,i,e
Q SO2 and NOx emissions from fuel i of region j
, ,e j i
COEF SO2 and NOx emission coefficients of fuel i in region j
, e n
J
The average removal efficiency of air pollutant e by pollutant removal equipment n, , e n j
s
The share of production capacity installed with pollutant e removal equipment n in the total production capacity in province j, , e n j
D
The operation rate of pollutant e removal equipment n in province j.j,i,w
Q
Water consumption of power generation using fuel i of region j, j el
T
Water consumption coefficient of power generation using fuel i of region jEl
Electricity generation2
g,i,CO
Q
Total CO2 emissions from power generation using fuel i in grid gg,i,e
Q
Total environmental emissions from power generation using fuel i in grid gg,i,w
Q
Total water consumption from power generation using fuel i in grid gR
Environmental co-benefits1.Introduction
To fill in the gap between shrinking supply and expanding demand of energy, the Chinese government has been dedicated on exploiting renewable energy to supplement existing energy services. Among these renewable alternatives, wind power is growing in an incredible speed and has ranked the third power source in China with total installed capacity of 91GW in 2013 [1]. Increasing wind power deployment to stabilize energy supply is likely to have a wide variety of environmental benefits besides reducing conventional energy consumption, e.g., providing health, environmental, and climate benefits by displacing conventional generators and therefore reducing emissions of carbon dioxide (CO2) and criteria air pollutants, which include sulfur dioxide (SO2), nitrogen oxides (NOx), and fine particulate matter (PM2.5). The quantification of regional environmental co-benefits of wind power generation in China is an important indication of power generation structure and deployment in China.
In the current stage, extensive co-benefit analyses were conducted on either a specific wind farm or a region using different methods [2-5]. In this paper, both the direct environmental co-benefits and indirect environmental costs of wind power generation in China are mapped. Also, scenarios on enlarging the environmental co-benefit and balancing the regional discrepancy of co-benefits are set to shed light on future wind deployment in China. The reminder of this paper is organized as follows: In Section 2, the
method used to calculate environmental co-benefits and LCA environmental costs of wind power is introduced. Section 3 presents the regional environmental co-benefits and LCA environmental costs. Scenario analysis is shown in Section 4. Finally, conclusions and policy suggestions on wind power deployment are drawn in Section 5.
2.Material and methods
2.1 Regional classification
There are six power grids in China, which are managed by State Grid Corporation of China and China Southern Power Grid. Regional classification in terms of power grids is also listed in Table 1. This classification is the basis of following co-benefit analysis.
Table 1. Regional classification of power grids
Power grids Provinces
North China grid Beijing, Tianjin, Hebei, Shanxi, Shandong, Inner Mongolia Northeast China grid Liaoning, Jilin, Heilongjiang
East China grid Shanghai, Jiangsu, Zhejiang, Anhui, Fujian Central China grid Henan, Hubei, Hunan, Jiangxi, Sichuan, Chongqing Northwest China
grid
Shaanxi, Gansu, Qinghai, Ningxia Autonomous Region, Xinjiang Autonomous Region South China grid Guangdong, Guangxi Autonomous Region, Yunnan, Guizhou, Hainan
2.2 Operational environmental co-benefits of wind power penetration
To calculate the environmental co-benefits of wind power penetration, the first step is to know the baseline emissions of regional grids. Once the baseline emission factors (environmental emissions per kWh) are determined, the environmental cobenefits of wind power penetration in the current grids can be quantified by multiplying the on-grid wind power and baseline emission factors. The calculation of baseline emission factors for a specific power grid is shown in eq. (1)-(6).
2 2 j,i,CO , , ,CO
Q
=E
j iu
COEF
j i (1) j,i,e , , ,e , , , , , , , , , , ,Q
=E
j i j i[(1
e n)
e n j e n j]
[
e n j(1
e n j)] (1
e n j)
n n nCOEF
J
s
D
s
D
s
u
u
¦
u
u
¦
u
¦
(2) j,i,w ,i, ,Q
=
¦
T
j elu
El
j i (3) 2 2 g,i,CO j,i,CO j gQ
=
Q
¦
(4) g,i,e j,i,e j gQ
=
Q
¦
(5)g,i,w j,i,w j g
Q
=
Q
¦
(6) Based on the baseline emissions of regional grids, the environmental co-benefits of regions are calculated using eq. (7)-(9).2 2 g,CO
=Q
g,CO/
g gR
El
u
W
(7) g,e=Q
g,e/
g gR
El
u
W
(8) g,w=Q
g,w/
g gR
El
u
W
(9) 2.3 Scenario analysisBased on the calculation of environmental co-benefits, two scenarios are set to show the variation in environmental co-benefits, as shown in Table 2.
Table 2. Scenario setting Scenario Setting
Baseline The status quo of Chinese power sector Scenario 1 Increasing abandoned wind power by
Scenario 2 Taking account to power transmission among regions into consideration
3.Results and discussions
3.1 Co-benefits analysis
Figure 1 demonstrates the regional distribution of environmental co-benefits due to wind power penetration in China. The total CO2, SO2, NOx, and PM2.5 emissions avoided are 1.39E+08t, 3.30E+05t, 4.63E+05t, and 6.86E+04t, respectively. Total water consumption saved is 2.13E+08m3.
.
(c) (d)
(e)
Figure 1 The regional environmental co-benefits distribution (a) CO2 (b) SO2 (c) NOx (d) PM2.5 (e) Water
In terms of regional distribution, even though large scale wind power generation has been implemented in Northwest China grid, the environmental co-benefit in this region is much lower than that of Northeast China grid and North China grid. This is mainly because Northwest China grid has a much cleaner energy structure due to the penetration of renewable energy. The largest environmental co-benefits occur mainly in north China grid. However, there is an exception, i.e., PM2.5 reduction co-benefit, which locates in Northeast China grid. This is mainly because the high PM2.5 emission factor in Northeast China grid due to the extensive utilization of low quality coal in power generation.
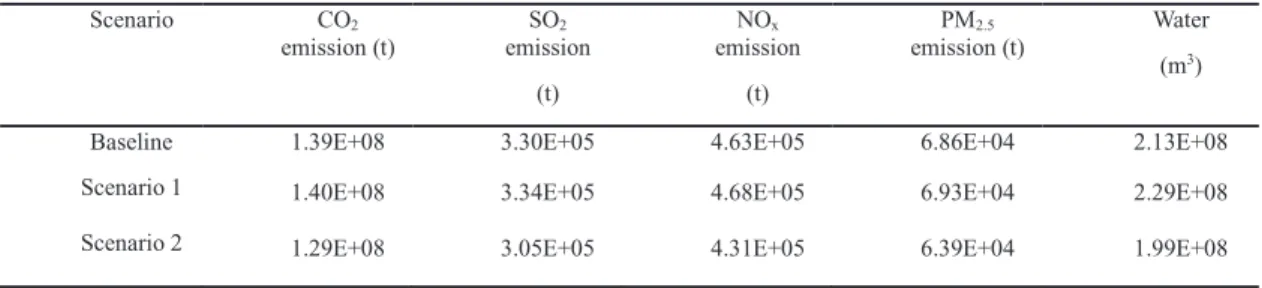
3.2 Scenario analysis
The results of scenario analysis are listed in Table 3. If 5% abandoned wind power is collected to the grid, there will be almost 1% increase of environmental co-benefit. When power transmission among grids is considered, there will be a substantial reduction of co-benefits due to power losses in transmission.
Table 3. Scenario analysis results Scenario CO2 emission (t) SO2 emission (t) NOx emission (t) PM2.5 emission (t) Water (m3)
Baseline 1.39E+08 3.30E+05 4.63E+05 6.86E+04 2.13E+08 Scenario 1 1.40E+08 3.34E+05 4.68E+05 6.93E+04 2.29E+08 Scenario 2 1.29E+08 3.05E+05 4.31E+05 6.39E+04 1.99E+08
4.Conclusions
This study offers policy-makers an indication that wind power has co-benefits such as the mitigation of CO2 and air pollutant (SO2, NOx and PM2.5) emissions and conservation of water. Wind power not only saves expenditure for the government but also tackles multiple environmental problems.
Scenario analysis shows that the more co-benefits could be gained by adding grid connection of abandoned wind power and reducing power losses in transmission. Thus, the construction of complete regional and interregional UHV transmission grids is a promising way to increase the efficiency of wind power utilization.
Acknowledgement
This work was supported by the Scientific Research foundation (No. 35932015025).
References
[1] China Renewable Energy Industries Association. 2014 China Wind Power Review and Outlook. http://www.creia.net/publish/report/198.html
[2] Aitken M. Wind power and community benefits: Challenges and opportunities. Energ Policy 2010; 38: 6066–75.
[3] McCubbin D, Sovacool BK. Quantifying the health and environmental benefits of wind power to natural gas. Energ Policy 2013,
53: 429–41.
[4] Xue B, Ma Z, Geng Y, Heck P, Ren W, Tobias M, Maas A, Jiang P, Oliveira JAP, Fujita T. A life cycle co-benefits assessment of wind power in China. Renew Sust Energ Rev 2015, 41: 338–46.
[5] Valentino L, Valenzuela V, Botterud A, Zhou Z, Conzelmann G. System-wide emissions implications of increased wind power penetration. Environ Sci Technol 2012, 46(7):4200–6.
Biography
Dr. Jin Yang is a lecture in School of Humanities and Economic Management, China University of Geosciences, Beijing. Her research interests focus on Life Cycle Assessment, Renewable Energy System, and Carbon Footprint Accounting.