October 11, 2012
Alpha Pilot – Small/Mid Cap
Same same, but different
Estimate downgrades + mid-point valuation = creative stock-picking
Portfolio suggestions combining value, GARP, yield and quality
Almost time to bet against the negative revisions in consumer stocks
Contents
Table of figures
4
Key highlights
6
Valuation
11
Revisions
19
Quality
26
Implied sales growth
31
Multifactor models
34
Screening methodology
41
Disclaimer
43
Carl Grapenfelt
+46 8 701 33 93
[email protected]
Elias Porse
+46 8 701 34 24
[email protected]
Jan Dworsky
+46 8 701 55 55
[email protected]
This product combines consensus data and our
own estimates, building on our work done in the
Consensus Pilot and our Small/Mid and large cap
pilots for Nordic stocks with a market cap below
EUR 4bn and a daily liquidity of at least EUR
200,000.
Table of figures
Key highlights
Quality yield screening (quality 70%, dividend yield 30% weight) ... 8
Quality GARP screening (50% quality, 50% implied growth) ... 8
HCM multifactor screening 1 (value 30%, yield 20%, quality 30%, growth 20%) ... 9
HCM multifactor screening 2 (value 30%, yield 20%, rev. 10%, quality 40%) ... 10
Valuation
P/E, 12m forward and 12m trailing ... 11
P/B and ROE, 12m forward ... 11
Last 12m dividend yield vs. 10-year yield ... 12
Dividend payout, next 12m vs. last 12m ... 12
Next 12m EV/sales vs. 12m forward EBIT margin ... 12
EV/S model 12m forward, top 25 ... 13
EV/S model 12m forward, bottom 25 ... 13
EV/S model 12m historical, top 25 ... 14
EV/S model 12m historical, bottom 25 ... 14
15 largest 2013e P/E appreciation, -3m (%) ... 15
15 largest 2013e P/E declines, -3m (%) ... 15
15 highest 2012 dividend yields (%) ... 15
Payout ratio – top 25 ... 16
15 lowest forward P/E ... 16
15 lowest trailing P/E ... 17
15 highest forward P/E ... 17
15 lowest 12m forward P/B ... 17
EV/S relative to EW, top decile ... 18
EV/S relative to EW, bottom decile ... 18
Div yielders relative to EW, top decile ... 18
P/BV relative to EW, bottom decile ... 18
Revisions
HCMe EPS revision indicator ... 19
EBIT margin outcome vs. expectations ... 20
Sales growth expectations vs. outcome ... 20
EPS growth trend ... 20
Dispersion in EPS trend (median of universe) ... 21
HCMe sales revision indicator ... 21
Recommendation trend ... 21
Figure 1: Proportion of companies with EBIT margin improvement ... 22
Bottom 15 2013e EPS revisions, -3m ... 22
Top 15 2013e EPS revisions, -3m ... 22
Two-factor revision model, top 25 ... 23
Revision trends, bottom 25 ... 23
Sales revision ratio vs. EPS revision ratio ... 24
Recommendation revision ratio vs. EPS revision ratio ... 24
EPS revisions relative to EW, top decile ... 25
Sales revisions relative to EW, bottom decile ... 25
EPS + recommendation revision combo relative to EW, top decile ... 25
Quality
7-year average ROCE – Top 25 ... 26
EBITDA margin stability – Top 25 ... 27
EBIT margin stability – Top 25 ... 27
Net debt/EBITDA – ranked by lowest for 2012e ... 28
Net debt/EBITDA – ranked by highest for 2012e ... 28
Biggest positive net debt/EBITDA change in units since 2011 ... 29
Biggest negative net debt/EBITDA change in units since 2011 ... 29
Lowest one-year (52w) beta ... 29
Defensive quality screen (high ROCE, margin stability, low beta) top 25 ... 30
ROCE margin stability combo relative to EW, top decile ... 30
Implied sales growth diff vs. CAGR 2005-13e - top 25 (long screen) ... 31
Implied sales growth diff vs. CAGR 2005-13e - bottom 25 (short screen) ... 32
Implied sales growth diff vs. 2014e - top 25 (long screen) ... 32
Implied sales growth diff vs. 2014e - bottom 25 (short screen) ... 33
Multifactor models
Greenblatt – top 25, forward ... 34
Greenblatt – bottom 25, forward ... 35
Greenblatt –top 25, historical ... 35
Greenblatt - bottom 25, historical ... 36
Handelsbanken’s two-factor model (value + revisions), top 25 (forecasts) ... 36
Handelsbanken’s two-factor model (value + revisions), bottom 25 (forecasts) ... 37
Handelsbanken’s two-factor model (value + revisions), top 25 (history) ... 37
Handelsbanken’s two-factor model (value + revisions), bottom 25 (history) ... 38
Three-factor model (value + revisions + quality) – top 25, forward ... 38
Three-factor model (value + revisions + quality) – bottom 25, forward ... 39
Three -factor model (value + revisions + quality) – top 25, historical ... 39
Three -factor model (value + revisions + quality) – bottom 25, historical ... 40
Key highlights
Our view remains generally the same, as we continue to argue that estimates are too high, but valuation
levels have now reached mid-point making for an even more demanding stock-picking environment. The
value normalisation we witnessed in early September came to a screeching halt in conjunction with QE3,
implying that value alone is not enough. Leaning on revisions is also dangerous, as we see estimate
dispersion widening. Recent profit warnings in Net Ent. and Betsson have painfully reminded us what
happens when quality growth stocks disappoints, leaving us advocating a more defensive mix of value,
quality, yield and GARP traits. A contrarian strategy would involve looking for decent yielding Greenblatt
names that have already shown weakness. Many consumer stocks fit this bill, and we are on high alert as
we approach a point when it is time to bet against the negative revision trend.
Valuation
Valuation multiples have expanded on the heels of rising markets and falling estimates, and
now stand just shy of 15x 12-month trailing EPS. This has pushed the yield gap vs. long dated
government bonds down towards 200bp, after peaking at 250bp in late spring, whereas the
earnings yield gap has fallen to around 500bp from its 700bp peak. Equities still imply better
fortunes relative to bonds, though multiples have normalised relative to the historical
averages. This normalisation phase has proven the strongest among value stocks, which have
sharply outperformed the market (8-10 p.p. from summer lows). However, whether using our
normalised value approach (EV/S model) or low quality value approach, the cheapest names
have underperformed the market following the QE3 announcement on September 13. This
development is in line with the conclusions in our latest Small/Mid Cap Pilot, where we
argued that investors should not play a strategy based solely on valuation factors.
Revisions
Estimates have remained under pressure, with our revision indicators deep in negative
territory. We continue to argue that forecast changes will stay on the minus side, as
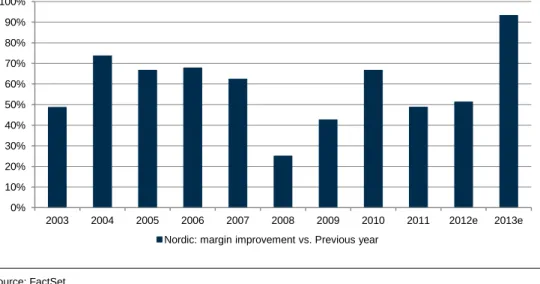
expectations for 2013e still look exuberant. Just consider that the prevailing consensus
forecasts imply margins improving 150bp on 3% of top-line growth or that 93% of the
universe is expected to post margin improvements in 2013. Further to this, our screenings
show earnings dispersion at extremely low levels, which suggests confidence in
estimates. We find such a scenario very unrealistic and consequently expect dispersion to
widen as we exit the reporting season and, hopefully, analysts take down 2013e
estimates. We maintain our view that during this process it will be unusually difficult to
find earnings upgrade candidates, while simply betting on the stocks currently seeing the
best revision pattern is too risky. The revision factor (top decile) has in fact been flat
since May, though recent weeks have shown some outperformance. The bottom decile
has seen strong alpha generation lately, which in effect could spell trouble for the entire
universe as downgrades have been punished.
Quality
Quality factors have shown an inverse pattern compared to value stocks. That is, this
strategy underperformed until the QE3 announcement, and has outperformed since.
Conclusions
The stock-picking environment is very tricky, as we foresee continued estimate pressure
coupled with valuation levels at mid-point. We continue to argue that it is not as simple as
buying value outright, but also find that the revisions factor carries unusually high risks.
This leaves quality, and GARP characteristics, which we believe should be combined with
value and dividend yield traits. However, as recent profit warnings in Focus List names
Betsson and Net Entertainment have reminded us: it can be very painful when quality
growth stocks disappoint.
Valuation levels
have reached
historical averages…
…but are still
attractive vs. bonds
We remain convinced
that the prevailing
estimate pressure is
here to stay
We believe a
combination of yield,
GARP and quality
should yield is best
Stock calls
A contrarian strategy would involve looking for decent yielding Greenblatt names that have
already shown weakness in both estimates and share prices. Consumer-related stocks
dominate this category, as they are overrepresented in our Greenblatt-inspired rankings. In
this sector, we are approaching a point when it is time to take a bet against the negative
revision trend. Stocks which fit the bill include Axfood, Clas Ohlson, MTG, Bilia,
Oriflame, Betsson, Ekornes, JM, Net Entertainment, CDON and Duni. We are therefore not
exiting MTG, Betsson and Net Entertainment, which all have been downgraded recently (to
ACCUMULATE), though we acknowledge that in the short term they remain triggerless
and risk further de-rating. Additionally, these companies would be among the key
benefactors from the proposed corporate tax cut in Sweden. When it comes to Oriflame,
Clas Ohlson, Bilia, Duni and CDON, we are monitoring their performance closely, but are
not prepared to include them in our Focus List just yet.
Taking into account the above mentioned factor risks, we also highlight groupings of
companies that reflect a particular style or combination thereof from a screening
perspective, thereby leaving our subjectivity out of the equation. Below are some of the
stocks that we think warrant highlighting, illustrating some of the difficulties that we face:
Axfood and Intrum Justitia screen among the most attractive when you combine high
ROCE, margin stability, low beta, and dividend yield. Despite our EV/S model suggesting
that these stocks look fair, we think they warrant a closer look. Axfood’s bottom line could
also see ~6% boost to EPS in 2013 given the proposed corporate tax cuts.
Outotec score highly when we join value, quality and revision traits, but we believe that
mining capex cuts will eventually bleed into sales in 2014, when we expect a 13% y-o-y
drop. Do you trust the short-term revision trend, valuation and historical growth or should
you be afraid of downgrades based on potential peak earnings multiples?
JM looks very cheap, at 0.75x sales, given historical and forecasted profitability well above
10% and a 6% yield. In contrast, the secondary housing market is characterised by high
supply and major home builders have seen bookings fall sharply, potentially signalling risk
in the housing market. We are thus stuck between cheapness and sentiment risk again.
HiQ (part of SHB Focus List)
screens favourably using all our metrics apart from
revisions, with an EV/S of <1x, stable EBIT margins (~15%), high returns, delivery of
>10% top-line growth historically, and about a 7%. Further, it is a beneficiary of the
proposed corporate tax cut. The only caveat is the size of the company and stock liquidity.
The lower-quality value segment merits a mention, where asset plays Songa Offshore (part
of SHB Focus List) and
BW Offshore screen cheaply and did not bounce in line with
stocks with a similar debt level. Patience is running out and the debt pile is cause for
concern, but it is hard to argue that these stocks should remain so depressed.
Our oil service call from three months ago has played out nicely. From this junction, we
note that the upside in our EV/S model in Fred Olsen is now rather limited, potentially
prompting some profit taking. Prosafe screens negatively, with its estimates under pressure
and its share trading at 5x sales, which also suggests good profit taking odds. We remain
more optimistic on subsea and seismic names from a screening perspective.
Schibsted has seen downgrades for over two years, but the share has completely decoupled
from the estimate trend, which at the current valuation implies that the company would
need to outgrow its historical track-record by almost 3x.
Bang Olufsen and Mestsä Board look risky, with unstable profitability and poor ROCE,
in addition to looking very expensive according to our EV/S model.
Approaching an
opportunity to bet
against the revision
trend within the
consumer names
Axfood a great bet if
you are bearish
Outotec and JM
illustrate screening
appeal vs. sentiment
risk
HiQ among the best
cases around – we
just wish the liquidity
was greater
Our screenings imply
profit-taking in
Prosafe and FOE
Take profit in
Schibsted, B&O and
Metsä Board
Screening various investment styles
Quality yield screening (quality 70%, dividend yield 30% weight)
Div. Screening for overw eights Mcap (EURm ) Perf -3m (%) Adj.EV/S Hist Fw d Im plied Hist Fw d Grow th 5y CAGR 05-13 2014e yield 12e % Beta HiQ 204 -8 0.94 16.0 14.5 9.1 68 53 -5.8 11.0 12.8 7.2 0.7 Oriflame 1,419 -6 1.09 12.2 11.9 10.5 20 17 1.1 9.4 4.0 6.9 0.7 Ekornes 439 2 0.98 16.8 14.9 9.5 68 51 -5.8 2.9 3.4 8.6 0.9 Axfood n.m 10 0.37 3.6 3.5 3.6 2 -2 4.0 3.5 2.5 5.0 0.5 Sw eco 744 -5 0.81 9.0 9.0 7.8 16 16 1.2 11.6 4.9 4.7 0.7 Intrum Justitia 880 -4 2.42 20.8 23.2 23.3 -15 0 5.1 5.7 3.5 5.0 0.7 Duni 314 -1 0.84 9.8 11.0 8.1 26 45 -0.9 1.0 4.2 6.3 0.5 Net Entertainment 323 0 4.12 36.5 31.8 39.6 -8 -19 7.0 33.6 17.0 3.4 0.8 Elisa 2,916 9 2.23 17.7 19.6 21.4 -23 -11 6.8 2.0 -1.6 7.7 0.5 Clas Ohlson 646 -13 0.76 10.5 8.7 7.3 44 19 -1.3 9.0 6.0 5.1 0.9 Prosafe 1,512 16 5.00 46.2 47.7 48.1 -5 -1 4.5 7.3 12.6 6.3 0.9 Simcorp 775 32 3.02 23.0 23.5 29.1 -19 -18 8.5 10.3 14.0 2.7 0.5 Securitas 2,124 -8 0.42 5.5 4.5 4.0 57 20 -0.4 0.3 3.1 6.0 1.0 Veidekke 851 10 0.29 3.2 3.8 2.7 17 41 -0.8 5.9 12.4 5.9 0.7 Axis 1,323 12 2.04 17.0 15.9 19.7 -13 -19 7.6 25.1 22.0 3.7 1.2 Mekonomen 819 -1 1.38 12.1 13.2 13.3 -11 -1 5.0 13.8 6.4 4.1 0.8 Indutrade 864 -8 1.00 9.9 9.3 9.6 4 -4 4.1 11.2 4.0 3.6 0.8 Lundbeck 2,796 -12 1.33 23.2 14.7 12.8 78 14 -3.5 6.5 0.8 2.2 0.3 NCC 1,598 3 0.32 4.3 4.0 3.0 54 40 -1.9 1.7 4.7 7.9 1.3 Betsson 802 -17 2.55 24.3 27.5 24.5 -1 12 2.9 42.2 13.7 6.1 1.1 TGS-Nopec 2,760 25 3.33 44.7 43.1 32.1 35 31 -2.1 18.8 10.0 3.4 1.1 Royal Unibrew 661 21 1.47 10.2 15.3 14.2 -30 8 6.1 0.8 1.6 5.1 0.1
Fred. Olsen Energy 2,322 22 2.91 34.2 34.4 28.0 26 26 0.0 11.5 8.7 7.8 0.9
Unibet Group 596 4 1.96 29.7 18.5 18.9 52 -2 -0.8 22.4 11.9 4.5 0.7
Pandora 1,490 58 1.49 36.0 23.4 14.3 144 60 -9.6 n.m 7.0 3.5 1.3
Average 6 1.72 19.1 17.9 16.6 23 15 1.2 11.2 7.6 5.3 0.8
Adj. EBIT-m argin (%) Share Pot. (%) Im pl. Sales gr. (%)
Source: Handelsbanken Capital markets (Quality defined as: 40% ROCE, 30% margin stability and 30% low beta)
Quality GARP screening (50% quality, 50% implied growth)
Screening for overw eights Mcap (EURm ) Perf -3m (%) Adj.EV/S Hist Fw d Im plied Hist Fw d Grow th 5y CAGR 05-13 2014e yield 12e % Beta Net Entertainment 323 0 4.12 36.5 31.8 39.6 -8 -19 7.0 33.6 17.0 3.4 0.8 HiQ 204 -8 0.94 16.0 14.5 9.1 68 53 -5.8 11.0 12.8 7.2 0.7 Axis 1,323 12 2.04 17.0 15.9 19.7 -13 -19 7.6 25.1 22.0 3.7 1.2 TGS-Nopec 2,760 25 3.33 44.7 43.1 32.1 35 31 -2.1 18.8 10.0 3.4 1.1 Pandora 1,490 58 1.49 36.0 23.4 14.3 144 60 -9.6 7.0 3.5 1.3 Ekornes 439 2 0.98 16.8 14.9 9.5 68 51 -5.8 2.9 3.4 8.6 0.9 Sw eco 744 -5 0.81 9.0 9.0 7.8 16 16 1.2 11.6 4.9 4.7 0.7 Unibet Group 596 4 1.96 29.7 18.5 18.9 52 -2 -0.8 22.4 11.9 4.5 0.7 Clas Ohlson 646 -13 0.76 10.5 8.7 7.3 44 19 -1.3 9.0 6.0 5.1 0.9 CDON Group 317 4 0.49 6.0 2.4 4.8 26 -50 6.6 15.0 0.0 0.9 Betsson 802 -17 2.55 24.3 27.5 24.5 -1 12 2.9 42.2 13.7 6.1 1.1 Kongsberg Gruppen 1,788 -1 0.62 11.4 11.3 6.0 75 74 -8.0 14.9 7.5 3.4 1.0 Oriflame 1,419 -6 1.09 12.2 11.9 10.5 20 17 1.1 9.4 4.0 6.9 0.7
Modern Times Group 2,180 -12 1.12 14.7 12.8 10.7 30 16 -0.8 7.2 6.4 3.6 1.3
Hexpol 1,051 13 1.14 11.2 13.0 11.0 3 20 2.1 18.6 4.0 2.3 1.1
Lundbeck 2,796 -12 1.33 23.2 14.7 12.8 78 14 -3.5 6.5 0.8 2.2 0.3
Veidekke 851 10 0.29 3.2 3.8 2.7 17 41 -0.8 5.9 12.4 5.9 0.7
Indutrade 864 -8 1.00 9.9 9.3 9.6 4 -4 4.1 11.2 4.0 3.6 0.8
Transmode 229 -12 1.28 13.0 16.6 12.3 5 29 0.3 10.0 2.5 0.9
Opera Softw are 616 -6 2.57 15.3 23.6 24.7 -35 -4 8.9 36.4 12.1 0.5 0.5
Simcorp 775 32 3.02 23.0 23.5 29.1 -19 -18 8.5 10.3 14.0 2.7 0.5
Mekonomen 819 -1 1.38 12.1 13.2 13.3 -11 -1 5.0 13.8 6.4 4.1 0.8
DSV 3,209 9 0.57 5.2 5.6 5.5 -7 2 4.4 9.9 5.4 1.0 0.9
Fred. Olsen Energy 2,322 22 2.91 34.2 34.4 28.0 26 26 0.0 11.5 8.7 7.8 0.9
AF-Group 549 7 0.77 7.9 9.2 7.4 7 25 1.1 13.3 3.1 3.7 1.1
4 1.54 17.7 16.5 14.8 25 16 0.9 15.7 8.9 4.0 0.9
Adj. EBIT-m argin (%) Share Pot. (%) Im pl. Sales gr. (%)
Source: Handelsbanken Capital markets (quality defined as 50% ROCE. 40% margin stability and 10% Beta)
5.3% yield with 1%
implied growth for
this basket
Intrum and Clas O
knocking on Focus
List door
Is it finally time for
Securitas to shine?
Betsson PW vs. 6%
yield and likely
growth in 2013e
4% yield, beta 0.9
with 1% implied
growth for this
basket
Net Ent, Axis, HiQ,
Betsson, KOG, MTG,
and AF part of our
Focus List
Clas O again
Consumer stocks ex
Pandora have
struggled
HCM multifactor screening 1 (value 30%, yield 20%, quality 30%, growth 20%)
Div. Screening for overw eights Mcap (EURm ) Perf -3m (%) Adj.EV/S Hist Fw d Im plied Hist Fw d Grow th 5y CAGR 05-13 2014e yield 12e % Beta HiQ 204 -8 0.94 16.0 14.5 9.1 68 53 -5.8 11.0 12.8 7.2 0.7 Ekornes 439 2 0.98 16.8 14.9 9.5 68 51 -5.8 2.9 3.4 8.6 0.9 Pandora 1,490 58 1.49 36.0 23.4 14.3 144 60 -9.6 7.0 3.5 1.3 TGS-Nopec 2,760 25 3.33 44.7 43.1 32.1 35 31 -2.1 18.8 10.0 3.4 1.1 NCC 1,598 3 0.32 4.3 4.0 3.0 54 40 -1.9 1.7 4.7 7.9 1.3 JM 1,148 -2 0.73 11.7 12.4 7.0 65 75 -6.3 2.9 10.1 5.6 1.7 Veidekke 851 10 0.29 3.2 3.8 2.7 17 41 -0.8 5.9 12.4 5.9 0.7 Clas Ohlson 646 -13 0.76 10.5 8.7 7.3 44 19 -1.3 9.0 6.0 5.1 0.9 Oriflame 1,419 -6 1.09 12.2 11.9 10.5 20 17 1.1 9.4 4.0 6.9 0.7 Kongsberg Gruppen 1,788 -1 0.62 11.4 11.3 6.0 75 74 -8.0 14.9 7.5 3.4 1.0
Fred. Olsen Energy 2,322 22 2.91 34.2 34.4 28.0 26 26 0.0 11.5 8.7 7.8 0.9
Sw eco 744 -5 0.81 9.0 9.0 7.8 16 16 1.2 11.6 4.9 4.7 0.7 Konecranes 1,511 16 0.62 7.3 7.3 5.9 23 24 0.0 11.3 2.6 4.4 1.9 Securitas 2,124 -8 0.42 5.5 4.5 4.0 57 20 -0.4 0.3 3.1 6.0 1.0 Duni 314 -1 0.84 9.8 11.0 8.1 26 45 -0.9 1.0 4.2 6.3 0.5 Outotec 1,749 8 0.60 7.9 9.1 5.8 26 41 -3.4 18.0 -12.7 2.9 1.5 Betsson 802 -17 2.55 24.3 27.5 24.5 -1 12 2.9 42.2 13.7 6.1 1.1
Modern Times Group 2,180 -12 1.12 14.7 12.8 10.7 30 16 -0.8 7.2 6.4 3.6 1.3
Unibet Group 596 4 1.96 29.7 18.5 18.9 52 -2 -0.8 22.4 11.9 4.5 0.7 Höganäs 919 0 1.14 12.8 15.3 10.9 18 43 -0.9 6.2 4.0 4.4 1.1 Boliden 3,513 13 0.90 13.3 11.3 8.7 64 37 -2.8 8.8 0.6 3.6 1.7 Hexpol 1,051 13 1.14 11.2 13.0 11.0 3 20 2.1 18.6 4.0 2.3 1.1 Tieto 962 3 0.54 6.5 6.8 5.2 27 32 -0.9 1.0 4.9 5.9 0.7 Net Entertainment 323 0 4.12 36.5 31.8 39.6 -8 -19 7.0 33.6 17.0 3.4 0.8 Axfood 1,515 10 0.37 3.6 3.5 3.6 2 -2 4.0 3.5 2.5 5.0 0.5 5 1.22 15.7 14.6 11.8 38 31 -1.4 11.4 6.1 5.1 1.0 Div. Screening for underw eights Mcap (EURm ) Perf -3m (%) Adj.
EV/S Hist Fw d Im plied Hist Fw d Grow th 5y CAGR 05-13 2014e yield 12e % Beta Talvivaara Mining Co 531 13 3.11 n.m. 11.0 29.9 n.m n.m 10.1 0.0 1.7 Outokumpu 1,075 7 0.60 0.0 -0.2 5.8 n.m n.m -1.2 0.3 0.0 1.5 SAS 266 29 0.47 2.6 1.4 4.5 n.m n.m 21.4 -4.2 1.0 0.0 1.2 Norske Skog 130 25 0.43 0.6 3.4 4.1 n.m n.m 19.8 -4.8 -5.0 0.0 1.3 Alk-Abello 509 -3 1.35 9.3 7.6 13.0 -24 -35 12.9 -7.3 7.0 1.3 0.3 Metsä Board 769 16 0.64 1.1 5.1 6.2 n.m -31 18.8 -10.7 0.1 0.0 1.8
Norw egian Air Shuttle 543 6 1.04 2.6 5.6 10.0 n.m n.m 23.5 28.1 13.0 0.0 1.5
Bang & Olufsen 419 36 0.78 2.2 6.5 7.5 -67 -13 15.6 -1.4 9.3 1.3 1.0
Lundin Mining 2,283 17 2.88 21.0 19.7 27.7 -20 -24 10.3 20.5 -0.4 0.0 1.3 SSAB 1,667 -19 0.78 9.7 3.9 7.5 61 n.m 6.1 4.9 2.9 4.3 2.1 Chr. Hansen 3,285 4 4.61 22.3 27.5 44.3 -55 -42 16.3 9.0 2.0 0.3 Stockmann 1,133 1 0.84 5.4 5.1 8.1 -56 -62 13.1 8.5 4.8 3.8 0.9 Schibsted 3,297 20 1.71 9.5 11.2 16.4 -46 -35 13.7 5.8 5.0 1.8 1.1 Nobia 527 31 0.49 5.2 4.5 4.7 12 -6 3.6 -0.8 3.5 1.5 1.6 BW Offshore 364 -41 2.69 -1.8 14.2 25.9 n.m n.m 37.1 40.4 -2.8 11.0 0.8 D/S Norden 871 -2 0.78 11.4 4.2 7.5 37 -32 3.3 -0.7 9.1 2.7 0.7 KappAhl 161 23 0.63 8.9 3.0 6.0 102 n.m 4.3 2.4 2.5 0.0 1.0 Elekta 3,928 16 3.21 16.4 21.5 30.9 -50 -32 14.3 12.6 9.9 1.6 0.5 Petroleum Geo-Services 2,892 37 2.49 19.7 21.9 24.0 -21 -10 6.9 8.8 9.4 1.3 1.1 Archer 405 -28 0.66 5.6 5.5 6.3 -32 -37 6.6 3.4 0.0 1.8 AarhusKarlshamn 1,244 10 0.73 5.3 6.1 7.0 -32 -18 8.3 7.5 7.8 1.9 0.7 Songa Offshore 330 -10 2.34 23.3 20.5 22.5 14 -35 4.5 7.9 0.0 1.5 Vestas 1,000 31 0.28 2.7 2.7 2.7 1 3 3.7 6.4 8.4 0.0 1.5 Amer Sports 1,209 14 0.76 6.1 7.4 7.3 -22 2 5.5 2.6 4.7 3.4 0.7 Stora Enso 3,891 -3 0.60 5.7 6.5 5.8 -2 22 2.9 -2.4 3.3 6.3 1.5 9 1.40 8.1 9.0 13.4 -11 -23 11.8 5.5 5.0 1.8 1.2
Adj. EBIT-m argin (%) Share Pot. (%) Im pl. Sales gr. (%) Adj. EBIT-m argin (%) Share Pot. (%) Im pl. Sales gr. (%)
Source: Handelsbanken Capital markets
5% yield, beta 1 with
-1.4% implied growth
for this basket
If construction
margins improve, the
sector has scope to
normalise
Duni again
Our screenings can’t
get rid of MTG and
Axfood
1% yield, beta 1.2
with 12% implied
growth for this
basket
Metsä Board and
B&O screen poorly
Nobia back at 0.5x
sales
Elekta needs to
match historical
growth for valuation
to be fair
HCM multifactor screening 2 (value 30%, yield 20%, rev. 10%, quality 40%)
Div. Screening for overw eights Mcap (EURm ) Perf -3m (%) Adj.EV/S Hist Fw d Im plied Hist Fw d Grow th 5y CAGR 05-13 2014e yield 12e % Beta Ekornes 439 2 0.98 16.8 14.9 9.5 68 51 -5.8 2.9 3.4 8.6 0.9 TGS-Nopec 2,760 25 3.33 44.7 43.1 32.1 35 31 -2.1 18.8 10.0 3.4 1.1 Oriflame 1,419 -6 1.09 12.2 11.9 10.5 20 17 1.1 9.4 4.0 6.9 0.7 HiQ 204 -8 0.94 16.0 14.5 9.1 68 53 -5.8 11.0 12.8 7.2 0.7 JM 1,148 -2 0.73 11.7 12.4 7.0 65 75 -6.3 2.9 10.1 5.6 1.7 Axfood 1,515 10 0.37 3.6 3.5 3.6 2 -2 4.0 3.5 2.5 5.0 0.5 Pandora 1,490 58 1.49 36.0 23.4 14.3 144 60 -9.6 7.0 3.5 1.3 Sw eco 744 -5 0.81 9.0 9.0 7.8 16 16 1.2 11.6 4.9 4.7 0.7 NCC 1,598 3 0.32 4.3 4.0 3.0 54 40 -1.9 1.7 4.7 7.9 1.3 Duni 314 -1 0.84 9.8 11.0 8.1 26 45 -0.9 1.0 4.2 6.3 0.5 Konecranes 1,511 16 0.62 7.3 7.3 5.9 23 24 0.0 11.3 2.6 4.4 1.9 Outotec 1,749 8 0.60 7.9 9.1 5.8 26 41 -3.4 18.0 -12.7 2.9 1.5 Securitas 2,124 -8 0.42 5.5 4.5 4.0 57 20 -0.4 0.3 3.1 6.0 1.0 Clas Ohlson 646 -13 0.76 10.5 8.7 7.3 44 19 -1.3 9.0 6.0 5.1 0.9 Veidekke 851 10 0.29 3.2 3.8 2.7 17 41 -0.8 5.9 12.4 5.9 0.7
Fred. Olsen Energy 2,322 22 2.91 34.2 34.4 28.0 26 26 0.0 11.5 8.7 7.8 0.9
YIT 1,968 15 0.55 6.0 6.0 5.3 19 17 1.6 6.0 2.7 4.8 1.4
Tieto 962 3 0.54 6.5 6.8 5.2 27 32 -0.9 1.0 4.9 5.9 0.7
Kongsberg Gruppen 1,788 -1 0.62 11.4 11.3 6.0 75 74 -8.0 14.9 7.5 3.4 1.0
Modern Times Group 2,180 -12 1.12 14.7 12.8 10.7 30 16 -0.8 7.2 6.4 3.6 1.3
Lundbeck 2,796 -12 1.33 23.2 14.7 12.8 78 14 -3.5 6.5 0.8 2.2 0.3 Höganäs 919 0 1.14 12.8 15.3 10.9 18 43 -0.9 6.2 4.0 4.4 1.1 Boliden 3,513 13 0.90 13.3 11.3 8.7 64 37 -2.8 8.8 0.6 3.6 1.7 Intrum Justitia 880 -4 2.42 20.8 23.2 23.3 -15 0 5.1 5.7 3.5 5.0 0.7 AF-Group 549 7 0.77 7.9 9.2 7.4 7 25 1.1 13.3 3.1 3.7 1.1 5 1.04 14.0 13.1 10.0 40 33 -1.6 7.9 4.7 5.1 1.0 Div. Screening for underw eights Mcap (EURm ) Perf -3m (%) Adj.
EV/S Hist Fw d Im plied Hist Fw d Grow th 5y CAGR 05-13 2014e yield 12e % Beta SAS 266 29 0.47 n.m. 1.4 4.5 n.m n.m 21.4 -4.2 1.0 0.0 1.2 Talvivaara Mining Co 531 13 3.11 n.m. 11.0 29.9 n.m n.m 10.1 0.0 1.7 Norske Skog 130 25 0.43 0.6 3.4 4.1 n.m n.m 19.8 -4.8 -5.0 0.0 1.3 Outokumpu 1,075 7 0.60 0.0 -0.2 5.8 n.m n.m -1.2 0.3 0.0 1.5
Norw egian Air Shuttle 543 6 1.04 2.6 5.6 10.0 n.m n.m 23.5 28.1 13.0 0.0 1.5
Alk-Abello 509 -3 1.35 9.3 7.6 13.0 -24 -35 12.9 -7.3 7.0 1.3 0.3
Metsä Board 769 16 0.64 1.1 5.1 6.2 n.m -31 18.8 -10.7 0.1 0.0 1.8
Lundin Mining 2,283 17 2.88 21.0 19.7 27.7 -20 -24 10.3 20.5 -0.4 0.0 1.3
Bang & Olufsen 419 36 0.78 2.2 6.5 7.5 -67 -13 15.6 -1.4 9.3 1.3 1.0
Archer 405 -28 0.66 5.6 5.5 6.3 -32 -37 6.6 3.4 0.0 1.8 Songa Offshore 330 -10 2.34 23.3 20.5 22.5 14 -35 4.5 7.9 0.0 1.5 SSAB 1,667 -19 0.78 9.7 3.9 7.5 61 n.m 6.1 4.9 2.9 4.3 2.1 Stockmann 1,133 1 0.84 5.4 5.1 8.1 -56 -62 13.1 8.5 4.8 3.8 0.9 KappAhl 161 23 0.63 8.9 3.0 6.0 102 n.m 4.3 2.4 2.5 0.0 1.0 BW Offshore 364 -41 2.69 -1.8 14.2 25.9 n.m n.m 37.1 40.4 -2.8 11.0 0.8 Vestas 1,000 31 0.28 2.7 2.7 2.7 1 3 3.7 6.4 8.4 0.0 1.5 Nobia 527 31 0.49 5.2 4.5 4.7 12 -6 3.6 -0.8 3.5 1.5 1.6 Schibsted 3,297 20 1.71 9.5 11.2 16.4 -46 -35 13.7 5.8 5.0 1.8 1.1 D/S Norden 871 -2 0.78 11.4 4.2 7.5 37 -32 3.3 -0.7 9.1 2.7 0.7 New Wave 170 -15 0.75 8.3 7.2 7.3 32 -1 2.7 4.3 4.0 2.3 1.6
Opera Softw are 616 -6 2.57 15.3 23.6 24.7 -35 -4 8.9 36.4 12.1 0.5 0.5
North Atlantic Drilling 1,729 15 4.43 43.2 42.6 n.m 3 8.4 9.5 0.6
Chr. Hansen 3,285 4 4.61 22.3 27.5 44.3 -55 -42 16.3 9.0 2.0 0.3
Petroleum Geo-Services 2,892 37 2.49 19.7 21.9 24.0 -21 -10 6.9 8.8 9.4 1.3 1.1
AarhusKarlshamn 1,244 10 0.73 5.3 6.1 7.0 -32 -18 8.3 7.5 7.8 1.9 0.7
8 1.52 8.5 10.6 14.6 -7 -22 11.9 7.2 5.2 1.8 1.2
Adj. EBIT-m argin (%) Share Pot. (%) Im pl. Sales gr. (%) Adj. EBIT-m argin (%) Share Pot. (%) Im pl. Sales gr. (%)
Source: Handelsbanken Capital markets
5% yield, Beta 1 with
-1.6% implied growth
for this basket
Axfood and MTG
again
Konecranes and
Outotec the capital
goods names
Intrum and AF also
makes the cut
1% yield, Beta 1.2
with 12% implied
growth for this
basket
New Wave, Songa
and NKT value bets
in our Focus list
Christian Hansen in
need of >15%
growth assuming
25% sustainable
margins
AAK now trading in
line with historical
growth rates
Valuation
Valuation multiples have expanded to a point just shy of 15x 12-month trailing EPS. This has pushed the yield
gap vs. bonds down towards 200bp (250bp four months ago), while the earnings yield gap has fallen to around
500bp (700bp). Equities still imply better fortunes relative to bonds, but multiples have normalised relative to
historical averages. This normalisation phase has proven the strongest among value stocks, which have
sharply outperformed the market (up 8-10 p.p. from summer lows). However, the cheapest groupings (EV/S
model and P/BV) have underperformed the market since the QE3 announcement on September 13, potentially
marking the end of normalisation. We continue to argue that value cannot stand alone and needs support from
quality, yield and GARP characteristics.
P/E, 12m forward and 12m trailing
6
8
10
12
14
16
18
20
22
24
26
2002
2003
2004
2005
2006
2007
2008
2009
2010
2011
2012
Next 12 months P/E Last 12 months P/E
Source: FactSet
P/B and ROE, 12m forward
9%
10%
11%
12%
13%
14%
15%
16%
17%
18%
19%
0.8
1.0
1.2
1.4
1.6
1.8
2.0
2.2
2.4
2.6
2.8
2001
2002
2003
2004
2005
2006
2007
2008
2009
2010
2011
2012
Next 12 months Price/Book (L) Next 12 months Return on Equity (R)
Source: FactSet
<15x trailing EPS up
from ~12x in May
Forecast cuts set to
drive further forward
P/E expansion
1.5x BV a touch
below historical
midpoint
Last 12m dividend yield vs. 10-year yield
1.0%
2.0%
3.0%
4.0%
5.0%
6.0%
7.0%
8.0%
2002
2003
2004
2005
2006
2007
2008
2009
2010
2011
2012
Last 12 months Net Div Yield 10-Year Yield
Source: FactSet
Dividend payout, next 12m vs. last 12m
35%
40%
45%
50%
55%
60%
65%
70%
75%
80%
85%
2003
2004
2005
2006
2007
2008
2009
2010
2011
2012
Next 12 months Div. Payout Last 12 months Div. Payout
Source: FactSet
Next 12m EV/sales vs. 12m forward EBIT margin
5%
6%
7%
8%
9%
10%
11%
12%
13%
0.5
0.6
0.7
0.8
0.9
1.0
1.1
1.2
1.3
2001
2002
2003
2004
2005
2006
2007
2008
2009
2010
2011
2012
2013
EV/Sales
EBIT Margin Fwd
Source: FactSet
Dividend yield gap of
~200bp...
...but based on a
payout ratio not seen
since 2003, implying
risk of forecast cuts
>10x forward EBIT,
despite estimate risk
EV/S model 12m forward, top 25
Mcap
(EURm )
Perf
-3m (%)
Hist
Fw d Im plied
Adj.
EV/S
Hist
Fw d
Eniro
96
4
19.3
13.9
8.6
0.90
520
260
EAC
199
-18
7.1
4.9
2.9
0.30
293
142
Auriga Industries
308
28
5.3
8.6
6.1
0.64
-27
77
Haldex
164
2
4.6
6.3
3.9
0.41
22
76
JM
1,148
-2
11.7
12.4
7.0
0.73
65
75
Kongsberg Gruppen
1,788
-1
11.4
11.3
6.0
0.62
75
74
Kvaerner
561
20
3.3
4.4
2.3
0.24
32
67
Cermaq
931
-3
10.9
9.1
5.8
0.61
104
66
Concentric
242
-7
13.3
8.1
0.84
n.m
65
Pandora
1,490
58
36.0
23.4
14.3
1.49
144
60
Bilia
244
-7
1.9
2.1
1.5
0.15
36
56
HiQ
204
-8
16.0
14.5
9.1
0.94
68
53
Ekornes
439
2
16.8
14.9
9.5
0.98
68
51
Duni
314
-1
9.8
11.0
8.1
0.84
26
45
Höganäs
919
0
12.8
15.3
10.9
1.14
18
43
Outotec
1,749
8
7.9
9.1
5.8
0.60
26
41
Veidekke
851
10
3.2
3.8
2.7
0.29
17
41
NCC
1,598
3
4.3
4.0
3.0
0.32
54
40
Golden Ocean
256
5
32.3
34.3
30.3
3.15
19
38
Boliden
3,513
13
13.3
11.3
8.7
0.90
64
37
FLSmidth & Co
2,350
1
8.8
9.6
7.3
0.75
23
35
Leroy Seafood Group
865
7
11.4
10.6
8.5
0.89
46
33
Tieto
962
3
6.5
6.8
5.2
0.54
27
32
TGS-Nopec
2,760
25
44.7
43.1
32.1
3.33
35
31
Transmode
229
-12
13.0
16.6
12.3
1.28
5
29
Adj. EBIT-m argin (%)
Share Pot. (%)
Source: Handelsbanken Capital Markets
EV/S model 12m forward, bottom 25
Mcap
(EURm )
Perf
-3m (%)
Hist
Fw d Im plied
Adj.
EV/S
Hist
Fw d
Stockmann
1,133
1
5.4
5.1
8.1
0.84
-56
-62
CDON Group
317
4
6.0
2.4
4.8
0.49
26
-50
Chr. Hansen
3,285
4
22.3
27.5
44.3
4.61
-55
-42
Rautaruukki
732
3
5.8
3.9
4.8
0.50
45
-42
Archer
405
-28
5.6
5.5
6.3
0.66
-32
-37
Songa Offshore
330
-10
23.3
20.5
22.5
2.34
14
-35
Alk-Abello
509
-3
9.3
7.6
13.0
1.35
-24
-35
Schibsted
3,297
20
9.5
11.2
16.4
1.71
-46
-35
Elekta
3,928
16
16.4
21.5
30.9
3.21
-50
-32
D/S Norden
871
-2
11.4
4.2
7.5
0.78
37
-32
Metsä Board
769
16
1.1
5.1
6.2
0.64
n.m
-31
Lundin Mining
2,283
17
21.0
19.7
27.7
2.88
-20
-24
Net Entertainment
323
0
36.5
31.8
39.6
4.12
-8
-19
Axis
1,323
12
17.0
15.9
19.7
2.04
-13
-19
Simcorp
775
32
23.0
23.5
29.1
3.02
-19
-18
AarhusKarlshamn
1,244
10
5.3
6.1
7.0
0.73
-32
-18
Bang & Olufsen
419
36
2.2
6.5
7.5
0.78
-67
-13
Nibe Industrier
1,370
9
11.8
13.2
14.6
1.51
-24
-12
Holmen
1,806
-3
10.0
9.3
10.2
1.06
-2
-11
Elisa
2,916
9
17.7
19.6
21.4
2.23
-23
-11
Husqvarna
2,244
5
7.7
7.3
7.9
0.82
-4
-10
Petroleum Geo-Services
2,892
37
19.7
21.9
24.0
2.49
-21
-10
DFDS
566
0
6.2
4.8
5.0
0.52
36
-8
Nobia
527
31
5.2
4.5
4.7
0.49
12
-6
Indutrade
864
-8
9.9
9.3
9.6
1.00
4
-4
Adj. EBIT-m argin (%)
Share Pot. (%)
Source: Handelsbanken Capital Markets
High upsides are
harder to find, as
several value names
have performed
strongly
Consumer names
Bilia, Duni and JM
climb rankings
following poor
performance
What’s normalised
profitability in
CDON?
Look for strong
performers with big
downsides as
sources of funding
Schibsted, Simcorp,
Elekta, B&O, Nobia
stand out
EV/S model 12m historical, top 25
Mcap
(EURm )
Perf
-3m (%)
Hist
Fw d Im plied
Adj.
EV/S
Hist
Fw d
Eniro
96
4
19.3
13.9
8.6
0.90
520
260
EAC
199
-18
7.1
4.9
2.9
0.30
293
142
Pandora
1,490
58
36.0
23.4
14.3
1.49
144
60
Cermaq
931
-3
10.9
9.1
5.8
0.61
104
66
KappAhl
161
23
8.9
3.0
6.0
0.63
102
n.m
Lundbeck
2,796
-12
23.2
14.7
12.8
1.33
78
14
Kongsberg Gruppen
1,788
-1
11.4
11.3
6.0
0.62
75
74
HiQ
204
-8
16.0
14.5
9.1
0.94
68
53
Ekornes
439
2
16.8
14.9
9.5
0.98
68
51
JM
1,148
-2
11.7
12.4
7.0
0.73
65
75
Boliden
3,513
13
13.3
11.3
8.7
0.90
64
37
SSAB
1,667
-19
9.7
3.9
7.5
0.78
61
n.m
Securitas
2,124
-8
5.5
4.5
4.0
0.42
57
20
NCC
1,598
3
4.3
4.0
3.0
0.32
54
40
Unibet Group
596
4
29.7
18.5
18.9
1.96
52
-2
Cargotec
1,239
5
6.5
5.5
4.7
0.49
47
20
Leroy Seafood Group
865
7
11.4
10.6
8.5
0.89
46
33
Rautaruukki
732
3
5.8
3.9
4.8
0.50
45
-42
Clas Ohlson
646
-13
10.5
8.7
7.3
0.76
44
19
NKT Holding
656
12
4.8
4.4
3.7
0.39
38
25
D/S Norden
871
-2
11.4
4.2
7.5
0.78
37
-32
DFDS
566
0
6.2
4.8
5.0
0.52
36
-8
Bilia
244
-7
1.9
2.1
1.5
0.15
36
56
TGS-Nopec
2,760
25
44.7
43.1
32.1
3.33
35
31
Kvaerner
561
20
3.3
4.4
2.3
0.24
32
67
Adj. EBIT-m argin (%)
Share Pot. (%)
Source: Handelsbanken Capital Markets
EV/S model 12m historical, bottom 25
Mcap
(EURm )
Perf
-3m (%)
Hist
Fw d Im plied
Adj.
EV/S
Hist
Fw d
Bang & Olufsen
419
36
2.2
6.5
7.5
0.78
-67
-13
Stockmann
1,133
1
5.4
5.1
8.1
0.84
-56
-62
Chr. Hansen
3,285
4
22.3
27.5
44.3
4.61
-55
-42
Elekta
3,928
16
16.4
21.5
30.9
3.21
-50
-32
Schibsted
3,297
20
9.5
11.2
16.4
1.71
-46
-35
Opera Softw are
616
-6
15.3
23.6
24.7
2.57
-35
-4
Archer
405
-28
5.6
5.5
6.3
0.66
-32
-37
AarhusKarlshamn
1,244
10
5.3
6.1
7.0
0.73
-32
-18
Nordic Semiconductor
370
-2
14.9
22.1
22.4
2.33
-31
-1
Royal Unibrew
661
21
10.2
15.3
14.2
1.47
-30
8
Auriga Industries
308
28
5.3
8.6
6.1
0.64
-27
77
Nibe Industrier
1,370
9
11.8
13.2
14.6
1.51
-24
-12
Alk-Abello
509
-3
9.3
7.6
13.0
1.35
-24
-35
Elisa
2,916
9
17.7
19.6
21.4
2.23
-23
-11
Amer Sports
1,209
14
6.1
7.4
7.3
0.76
-22
2
Petroleum Geo-Services
2,892
37
19.7
21.9
24.0
2.49
-21
-10
Lundin Mining
2,283
17
21.0
19.7
27.7
2.88
-20
-24
Tomra
1,013
2
14.6
18.4
17.7
1.84
-20
5
Simcorp
775
32
23.0
23.5
29.1
3.02
-19
-18
Trelleborg
2,287
14
7.6
11.2
9.0
0.94
-17
25
Intrum Justitia
880
-4
20.8
23.2
23.3
2.42
-15
0
Axis
1,323
12
17.0
15.9
19.7
2.04
-13
-19
Atea
804
15
2.2
3.1
2.5
0.26
-12
24
Mekonomen
819
-1
12.1
13.2
13.3
1.38
-11
-1
Net Entertainment
323
0
36.5
31.8
39.6
4.12
-8
-19
Adj. EBIT-m argin (%)
Share Pot. (%)
Source: Handelsbanken Capital Markets
Only ~60% upside in
SSAB at 0.8x sales
when you include the
boom years
Clas Ohlson screens
attractively
NKT could rock if
cables profitability
finally improves
Schibsted appears
immune to estimate
downgrades
Royal Unibrew move
makes it fair on
forecasts
Amer – you have to
believe in 10% target
to find solid upside
Tomra above 1.8x
sales – time for a
breather?
Trelleborg: historical
data includes the
automotive division
15 largest 2013e P/E appreciation, -3m (%)
-20
0
20
40
60
80
SAS
O
ut
ok
um
pu
T
al
v
iv
aar
a M
ini
ng
C
o
V
es
tas
R
aut
ar
uuk
k
i
D
/S
N
or
den
D
N
O
I
nt
er
nat
io
nal
A
S
A
E
n
iro
SSAB
P
andor
a
B
ang &
O
luf
s
en
NK
T
Ho
ld
in
g
Lundi
n M
ini
ng
P
ros
af
e
N
obi
a
P/E 13 change, -3M Price ch, -3M
248
234
193
142
Source: FactSet
15 largest 2013e P/E declines, -3m (%)
-50
-40
-30
-20
-10
0
10
20
A
lm
. B
rand
N
or
s
k
e S
k
og
A
lk
-A
bel
lo
T
rans
m
ode
B
W
Offs
h
o
re
M
oder
n
T
im
es
G
roup
Lundbec
k
Or
ifl
a
m
e
K
ongs
ber
g
G
ruppen
C
las
O
hl
s
on
HiQ
F
LS
m
idt
h
&
C
o
S
we
c
o
AF
-G
roup
Int
rum
J
us
ti
ti
a
P/E 13 change, -3M Price ch, -3M
Source: FactSet
15 highest 2012 dividend yields (%)
5
6
7
8
9
10
11
12
B
W
Offs
h
o
re
No
rt
h
A
tla
n
tic
Dr
illin
g
S
anom
a
E
k
or
nes
A
tea
NCC
F
red.
O
ls
en
E
ner
gy
E
lis
a
HiQ
B
ilia
K
v
aer
ner
Or
ifl
a
m
e
P
eab
S
tor
a E
ns
o
D
uni
Source: FactSet
Estimate cuts behind
the majority of these
moves
Significant multiple
expansion for many
names...
...while consumer
stocks HiQ and
Intrum J. have not
re-rated, though the
contraction is small
15 stocks yielding
>6%
Oil service,
consumer and
construction names
dominate
Payout ratio – top 25
Mcap
(EURm )
Perf
-3m (%)
Pay-out r.
12e %
Div Yield
2012e
Net debt /
EBITDA 12e
Net debt /
Equity 12e
BW Offshore
364
-41
-750
11.0
5.2
1.5
Rautaruukki
732
3
-115
5.7
3.8
0.7
Kvaerner
561
20
140
6.9
-3.5
-0.6
Elisa
2,916
9
100
7.7
1.5
0.9
Ekornes
439
2
95
8.6
-0.8
-0.2
Atea
804
15
93
8.5
0.0
0.0
Axis
1,323
12
92
3.7
-0.6
-0.5
SSAB
1,667
-19
87
4.3
5.2
0.6
DFDS
566
0
87
4.9
2.3
0.4
HiQ
204
-8
85
7.2
-0.8
-0.3
Peab
1,076
-5
81
6.7
3.6
0.9
Stora Enso
3,891
-3
80
6.3
2.5
0.5
Sanoma
1,118
5
77
8.7
2.2
0.7
Oriflame
1,419
-6
77
6.9
1.2
1.0
Nordic Semiconductor
370
-2
77
3.5
-1.2
-0.5
Stockmann
1,133
1
76
3.8
4.4
0.9
Kesko
2,201
12
75
5.0
0.5
0.1
Betsson
802
-17
74
6.1
0.0
0.0
Clas Ohlson
646
-13
73
5.1
-0.1
0.0
Veidekke
851
10
73
5.9
1.0
0.4
NCC
1,598
3
73
7.9
1.6
0.5
Axfood
1,515
10
73
5.0
0.4
0.2
Fred. Olsen Energy
2,322
22
72
7.8
0.8
0.3
North Atlantic Drilling
1,729
15
71
9.5
3.9
2.6
Royal Unibrew
661
21
70
5.1
0.9
0.4
Source: FactSet/Handelsbanken Capital Markets
15 lowest forward P/E
3
4
5
6
7
8
9
E
n
iro
A
llia
n
c
e
O
il
S
onga O
ff
s
hor
e
G
ol
den O
c
ean
S
tor
ebr
and
DNO
Int
er
nat
ional
…
B
W
Offs
h
o
re
N
or
w
egi
an
A
ir
S
hut
tl
e
N
or
ec
o
B
ilia
P
eab
N
ew
W
av
e
N
or
th A
tl
ant
ic
Dr
illin
g
P
andor
a
P
ros
af
e
Source: FactSet
Will steel companies
really pay out as
expected?
Will Peab pay 81%
of EPS given
gearing?
25 stocks with
payouts above 70%
We say the risk of
cuts have increased
The highly-geared
bunch
15 lowest trailing P/E
3
4
5
6
7
8
9
10
E
n
iro
A
llia
n
c
e
O
il
S
onga O
ff
s
hor
e
G
ol
den O
c
ean
No
rt
h
A
tla
n
tic
Dr
illin
g
S
tor
ebr
and
B
ilia
P
andor
a
S
anom
a
N
ew
W
av
e
C
ar
got
ec
F
red.
O
ls
en
E
ner
gy
B
ol
iden
NCC
S
ec
ur
it
as
Source: FactSet
15 highest forward P/E
15
20
25
30
35
40
45
50
55
V
es
tas
T
al
v
iv
aar
a M
ini
ng
C
o
A
lk
-A
bel
lo
SAS
D
/S
N
or
den
R
aut
ar
uuk
k
i
B
ang &
O
luf
s
en
CDO
N G
ro
u
p
E
lek
ta
C
hr
. H
ans
en
S
c
hi
bs
ted
A
xi
s
O
per
a S
of
tw
ar
e
S
im
c
o
rp
K
appA
hl
Source: FactSet
15 lowest 12m forward P/B
0.1
0.2
0.3
0.4
0.5
0.6
0.7
0.8
P
A
R
es
our
c
es
N
or
s
k
e S
k
og
SAS
E
n
iro
S
onga O
ff
s
hor
e
O
ut
ok
um
pu
N
or
ec
o
A
rc
her
V
es
tas
B
W
Offs
h
o
re
SSAB
S
par
N
or
d
EAC
A
lm
. B
rand
G
ol
den O
c
ean
Source: FactSet
If trailing EPS is a
good reflection of
sustainable earnings
then this group is
way too cheap
Still only a handful
above 20x forward
EPS
Steel, P&P, oil,
renewable and
highly-geared oil
service
EV/S relative to EW, top decile
90 100 110 120 130 140 150 160 170 180 190 200 2001 2002 2003 2004 2005 2006 2007 2008 2009 2010 2011 2012 92 94 96 98 100 102 104 Oc t … No v De c … J an … F eb Ma r Ap r Ma y Ju n Ju l Au g Se p Oc t …EV/S relative to EW, bottom decile
20 30 40 50 60 70 80 90 100 110 2001 2002 2003 2004 2005 2006 2007 2008 2009 2010 2011 2012 82 84 86 88 90 92 94 96 98 100 102 Oc t … No v De c … J an … F eb Ma r Ap r Ma y Ju n Ju l Au g Se p Oc t …
Div yielders relative to EW, top decile
90 100 110 120 130 140 150 160 2001 2002 2003 2004 2005 2006 2007 2008 2009 2010 2011 2012 95 100 105 O c t 2011 No v D ec 2011 J an 2012 F eb Ma r Ap r Ma y Ju n Ju l Au g Se p O c t 2012
P/BV relative to EW, bottom decile
60 70 80 90 100 110 120 130 140 150 160 2001 2002 2003 2004 2005 2006 2007 2008 2009 2010 2011 2012 70 75 80 85 90 95 100 105 Oc t … No v De c … J an … F eb Ma r Ap r Ma y Ju n Ju l Au g Se p Oc t …
Source: Handelsbanken Capital Markets, Factset (EW = equally weighted index)
Value rebound
halted when QE3
was announced
Most expensive
decile flat since start
of September
High yielders also
flat in past six weeks
Low-quality value
mirrors normalised
value following QE3
Revisions
Estimates have remained under pressure, with our revision indicators deep in negative territory. We continue
to argue that 2013 estimates look exuberant, given that the prevailing consensus forecasts imply margins
improving 150bp on 3% of top-line growth and that 93% of the universe is expected to post a margin
improvement in 2013. Further, we find earnings dispersion at extremely low levels, signalling confidence in
estimates, in our view falsely. We consequently expect dispersion to widen as we exit the reporting season
and hope that analysts take down 2013e estimates. We maintain that during this process it will be unusually
difficult to find earnings upgrade candidates, while simply betting on the stocks currently seeing the best
revision pattern is too risky. The revision factor (top decile) has in fact been flat since May, though recent
weeks have shown some outperformance. The bottom decile has seen strong alpha generation lately, which
in effect could spell trouble for the entire universe, as downgrades appear to have been punished.
EPS trend (EUR)
14
16
18
20
22
24
26
28
30
Q
4 2009
Q
1 2010
Q
2 2010
Q
3 2010
Q
4 2010
Q
1 2011
Q
2 2011
Q
3 2011
Q
4 2011
Q
1 2012
Q
2 2012
Q
3 2012
Q
4 2012
Earnings Per Share 2011 Earnings Per Share 2012 Earnings Per Share 2013
Source: FactSet
HCMe EPS revision indicator
0.0
0.5
1.0
1.5
2.0
2.5
2002
2003
2004
2005
2006
2007
2008
2009
2010
2011
2012
2013
Nordics < 4bn
neutral
Source: FactSet
Estimates continue
to slide, but 2013e
cuts are not keeping
pace with 2012e
We expect the
revision pattern to
stay negative
EBIT margin outcome vs. expectations
2004
2005
2006
2007
2008
2009
2010
2011
2012
2013
5%
6%
7%
8%
9%
10%
11%
12%
2005
2006
2007
2008
2009
2010
2011
2012
2013
Source: FactSet
Sales growth expectations vs. outcome
2012
2011
2010
2009
2008
2007
2006
2004
2005
2003
2013
-10%
-5%
0%
5%
10%
15%
2004
2005
2006
2007
2008
2009
2010
2011
2012
2013
Source: FactSet
EPS growth trend
0%
5%
10%
15%
20%
25%
30%
H
2 2009
H
1 2010
H
2 2010
H
1 2011
H
2 2011
H
1 2012
H
2 2012
EPS % Change 2012 EPS % Change 2013
Source: FactSet
2013 margins are set
to rise 150bp
2012e margins
below 2011, which
was below 2010
Why is 2013 up
150bp on 3%
top-line growth?
Growth in excess of
5% needed to
sustain >7% EBIT
margin
2013 growth
expectations keep
climbing – now 25%
Dispersion in EPS trend (median of universe)
5%
10%
15%
20%
25%
2001
2002
2003
2004
2005
2006
2007
2008
2009
2010
2011
2012
2013
Nordics < 4bn
Source: FactSet
HCMe sales revision indicator
0.0
0.5
1.0
1.5
2.0
2.5
3.0
3.5
4.0
2002
2003
2004
2005
2006
2007
2008
2009
2010
2011
2012
2013
Nordics < 4bn
neutral
Source: FactSet
Recommendation trend
1.45
1.50
1.55
1.60
1.65
1.70
1.75
1.80
1.85
1.90
2002
2003
2004
2005
2006
2007
2008
2009
2010
2011
2012
Source: FactSet
Rating definition: 1 Buy, 2 Hold, 3 Sell
EPS dispersion at
record lows in an
unusually uncertain
economic setting
As it rises, it gets
harder to find EPS
upgrade candidates
Revision indicator at
depressed levels,
implying a
weakening outlook
Analysts getting
more cautions after
being close to record
bullish this summer
Figure 1: Proportion of companies with EBIT margin improvement
0%
10%
20%
30%
40%
50%
60%
70%
80%
90%
100%
2003
2004
2005
2006
2007
2008
2009
2010
2011
2012e
2013e
Nordic: margin improvement vs. Previous year
Source: FactSet
Bottom 15 2013e EPS revisions, -3m
-80%
-43%
-7%
30%
O
ut
ok
um
pu
T
al
v
iv
aar
a M
ini
ng
C
o
SAS
V
es
tas
SSAB
R
aut
ar
uuk
k
i
D
/S
N
or
den
A
rc
her
B
W
Offs
h
o
re
N
or
ec
o
EAC
E
n
iro
N
ew
W
av
e
A
llia
n
c
e
O
il
NK
T
Ho
ld
in
g
EPS revisions Price change -3M
Source: FactSet
Top 15 2013e EPS revisions, -3m
-10%
0%
10%
20%
30%
40%
50%
N
or
s
k
e S
k
og
A
lm
. B
rand
A
ur
iga I
ndus
tr
ies
A
lk
-A
bel
lo
K
e
m
ira
CDO
N G
ro
u
p
S
im
c
o
rp
AF
-G
roup
Ler
oy
S
eaf
ood G
roup
P
et
rol
eum
G
eo
-S
er
v
ic
es
S
par
N
or
d
N
or
w
egi
an
A
ir
S
hut
tl
e
P
andor
a
R
oy
al
U
ni
br
ew
K
ongs
ber
g
G
ruppen
EPS revisions Price change -3M