CO
2Vapor Liquid Equilibrium (VLE) Data
TESTING
IN
PARR REACTOR USING SYN-GAS
AT
NATIONAL CARBON CAPTURE CENTER (NCCC)
FINAL REPORT
27 December, 2016
Dr Avinash N. Patkar, PE, Mr. Prateek Bumb and Gopi Kiran
Carbon Clean Solutions (CCS) USA
6055 Southard Trace,
Cumming, GA 30040
CONTENTS
1.
Project description
2.
Project goals and accomplishments
3.
Hours and conditions tested
1.
PROJET DESCRIPTION
Carbon Clean Solutions Ltd. (CCSL) has developed a solvent to remove CO2 from acid gases at high
pressure. The objective of the project was to measure the Vapor-Liquid Equilibrium (VLE) at several conditions using bottled CO2 and also using bleed stream from the coal gasification pilot plant at the
National Carbon Capture Consortium (NCCC) located near Wilson, AL. There is a PARR reactor at the site which was used to attain the equilibrium conditions. CCS-USA is a wholly owned subsidiary if CCSL.
2.
PROJECT GOALS AND ACHIEVMENTS
The goals were to:
1) Use bottled gas and obtain the CO2 VLE at various temperatures
2) Use gasifier bleed stream and obtain the CO2 and H2S VLE at various temperatures
3.
HOURS AND CONDITIONS TESTED
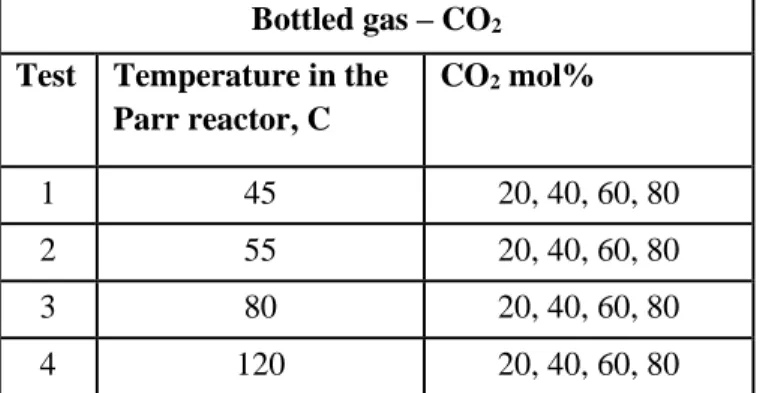
Table 1: Test Conditions for Bottled CO2
Bottled gas – CO2
Test Temperature in the Parr reactor, C CO2 mol% 1 45 20, 40, 60, 80 2 55 20, 40, 60, 80 3 80 20, 40, 60, 80 4 120 20, 40, 60, 80
The test durations were as follows: Test 1 - 25 minutes
Test 2 - 57 minutes Test 3 - 106 minutes Test 4 - 46 minutes Test 5 - 9 minutes
4.
RESULTS AND CONCLUSIONS
4.1 Bottled CO2
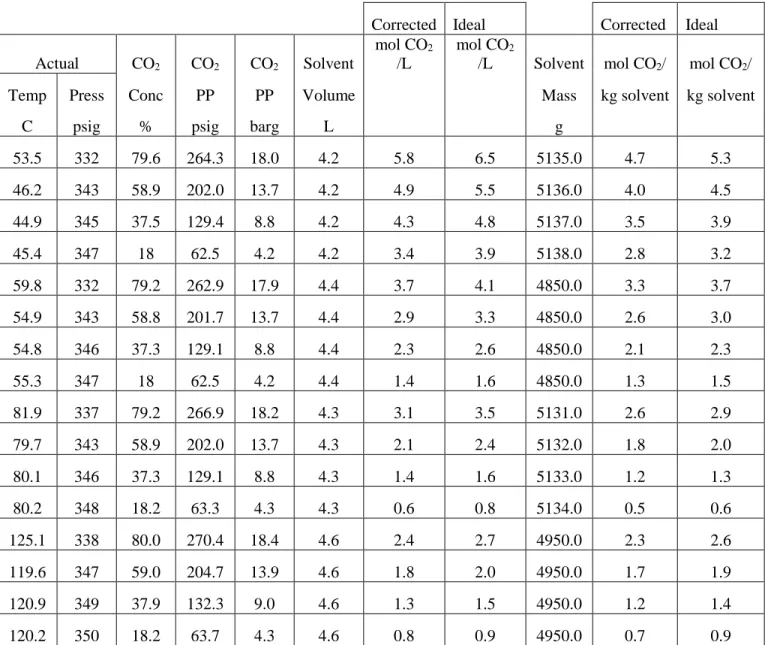
Table 2 gives the results while using bottled CO2.
Table 2: Vapor and Liquid Compositions with Bottled CO2
Corrected Ideal Corrected Ideal Actual CO2 CO2 CO2 Solvent
mol CO2
/L
mol CO2
/L Solvent mol CO2/ mol CO2/
Temp Press Conc PP PP Volume Mass kg solvent kg solvent
C psig % psig barg L g
53.5 332 79.6 264.3 18.0 4.2 5.8 6.5 5135.0 4.7 5.3 46.2 343 58.9 202.0 13.7 4.2 4.9 5.5 5136.0 4.0 4.5 44.9 345 37.5 129.4 8.8 4.2 4.3 4.8 5137.0 3.5 3.9 45.4 347 18 62.5 4.2 4.2 3.4 3.9 5138.0 2.8 3.2 59.8 332 79.2 262.9 17.9 4.4 3.7 4.1 4850.0 3.3 3.7 54.9 343 58.8 201.7 13.7 4.4 2.9 3.3 4850.0 2.6 3.0 54.8 346 37.3 129.1 8.8 4.4 2.3 2.6 4850.0 2.1 2.3 55.3 347 18 62.5 4.2 4.4 1.4 1.6 4850.0 1.3 1.5 81.9 337 79.2 266.9 18.2 4.3 3.1 3.5 5131.0 2.6 2.9 79.7 343 58.9 202.0 13.7 4.3 2.1 2.4 5132.0 1.8 2.0 80.1 346 37.3 129.1 8.8 4.3 1.4 1.6 5133.0 1.2 1.3 80.2 348 18.2 63.3 4.3 4.3 0.6 0.8 5134.0 0.5 0.6 125.1 338 80.0 270.4 18.4 4.6 2.4 2.7 4950.0 2.3 2.6 119.6 347 59.0 204.7 13.9 4.6 1.8 2.0 4950.0 1.7 1.9 120.9 349 37.9 132.3 9.0 4.6 1.3 1.5 4950.0 1.2 1.4 120.2 350 18.2 63.7 4.3 4.6 0.8 0.9 4950.0 0.7 0.9
A: Ideal = Using ideal gas. Corrected= Using compressibility factor for real gas (deviation from ideal ga)
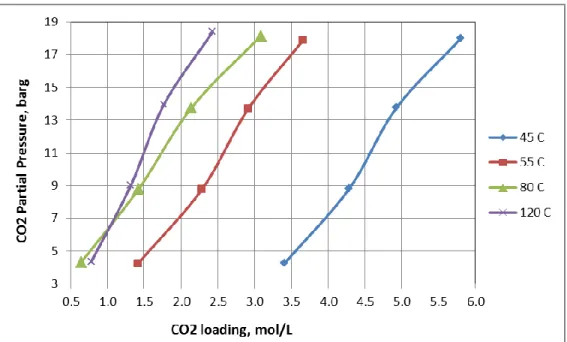
The values of vapor and liquid composition, in equilibrium with each other, at various temperatures, are plotted in Figure 1 below. The CO2 loading was computed using ideal gas law and also with corrections for actual temperature and pressure. The data at 80 C and 120 C are almost identical below the CO2
Figure 1: Results from Bottled Gas
The solvents that are widely used in high pressure applications are activated MDEA (35wt% MDEA+5wt% PZ) and Selexol (which is dimethyl ether of polyethylene glycol (DEPG)). The
objective of testing was to compare the CCSL solvent with activated MDEA and Selexol. Figure 2 below gives the VLE for CCSL solvent, activated MDEA, and DEPG. Data for CCSL solvent obtained at TNO, an European lab, is also plotted. The data shows that CCSL solvent outperforms the existing solvents prevalent in the industry for high pressure applications at 40 C.
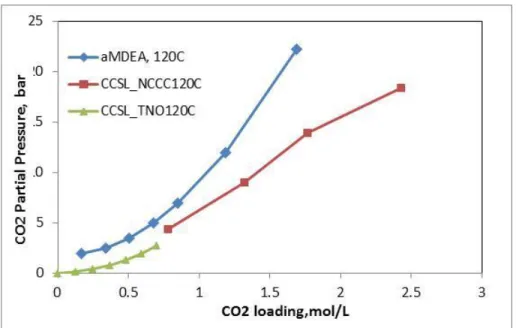
Figure 3: Comparison of VLE data for CCSL solvent and a-MDEA at 120 C
Figure 3 compares the VLE data at 120 C for CCSL solvent at NCCC and a-MDEA (at a lab in India). Data for CCSL solvent, obtained at TNO, is also plotted. It covers the low pressure range. The data for a-MDEA is slightly better than that for CCSL solvent.
4.2 Heat of Reaction
Heat of reaction/absorption is a major contributing factor in the total energy consumption of the CO2 capture process. CCSL estimated the heat of reaction value from the VLE data. These are:
1. Activated MDEA: 48.9 kJ/mol CO2
2. CCSL solvent: 39.2 kJ/mol CO2
It shows that CCSL solvent requires 20% lower energy when compared to activated MDEA.
Table 3: Results with Syngas from Gasification Pilot Plant at NCCC with CCS Solvent Actual CO2 CO2 Solvent Corrected Ideal Corrected Ideal Solvent Corrected Ideal Inlet
H2S
Temp Press Conc PP Volume mol CO2
mol CO2 mol CO2/L mol CO2/L Mass mol CO2/kg solvent Ppmv C Psig % Psig L g 40.4 168 8.7 15.0 4.6 12.7 13.6 2.73 2.93 4895.0 2.6 2.8 1848.7 42.2 169 43.4 73.0 4.4 16.4 18.3 3.73 4.16 4765.0 3.4 3.8 1222.7 46.1 168 21.5 36.0 4.6 15.8 16.3 3.41 3.53 4895.0 3.2 3.3 1457.6 46.6 169 22.2 38.0 4.6 15.8 16.4 3.42 3.54 4950.0 3.2 3.3 1616.4 54.3 164 62.8 103.0 4.4 16.6 18.5 3.78 4.22 4765.0 3.5 3.9 896.6
These data are spread over 5 temperatures with one data at each temperature. Thus, the data cannot be plotted like those in Figures 1 to 3. CCSL was hoping to get H2S absorption data from these
runs. However, the instrumentation at the site, a Gas Chromatograph (GC), had a much longer response time than the reaction of H2S. So, it was not possible to measure absorbed H2S.
4.3Conclusions
1. The VLE for CO2 was measured at four temperatures (Figure 1).
2. Figure 2 shows that, at 40 C and CO2 partial pressures above 5 bar, CCSL solvent is superior
to MDEA. The data from TNO, a lab in Europe, shows that CCSL solvent is better than a-MDEA above 2 Bar at 40 C. Since VLE at partial pressure of CO2 below 2 bar was not
measured, the performance of CCSL solvent could not be compared with that of a-MDEA. 3. Figure 3 provides graphs of VLE data for CCSL solvent at 120 C obtained at NCCC and also
at TNO. For comparison, VLE data for a-MDEA at 120 C collected at a lab in India is also plotted. This plot shows that a-MDEA VLE is slightly better than that of CCSL solvent. It is recommended that the VLE at 120 C be measured for both a-MDEA and CCSL solvent be measured the same facility.
4. As stated above, the absorption of H2S in the CCSL solvent could not be measured at NCCC.
Therefore, H2S VLE data could not be reported. It is recommended that an analytical system