Policy Research Working Paper
5879
Is Optimization an Opportunity?
An Assessment of the Impact of Class Size and School
Size on the Performance of Ukrainian Secondary Schools
Tom Coupé
Anna Olefir
Juan Diego Alonso
The World Bank
Europe and Central Asia Region
Human Development Sector Unit
November 2011
WPS5879
Public Disclosure Authorized
Public Disclosure Authorized
Public Disclosure Authorized
Produced by the Research Support Team
Abstract
The Policy Research Working Paper Series disseminates the findings of work in progress to encourage the exchange of ideas about development issues. An objective of the series is to get the findings out quickly, even if the presentations are less than fully polished. The papers carry the names of the authors and should be cited accordingly. The findings, interpretations, and conclusions expressed in this paper are entirely those of the authors. They do not necessarily represent the views of the International Bank for Reconstruction and Development/World Bank and its affiliated organizations, or those of the Executive Directors of the World Bank or the governments they represent.
Policy Research Working Paper 5879
Using a rich data set of almost the entire population of Ukrainian secondary schools, the authors estimate the effect of school size and class size on the performance of secondary schools on Ukraine’s External Independent Test. They find that larger schools tend to have somewhat better performance, both in terms of test scores and
This paper is a product of the Human Development Sector Unit, Europe and Central Asia Region. It is part of a larger effort by the World Bank to provide open access to its research and make a contribution to development policy discussions around the world. Policy Research Working Papers are also posted on the Web at http://econ.worldbank.org. The authors may be contacted at aolefir@worldbank.org.
in terms of test participation. The size of this effect is relatively small, however, especially in rural areas for which the estimates are likely to be more clean estimates. Class size is found to be insignificant in most specifications and, if significant, of negligible size.
Is Optimization an Opportunity?
An Assessment of the Impact of Class Size and School Size
on the Performance of Ukrainian Secondary Schools
Tom Coupé
Anna Olefir
Juan Diego Alonso
1Human Development Sector Unit Europe and Central Asia Regions
JEL classification: I28, I29
Key words: Secondary Education, Inputs, Performance, Optimization, Class Size, School Size, Quality of Education
1 Tom Coupé, Associate Professor, Kyiv School of Economics (KSE); Senior Economist, Kyiv Economics Institute
(KEI), World Bank Consultant; Anna Olefir, Economist, World Bank Consultant, ECA Human Development Sector Unit, Juan Diego Alonso, Education Economist ECA Human Development Sector Unit.
2
I.
Introduction
The substantial positive returns to education for both individuals (e.g. Psacharopoulos and Patrinos, 2004) and countries (e.g. Barro and Lee, 2010) are a fairly established fact in the literature of the economics of education. It comes as no surprise, then, that policy makers and academicians are so interested in understanding the factors that can influence the quantity and quality of education.
While the academic literature on these factors is vast, most of it focuses on developed countries, and while there is some literature on developing countries, only recently have studies using data from countries in Eastern Europe and the Former Soviet Union (henceforth, transition countries) started to appear. The recent surge in this literature can be explained by the fact that performance measures for these countries have become available, both through the participation of these countries in international assessments of student learning like the Organisation for Economic Cooperation and Development (OECD)‟s Programme for International Assessment (PISA), the Trends in International Mathematics and Science Survey (TIMSS) and Progress in International Reading Literacy Survey (PIRLS), and through the introduction of centralized nation-wide assessments in several transition countries.
In terms of the development of their educational systems, transition countries may be considered to lie somewhere between developed and developing ones. Transition countries typically have had mandatory basic education and enjoy very high levels of school attendance. As a result, so the issue is not how to get children to attend school, as it is in a big part of the developing world. Instead, transition countries face the challenge of how to modernize and reform their educational system so as to provide quality education at an affordable price.
One possible opportunity to realize such quality enhancing reforms might come from taking advantage of the so-called “demographic dividend”, i.e. the sizeable demographic changes that took place in most of the transition countries, especially in the last 20 years. In fact, after the fall of the Soviet Union, transition countries have faced an unprecedented demographic shock, with increasing mortality and emigration, but also with a serious drop in fertility. This negative shock to fertility has translated in an increasingly smaller number of school-aged children, considerably reducing school size and class size over time (Berryman, 2000). In addition, given that this drop
3
in children of school age did not go together with a decline of the number of schools, teachers or classes, student-teacher ratios and the size of schools and classes has decreased substantially. As a consequence, transition countries are now in the situation where they have a disproportionately large number of schools, teachers and classes. And this oversized system does not appear to have led to an improvement in the quality of education.
Many transition governments are now facing the question of what to do with these oversized systems, often characterized by a multitude of very small schools and very small classes within schools. From a budgetary point of view, many governments would like to merge small schools, as the budgetary burden of one big school with many students is typically smaller than the budgetary burden of having a network of many small schools with few students each. Similarly, consolidating classes within schools appears as an attractive option to generate some savings that could then, at least partially, be reinvested in increasing the skills and performance of the remaining schools, classes and teachers, presumably leading to quality improvements in the educational system.
In several transition countries, this consolidation movement is already ongoing2. Kuddo (2009) describes the process in Armenia, Kallai and Manui (2004) in Romania, Herrmann (2005) in Hungary, the World Bank (2010) in Bulgaria, McGuinness et al (2001) in Estonia, Hazans (2010) in Latvia, and Berdashkevich and Vlasov (2010) in Russia.
The Government of Ukraine is progressively coming to the understanding that school network optimization should be a key issue on any education reform agenda in the coming years in Ukraine3. Optimization of the school network is also among the key steps for reforms in the
2 Throughout this document, the terms “optimization”, “consolidation” and “rationalization” are used
interchangeably. In all cases, they refer to the territorial reorganization of the school network in a way that could better use the available resources in the system maximizing the installed capacity of current institutions. Since the system is overly underutilized, the optimization/consolidation/rationalization of the school network would entail the closing of classes and schools and the merging/reallocation of students in those classes and schools to the best available option within the nearby institution. This may also require some degree of transportation of students.
3 The dialogue on the optimization of the school network in the framework of Bank-supported „Equal Access to
Quality Education‟ lending project started to materialize in 2007 when the line Ministry defined the pilot oblasts (Order №571 of August 16, 2007). Since then the project lead to several successful school closures in selected six pilot rural districts - seven schools were closed and eight schools stopped functioning without obtaining official status of closed institutions. Of course, optimization activities were limited to a few pilots, thus its impact in the overall education system is negligible. Nevertheless, close to its end the project supported a number of important activities that created basic conditions for further consolidation in pilots in the near future through necessary investments like school buses, school labs and textbooks for hub schools, training of school directors and teachers
4
education sector according to the Presidential Economic Reforms Program for 2010-2014 „Prosperous society, competitive economy, effective government‟4
. Also the „launch of optimization‟ of the school network is envisaged by the Ukraine‟s Budget Declaration for 2011 which was approved on April 19, 2010. Schools are planned to be closed if they:
have less than 10 students and only offer grades 1-4 (level I schools); have less than 40 students and only offer grades 1-9 (level I-II schools); have less than 100 students and offer all grades (1-11/12, level I-III schools)5.
School size is thus used as the key decision criterion to close schools. Given that pupils of closed schools will be reallocated to other schools, the remaining schools will see an increase in size and most likely will have the size of their classes increase. Also the Budget Declaration 2011 set to revise the school norms that influence the amount and type of staff to be hired.
In this paper, we attempt to study what the impact of school size and class size are on the performance of schools in Ukraine, using data on educational performance from Ukraine‟s Independent External Test and data on educational inputs from the Ukrainian Ministry of Education, Youth, Sports and Science. The paper is intended as a key input in the discussions around the optimization or consolidation of the network of schools in Ukraine that has been ongoing for some time now.
In Section II, we first review the academic literature on the determinants of educational performance with a particular emphasis on the evidence that links class size and school size to educational outcomes. Section III portrays a picture of Ukraine‟s educational system, again with an emphasis on size of schools and classes. Section IV provides a detailed description of the data used in this study and how the database was assembled. It is the core of the paper and presents our estimates of class size and school size effects within the „educational production functions‟ of Ukraine. Section V, finally, summarizes the main messages and policy conclusions from this empirical study.
and stimulated optimization discussions and work in non-pilots. While such activities created conditions for modernization of the education, the larger, more comprehensive reform and completion of the consolidation exercise remains to be implemented.
4
However, there are still signs of a push-back from the Government‟s original initiative due to fierce local opposition to school closures.
5 The system was undergoing transformation to 12-years of schooling (with experiment already in place in some
5
II.
Literature Review
In this section, we start by providing a short overview of the findings of the literature on school size and class size effects for both developed and developing countries. Then we zoom in on
transition countries, first reviewing those cross-country studies that include transition countries,
and after that focusing on studies that use data for specific transition countries.
II.1 The evidence from developed and developing countries
There are several reviews of the literature on the determinants of educational performance, both internationally (Hanushek & Woessman, 2010) and focusing on developing countries (Glewwe (2002) and Glewwe & Kremer (2005))6. Some of these reviews have focused specifically on the effects of school size and class size. Ahn and Brewer (2009, p.426) for example summarize the channels through which class size can matter as follows:
teachers report less stress and dissatisfaction with working conditions teachers may have more time for individual attention
student motivation may increase leading to better learning behavioral and class management issues are less frequent
achievement scores in grades K-3 improves for students exposed to classes of 17 or less achievement gains increase with longer exposure to small classes in grades K-3
achievement gains are seen for historically underserved and disadvantaged student populations in grades K-3
Reviewing studies for OECD countries, Vignoles et al (2000) conclude that:
1. The impact of class size is mostly insignificant, and where it is significant, the effect is too small to justify expenditures for class size reduction.
2. Interaction effects of class size with other factors (students‟ abilities, school type, teachers‟ actions) have been found to be significant suggesting that class size can affect specific groups of students.
6 Two general messages emerge clearly from these reviews. The first one is that methodologically, it is very hard to
obtain pure unbiased estimates of the impact of specific determinants on education quality; most studies, including ours, are plagued by issues like selection effects and endogeneity, and experimental studies are rare. The second is that the vast amount of studies on inputs gives a mixed picture, with many studies showing an impact but also many studies finding insignificant effects.
6
In line with this, Lazear (1999) shows that smaller classes substitute for better discipline – more specific, students of Catholic schools have better school achievements in larger classes. Babcock and Betts (2009) demonstrate that low-effort students lose more from class size increases as they require more attention of their teachers. Wößmann and West (2002), using a sample of 18 developed countries, find that for most countries class size has an insignificant impact on student performance. However, in Iceland and Greece reduced class size does seem to positively influence TiMSS scores, which they explain by the lower quality of teachers in these countries – teachers there have relatively lower salaries and qualifications.
The arguments in favor of school size are similar to those in favor of small classes – smaller schools are more „personalized‟, can have more „adaptive‟ pedagogy and will involve parents more. On the other hand, bigger schools could exploit economies of scale and hence provide better quality for a given level of inputs.
Garrett et al (2004) provide an extensive review of school size literature based on the United States (US) and the United Kingdom (UK) data. Their review suggests an inverted-U relation between school size and student exam scores, though larger schools are typically found to be more cost-efficient. They also point out that teacher and student perceptions of school climate decline7 and some kinds of violent behavior8 may increase with school size.
More recently, focusing on the US and Canada, Leithwood and Jantzi (2009) conclude that smaller schools mostly benefit younger students and those with a disadvantaged social and economic background. They state that “elementary schools with large proportions of such students should be limited in size to not more than about 300 students; those serving economically and socially heterogeneous or relatively advantaged students should be limited in size to about 500 students. Secondary schools serving exclusively or largely diverse and/or disadvantaged students should be limited in size to about 600 students or fewer, while those secondary schools serving economically and socially heterogeneous or relatively advantaged students should be limited in size to about 1,000 students (p.1).”
7 E.g. parental involvement into school matters decline with school size – Walsh (2010).
8 For example, Leung and Ferris (2008) use Canadian data to show that that a student attending a school with more
7
Consistent with this, Berry and West (2005), using US data, find a negative effect on future earnings of both a higher school size and a higher pupil-teacher ratio.
The abovementioned studies focus on the estimation of educational production functions where educational performance is the variable to be explained. Other studies estimate educational cost functions, in which educational performance is used as an explanatory variable. Studies that use this approach tend to find that existing schools are smaller than optimal (Kenny 1982, Smet 2001, Stiefel et al. 2009). But also among these studies there is no clear consensus on the optimal school size. For example, a review of US-based studies by Andrews et al. (2002) suggests that 500-600 students may be an optimal size, although there is no consistent evidence of either increasing or decreasing returns to scale. As far as developing countries are concerned, Hanusek (1995) summarizes the literature on the effect of class size in developing countries as follows: “The evidence provides no support for policies to reduce class size. Of the thirty studies investigating teacher-pupil ratios, only eight find statistically significant results supporting smaller classes; an equal number are significant but have the opposite sign; and almost half are statistically insignificant. These findings qualitatively duplicate those in the U.S. studies, but are particularly interesting here. Class sizes in the developing-country studies are considerably more varied than those in the U.S. studies and thus pertain to a wider set of environments, providing even stronger evidence that the enthusiasm for policies to reduce class size is misplaced (p.231)”. More recent studies confirm the mixed evidence: Urquiola (2006) finds a negative effect of class size on student performance in Bolivia, while Niaz Asadullah (2005) finds the opposite for Bangladesh. And in a recent review, Hanusek and Woessman (2007, p.66) conclude that “The lack of substantial resource effects in general, and class-size effects in particular, has been found across the developing world, including Africa (…), Latin America (…) and East Asia (…)”. There are only few studies that focus on school size in developing countries. Duflo et al (2009) included school size as one of the explanatory variables into an educational production function for Kenyan schools, and find in some specifications a small negative effect. Liu et al (2009) estimate the effect of a primary school merger policy conducted in rural China. Within this policy about 25,000 rural primary schools a year were closed between 2001 and 2005. They conclude that mergers were beneficial for the school performance of older students (4th grade) and worsened the results of younger (1st grade) students.
8
One study studies the effect of school size on student performance using TiMMS data for both developed and developing countries: Schütz (2006) finds significant size effects for 11 out of 51 countries, 8 out of these 11 are developing countries. Most of these significant effects are positive, suggesting that, if there is a relationship between size and performance, bigger schools appear to be typically better.
II.2 The evidence from transition countries9
The literature on schools in transition countries is much less developed than the literature on either schools in developed countries or schools in developing countries. This paper is indeed the first that tries to summarize the existing literature on schools in transition countries. We divide what follows into two parts: we first focus on the cross-country studies that include transition countries. Next, we focus on single-country studies.
a. Cross-country studies
There is a number of studies that do include data from transition countries, even though they do not focus on transition countries or have specific conclusions based on the estimations they obtain for transition countries.
Hanushek and Luque (2002) and Hanushek (2003), reviewing a hundred production function estimates covering 37 developed and developing countries10, state that there is no consistent evidence that more school resources and better teacher quality lead to better test results, since in the majority of studies these variables are found to be insignificant. Despite this, studies for developing countries find some positive relationship in a greater share of cases11 (possibly because the initial level of education spending matters). Class size is most often found to be insignificant, but for transition countries, if significant typically positive. These authors
9 Table A1 and A2 in the appendix summarize the empirical findings of education-relevant factors in transition
countries, and in developed and developing countries.
10 Among them eight transition economies: Hungary, Latvia, Lithuania, Poland, Slovak Republic, Czech Republic,
Romania and the Russian Federation.
11 In another review article, Heyneman and Loxley (1983) suggest that school and teacher quality matters more for
lower-income countries than for high-income ones. At the same time, family background matters for these countries less.
9
recommend that rather than focusing on inputs, the focus should shift to other policies, including giving right incentives for teachers, and increasing school competition.
The importance of incentives is confirmed by a study of Woessman (2003) who estimated an education production function based on student-level data for 260 000 students from 39 developed and developing countries12. He finds that school autonomy (teacher incentives) and centrally controlled examinations (student incentives) do positively and significantly influence educational performance. He does not consider the school size variable, however, while higher class size has a positive effect on education outcomes.
There is one cross country study that focuses on transition countries. Ammermuller et al (2003) estimate an education production function for seven Eastern European countries (excluding Russia) using the TiMMS 2003 wave. Their study finds that class size has a positive influence on
test scores, only if one does not control for selection effects. Once selection effects are controlled
for the coefficient of class size becomes insignificant. Other included school characteristics, such as shortage of materials and measures of teacher and school autonomy were also found to be insignificant in most cases.
b. Single-country studies13
Single transition countries studies so far focus on the Central European countries with, as far as we could find, no evidence being available about countries which belong to the Commonwealth of Independent States (CIS).
Three studies use Polish data to study the determinants of educational performance. Herczynski and Herbst (2005) find a small positive effect of class size. They also find that increased school choice improves achievement but only up to a certain threshold, after which the opposite effect takes place. Bukowska and Siwińska-Gorzelak (2011) find a significantly positive effect of
school size in almost all their specifications. They also find a positive influence of school
competition (and accordingly a negative effect of the Herfindahl index) on students‟ test scores.
12 This country included the same eight transition countries as the previous ones – the countries for which TIMSS
data were available.
10
Finally, Jakubovsky and Sakowski (2006) find a small positive effect of school size and an inverse u-shaped effect of class size.
Kallai and Maniu (2004) estimate educational production functions for Romania. They found a
positive effect of school size but no effect of class size on students’ test scores. Porta (2011) using
PISA data for Romania also finds that the smallest schools (first quintile) perform less well than
bigger schools, but that the size of this effect is small and significant only for reading scores. A
similar study for Serbia (MacDonald et al, 2009) found similar small but significant effects for
reading, math and science scores. Hermann (2004b) finds a negative effect of primary school
size on the likelihood to entering a better secondary school in Hungary.
Summarizing, the large literature on the effects of class size and school size suggest that while class and school size might have an effect, these effects are unlikely to be large. For transition countries, school size, however, appears to be more significant than class size as a determinant of educational performance and, increasing school size appears to be, if any, beneficial for educational performance. At the same time, the literature also suggests that effects vary from one country to another, pointing to the need for more country-specific studies.
III.
The Educational System of Ukraine - Some Background
In Ukraine the state is the main provider of education services, at all levels including general secondary education14 (GSE). Public schools constitute 99 percent of general secondary institutions educating more than 99.5 percent of students. According to the data of the State Statistics Service of Ukraine the school network in the 2009/2010 school year consisted of 20.368 institutions: 2.177 level I schools (grades 1-4); 5.397 level I-II schools (grades 1-9); 12.312 level I-III schools (grades 1-12) 15; 82 level II-III schools; 389 special schools for children with disabilities (boarding schools) and 11 schools of social rehabilitation. Schools for „talented‟ students include 588 gymnasiums 386 lyceums 46 collegiums as well as the so called „specialized‟ schools with more in-depth training in particular subjects.
14 In Ukraine general secondary education encompasses primary and secondary education. 15 Including gymnasiums, lyceums and collegiums.
11
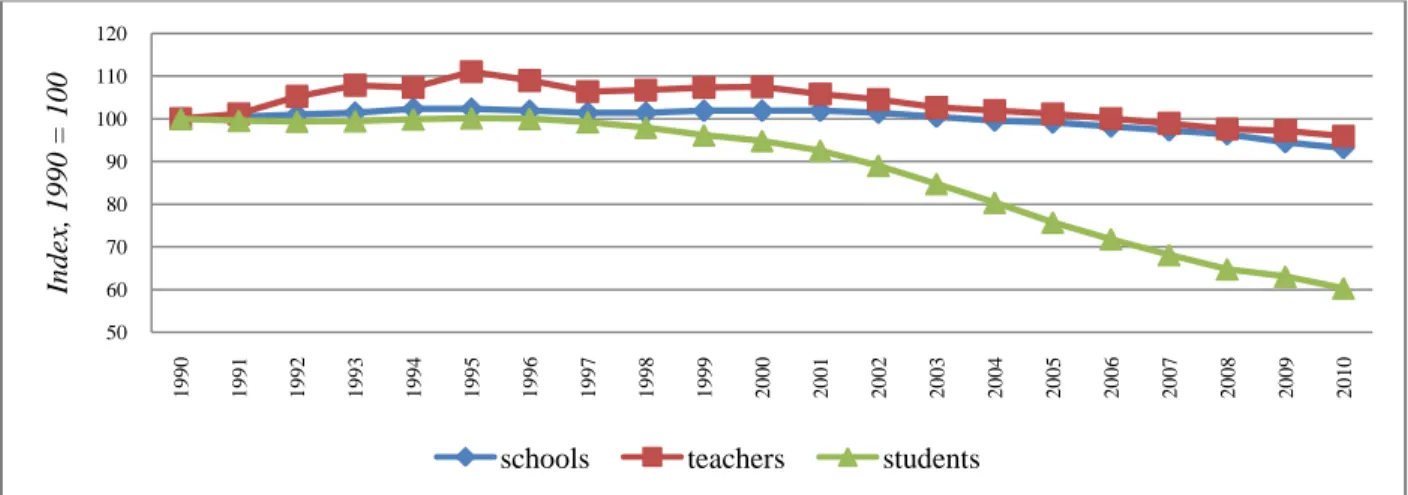
Consolidating the network of general secondary education (GSE) schools has become an ever urging issue in Ukraine considering the demographic and financial situation in the country. Due to the demographic crisis the number of students in Ukrainian schools fell by 40 percent since independence while the number of schools only fell by 7 percent and the number of teachers by only 4 percent16. As a consequence, Ukraine is maintaining a large network of small schools that have become smaller and smaller because of the severe drop in birth rates: 30 percent of level I schools have less than 10 students 21 percent of level I-II schools - less than 40 students; 17 percent of level I-III schools - less than 100 students17. Overall 19.2 percent of schools are small as defined above and its overwhelming majority is located in rural areas. As a result budget resources while increasing over time mainly support the large network of institutions rather than being directed towards quality-enhancing inputs18.
Figure 1: Trends in number of students teachers and schools in GSE in Ukraine 1990-2010
16 Around 510 thousand teachers work in the sector with 4.2 million students (compared to 537 thousand teachers
and 7.1 million students in 1990/1991 school year).
17 World Bank calculations based on a school-level database compiled on the basis of information provided by each
of the oblasts and related jurisdictions for the 2009/2010 school year.
18 See for details the Ukraine Public Finance Review (phase II) in FY 2007-08. Currently education sector
expenditures account for almost a quarter of consolidated budget (24.8 percent in 2010) and 7.1 percent of GDP. In 2010, expenditures from the consolidated budget for education reached UAH 77.9 billion - a ten-time increase over the 2000 level. This increase exceeded the growth rate of the nominal amount of expenditures of the consolidated budget for these years which multiplied 6.5 times. The bulk of the consolidated budget is earmarked for salaries and utilities which are mainly intended to maintain budgetary institutions and thus crowd out other expenditures. At the same time wages in education remain lower than in many other sectors of the economy including manufacturing, transport, communications, financial services, retailing, etc. In Bulgaria, for example, resources saved thanks to consolidation of schools allowed to increase wages in the education sector by 46 percent between 2006 and 2008. Efficiency gains allowed also allocation of more resources for capital investment within the sector (http://www.worldbank.bg/WBSITE/EXTERNAL/COUNTRIES/ECAEXT/BULGARIAEXTN/0,,contentMDK:226 99182~menuPK:305444~pagePK:2865066~piPK:2865079~theSitePK:305439,00.html). 50 60 70 80 90 100 110 120 1990 1991 1992 1993 1994 1995 1996 1997 1998 1999 2000 2001 2002 2003 2004 2005 2006 2007 2008 2009 2010 In d ex , 1 9 9 0 = 1 0 0
12
As a result of demographic decline the average school size dropped by one-third from 326.8 students per school back in 1990/1991 to 211.8 in 2010/2011 school year. Interestingly, the slump was most dramatic in urban areas where school size almost halved over the last two decades compared to a 27 percent decline in rural schools. While in 1990/1991 urban schools were about 5 times larger than rural schools, this ratio has decreased to about 4.
Class-size has also been steadily decreasing and reached 18.1 students per class (23.2 – in urban areas and 12.5 – in rural areas)19.
In this paper, we investigate school-size and class-size effects on school performance in Ukraine using schools‟ graduates in Ukraine‟s External Independent Test (EIT)20
. It is important to note that this test only covers part of the graduates of secondary schools.
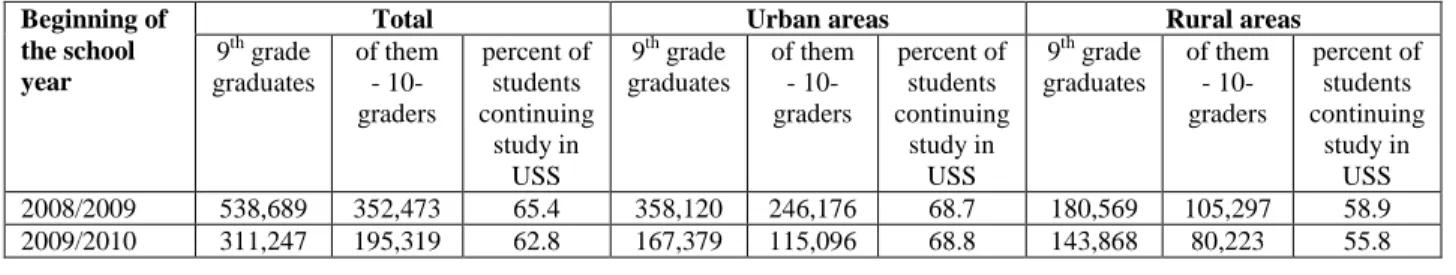
The EIT exams are only taken by upper secondary education graduates (grades 11-12), so we miss around 40 percent of lower secondary school graduates in urban areas and almost 50 percent in rural areas (see table 1). Most of them leave for vocational schools as an ultimate goal or as the transit route to the higher education institutions and thus omit the EIT exams. The share of students leaving after the 9th grade significantly increased over the last three years which is likely to be the combination of EIT effect and expected enforcement of the three year study in the upper secondary school that was envisaged until mid-2010. Thus, parents and students tried to avoid an extra year in the secondary school and to profit from the opportunity to get into the HEIs through the vocational schools (in some cases – with direct admission to the second or third year of study).
Table 1: Number of students that continue study in upper secondary daily schools
Beginning of the school year
Total Urban areas Rural areas
9th grade graduates of them - 10-graders percent of students continuing study in USS 9th grade graduates of them - 10-graders percent of students continuing study in USS 9th grade graduates of them - 10-graders percent of students continuing study in USS 2008/2009 538,689 352,473 65.4 358,120 246,176 68.7 180,569 105,297 58.9 2009/2010 311,247 195,319 62.8 167,379 115,096 68.8 143,868 80,223 55.8
19 The Law of Ukraine on General Secondary Education (Article 14) limits the class size to a maximum of 30
students and when there are less than 5 students in the schools in rural areas the individual training should apply to ensure quality. Classes may be split into groups for teaching particular subjects. Number of students in special schools (boarding schools) is defined by the Ministry of education and science, youth and sports of Ukraine by agreement with the Ministry of Health of Ukraine and the Ministry of Finance.
13
2010/2011 559,477 31,7099 56.7 37,1977 22,2072 59.7 187,500 95,027 50.7 Average for
three-year
period - - 61.4 - - 65.0 - - 54.8 Source: State Statistics Service of Ukraine statistics bulletins on general secondary institutions in the relevant years.
The EIT exams are only taken by those students who are interested in pursuing studies at the university level. For example, in 2009 84 percent of graduates participated in EIT in Ukrainian language and literature and in 2010 – 78 percent. A smaller number of students participate in the EIT in Ukrainian history, math and English (table 2).
Table 2: Participation of Ukrainian schools graduates in EIT in 2009-2010
School Years Upper secondary education graduates (grades 11-12) Participants of EIT (Ukrainian language and literature) Share, % of graduates Participants of EIT in (history of Ukraine) Share, % Participants of EIT in (Math) Share, % Participants of EIT in (English) Share, % 2009 391,257 329,839 84.0 215,080 55.0 175,493 44.9 70,315 18.0 2010 363,751 284,550 78.0 133,549 34.1 183,682 46.9 46,678 11.9 Source: based on State Statistics Service of Ukraine statistics bulletins on general secondary institutions in the relevant years and official EITs reports of the Ukrainian Centre for Education Quality Monitoring.
EIT is the main but not the only way for entering the higher education system. According to the Ministry of Education and Science of Ukraine in 2008 overall 91.2% of students were admitted to the higher education institutions of ІІІ-ІV level of accreditation on the basis of the EIT certificates21.
So far there has been little analysis of the EIT data. Besides the simple descriptive statistics in the annual EIT report, there are three studies that use EIT data. Kovtunets et al (undated) provide some analysis of whether the EIT exam results predict performance during the first year at university. Muravyev and Talavera (2010) use the EIT to see how an announced (but not implemented) language policy change has affected the subject choice and performance of students at minority language schools. The closest to the current paper is Coupé et al (2010) who use a sample of 300 schools to link EIT scores to a wide set of input variables. They find a
21
Analytical note on results of the admission campaign in 2008 and major tasks for the organization of the
admission process in 2009 (Annex to the decision of the board of the Ministry of Education and Science of Ukraine of 31.10.2008 № 12/2-4). Some of the tests were not developed in 2008 therefore the exams were conducted. For example, tests in foreign languages – English, German, French and Spanish languages – were introduced in 2009. Other changes encompassed, for example, wider choice for participants (up to 5 subjects instead of only up to 3 in 2008) with reduced number of available subjects for testing (8 disciplines instead of 11).
14
positive effect of school size and no effect of class size. The current paper extends that analysis by drawing on a much bigger sample of thousands of Ukrainian schools. The size of the current dataset not only provides for more precise estimates but also allows for the analysis of more precise questions, like an analysis by gender or by type of settlement. In addition, the current dataset allows us to analyze the Ukrainian plan to close schools with less than 100 students.
IV.
Data and Analysis
In this paper, we use several datasets which were matched and combined into one comprehensive dataset. From the Ministry of Education, we obtained data, for all Ukrainian schools, on the total number of students, the number of students by grade, the number of classes by grade and the total number of teachers and staff.
Data about performance on the EIT were obtained from the yearly public data files, posted on the EIT site, which provide, for each school, the distribution of students‟ scores over 10 intervals. In addition, from the Ukrainian Centre for Education Quality Monitoring we obtained mean and median scores data and information about the gender and the language choice of students22.
A more detailed description of these sources and the matching process can be found in the appendix A1.
a. Descriptive Statistics for 201023
For 11683 Ukrainian schools we have information on both 2010 EIT test scores (from the EIT database) and information on input variables (from the Ministry of Education).
Given that our main variables of interest, school size and class size, but also other input variables are very different depending on whether or not the school is located in an urban or rural area, we provide the descriptive statistics for rural and urban schools separately.
22 The correspondence between those two sources of data was high but not perfect. For a few schools, we had no
mean scores and for somewhat more schools the total number of students according to the two databases was not equal, though such deviations were typically very small. One possible explanation for these differences is that the database of the Ministry‟s EIT Center is updated, f.e. correcting mistakes or including the results of appeals.
23 The descriptive statistics for 2008 and 2009 give a qualitatively similar picture. Note that in this section we will
15
For the descriptive statistics, we also focus on the most common type of schools, the 10361 „ordinary‟ schools24
, to avoid mixing the effect of size and school type.
We further restrict our sample to those ordinary schools for which we have a complete set of „credible‟ information, that is, they have scores on the Ukrainian exam, do have teachers and students, have a student-teacher ratio less than 50 and a class size less than 3525.
To illustrate the effect of school size and class size we divide the samples of rural and urban schools, into four intervals, each interval having approximately about a quarter of the observations. School size is measured by the total number of students at the school, class size is measured by the number of students in the final grade divided by the number of final grade classes (for a vast majority of schools this is the 11th grade, for some it is the 12th grade).
We use several indicators of school performance
the mean score the median score
the percentage of students scoring above 173 the percentage of students scoring above 150 the percentage of students score below 135.5
we also compute a „student participation ratio‟, that is, for those schools which have students that take the exam on a specific subject, we compute the ratio of students who take the exam divided by the total number of students in the highest grade26.
We also provide summary statistics for the explanatory variables we will use. We have two more measures of school inputs.
Student-teacher ratio – the total number of students in the school divided by the total number of teachers in the school (these numbers are based on headcounts, not full time equivalents).
24 We do exclude „ordinary‟ evening schools. For the regression analysis below, however, we do include all types of
schools, controlling for differences through type-specific dummies.
25
We lose about 5 % of the schools by doing this, mainly rural schools.
26 We have this indicator for those schools that we were able to match to the MoE database. For some schools, we
clearly have unrealistic participation ratios. We keep them in the sample here but will exclude these schools in further analysis – see below for details.
16
Student-staff ratio - the total number of students in the school divided by the total number of teachers and non-teaching staff in the school (these numbers are based on headcounts, not full time equivalents).
We also have two measures of the group composition of the exam takers of each school.
Language – the percentage of EIT exams (other than the Ukrainian exam) taken in Ukrainian. Note that this reflects the language choice of the students taking the test and hence can differ from the language choice of the whole class.
Gender Composition – the share of boys among those taking the EIT exam. As not all students take the exam, this can differ from the share of boys in the class.
And we have two measures of the economic situation in the area (rayon) where the school is located.
The unemployment rate at the end of 2009. The average wage at the end of 2009.
Finally, we have one measure at the level of the village where the school is located, that control for the possibility that bigger villages can have both bigger schools (because they have a bigger population) and better schools (because better teachers or „better‟ parents might move to bigger villages with more amenities).
The population in the village where the school is located based on the 2001 population survey. For the big cities, we typically have population data for the district where the school is located.
17
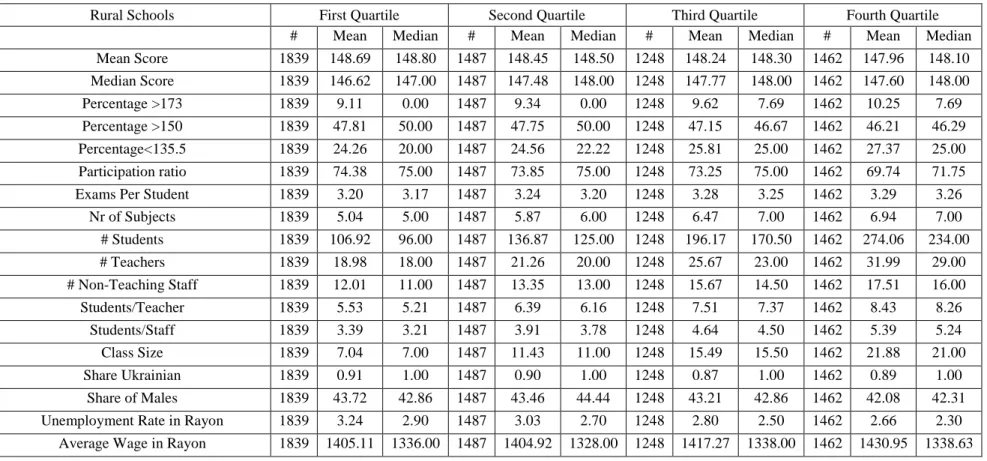
Table 3a. Descriptive statistics for rural schools, by school size quartiles
Rural Schools First Quartile Second Quartile Third Quartile Fourth Quartile # Mean Median # Mean Median # Mean Median # Mean Median Mean Score 1529 148.83 148.80 1495 148.28 148.40 1514 148.65 148.50 1498 147.68 147.80 Median Score 1529 146.98 147.00 1495 147.12 147.00 1514 147.77 148.00 1498 147.36 148.00 Percentage >173 1529 8.97 0.00 1495 9.08 0.00 1514 10.02 7.14 1498 10.12 7.69 Percentage >150 1529 48.41 50.00 1495 46.71 46.15 1514 48.23 50.00 1498 45.69 46.15 Percentage<135.5 1529 23.60 20.00 1495 25.36 23.81 1514 24.92 23.08 1498 27.79 25.93 Participation Ratio 1529 69.85 70.00 1495 73.91 75.00 1514 73.30 75.00 1498 74.57 74.46 Exams Per Student 1529 3.21 3.17 1495 3.22 3.18 1514 3.26 3.22 1498 3.31 3.29
Nr of Subjects 1529 5.21 5.00 1495 5.70 6.00 1514 6.12 6.00 1498 6.99 7.00 # Students 1529 77.22 80.00 1495 120.06 119.00 1514 171.27 169.00 1498 326.27 288.00 # Teachers 1529 17.01 17.00 1495 20.31 20.00 1514 23.13 22.00 1498 36.02 34.00 # Non-Teaching Staff 1529 10.77 10.00 1495 12.79 12.00 1514 14.57 14.00 1498 19.66 18.00 Students/Teacher 1529 4.59 4.57 1495 6.07 6.00 1514 7.61 7.48 1498 9.17 9.00 Students/Staff 1529 2.82 2.81 1495 3.71 3.67 1514 4.66 4.60 1498 5.88 5.78 Class Size 1529 8.70 8.00 1495 11.62 11.00 1514 14.76 14.00 1498 18.85 18.50 Share Ukrainian 1529 0.93 1.00 1495 0.92 1.00 1514 0.89 1.00 1498 0.85 1.00 Share of Males 1529 43.60 44.44 1495 43.66 42.86 1514 43.57 43.75 1498 41.77 41.67 Unemployment Rate in Rayon 1529 3.45 3.20 1495 3.24 2.90 1514 2.79 2.50 1498 2.34 2.00
Average Wage in Rayon 1529 1389.90 1330.00 1495 1390.30 1323.00 1514 1417.64 1338.00 1498 1457.92 1353.39 Population in 2001 1529 754.39 704.00 1495 1030.68 960.00 1514 1523.92 1350.00 1498 2718.11 2343.00
18
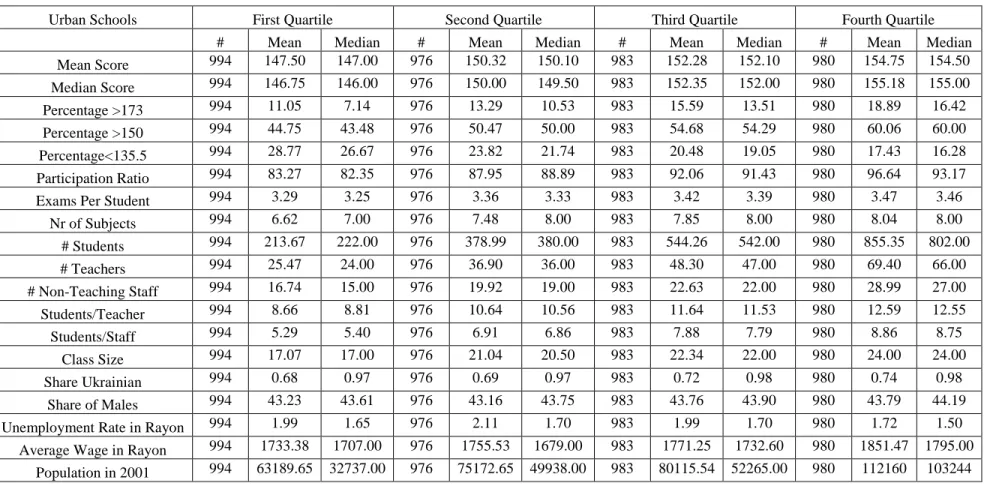
Table 3b. Descriptive statistics for urban schools, by school size quartiles
Urban Schools First Quartile Second Quartile Third Quartile Fourth Quartile # Mean Median # Mean Median # Mean Median # Mean Median Mean Score 994 147.50 147.00 976 150.32 150.10 983 152.28 152.10 980 154.75 154.50 Median Score 994 146.75 146.00 976 150.00 149.50 983 152.35 152.00 980 155.18 155.00 Percentage >173 994 11.05 7.14 976 13.29 10.53 983 15.59 13.51 980 18.89 16.42 Percentage >150 994 44.75 43.48 976 50.47 50.00 983 54.68 54.29 980 60.06 60.00 Percentage<135.5 994 28.77 26.67 976 23.82 21.74 983 20.48 19.05 980 17.43 16.28 Participation Ratio 994 83.27 82.35 976 87.95 88.89 983 92.06 91.43 980 96.64 93.17 Exams Per Student 994 3.29 3.25 976 3.36 3.33 983 3.42 3.39 980 3.47 3.46
Nr of Subjects 994 6.62 7.00 976 7.48 8.00 983 7.85 8.00 980 8.04 8.00 # Students 994 213.67 222.00 976 378.99 380.00 983 544.26 542.00 980 855.35 802.00 # Teachers 994 25.47 24.00 976 36.90 36.00 983 48.30 47.00 980 69.40 66.00 # Non-Teaching Staff 994 16.74 15.00 976 19.92 19.00 983 22.63 22.00 980 28.99 27.00 Students/Teacher 994 8.66 8.81 976 10.64 10.56 983 11.64 11.53 980 12.59 12.55 Students/Staff 994 5.29 5.40 976 6.91 6.86 983 7.88 7.79 980 8.86 8.75 Class Size 994 17.07 17.00 976 21.04 20.50 983 22.34 22.00 980 24.00 24.00 Share Ukrainian 994 0.68 0.97 976 0.69 0.97 983 0.72 0.98 980 0.74 0.98 Share of Males 994 43.23 43.61 976 43.16 43.75 983 43.76 43.90 980 43.79 44.19 Unemployment Rate in Rayon 994 1.99 1.65 976 2.11 1.70 983 1.99 1.70 980 1.72 1.50
Average Wage in Rayon 994 1733.38 1707.00 976 1755.53 1679.00 983 1771.25 1732.60 980 1851.47 1795.00 Population in 2001 994 63189.65 32737.00 976 75172.65 49938.00 983 80115.54 52265.00 980 112160 103244
19
Based on tables 3a and 3b, we find that
The size distribution of urban and rural schools overlaps little. For rural areas, the school size quartile thresholds are at 100 students, 141 students and 209 students while for the urban schools, the thresholds are at 305 students, 458 students and 646 students. Hence, the lowest size quartile for urban schools has an upper limit that is higher than the lower limit of the highest size quartile of rural schools.
In rural areas, the relation between size and Ukrainian exam scores is limited. Bigger schools have a slightly higher percentage of students among the top students, but also a somewhat higher percentage of low scoring students. The participation ratio, however, is somewhat lower in the lowest quartile.
While performance does not change much as size increases in rural areas, input variables do change a lot: the schools in the top quartile have, on average, a class size that is about the double of the class size in schools in the lowest quartile. The same is true of the student-teacher ratio.
In the cities, the relation between size and test scores is much clearer: bigger size goes together with substantially better mean and median test scores, a higher percentage of high scoring students and a lower percentage of low scoring students. For example, while the lowest urban size quartile has an average mean score of 147.5 and 44.75 percent students scoring „above average‟, the top quartile has an average mean score of 154.75 and 60 percent students scoring „above average‟. In addition, schools in the upper quartiles have substantially higher participation rates than schools in the lower quartiles.
Besides performance increasing with the size of the school in urban areas, also the class size and the student-teacher ratio increase with the size of the school.
Given that bigger schools in urban areas perform better, on average, than smaller schools in urban areas, and that, on average, schools in rural areas are smaller than schools in urban areas, it is no surprise that schools in rural areas perform worse, on average, than schools in urban areas. The participation ratio is also substantially smaller in rural areas27.
27 More general, if we compare rural schools to urban schools, we find that the median rural school has 9 students
taking the EIT tests against 34 students in urban schools, reflecting the big differences in size between rural and urban schools. Rural Schools have lower mean and median scores (about 148 versus about 153). They have a
20
Note that if we would focus on performance in Mathematics or Ukrainian history, rather than on the Ukrainian test, we get similar results.
As explained in the introduction, Ukraine plans to close schools with less than 100 students28. About a quarter of rural areas fall in this category, indeed, the upper bound of the bottom quartile of school size in our sample happens to be 100. The above results suggest that students at these smaller schools are not underperforming in test scores (nor are they over-performing), though they do require substantially more inputs and have somewhat smaller participation rates.
Very few schools in urban areas have less than 100 students (about 1 percent of the urban sample). The descriptive statistics above, however, do suggest that in urban areas increasing school size can increase both quality and save on inputs. This is unlike the descriptive statistics for the rural areas, which suggest that inputs can be saved (at a bigger rate than in urban areas) by having bigger schools but also, that quality would not change much.
In table 4a and 4b, we do a similar exercise as before but using class size quartiles.
For rural schools, we see little differences among quartiles, though participation is lower in the highest class size quartile.
For urban schools, participation is lower in the highest class size quartile but the lowest class size quartile has a lower average score and more failing students.
Classes in urban areas are substantially bigger than classes in rural areas. Quartile thresholds are at 17.5, 21 and 25 students per class for urban areas and 9, 13 and 17 students per class in rural areas.
considerably lower percentage of students who get top grades (median of 4.76 % vs 14.28 %) or who get above average grades (median of 48% vs 57%) but a considerably higher percentage of students who get low scores (median of 23.5% vs 17.5%). Finally, 73 % of the median rural school‟s students participate in the EIT, against 91% at the median urban school. Not surprisingly, the population in communities where rural schools are located is much smaller (median slightly 1000 people) than the urban communities (median around 70000). Not surprisingly, rural schools are substantially smaller than urban schools (median total number of students of 142 versus 466), have somewhat less teachers and non-teaching staff leading to a student-teacher ratio (median 6.6 versus 10.7), a student staff ratio (median 4 versus 7.2) and class size (median of 13 versus 21.5) which are substantially lower in rural areas. At the other side, students of urban schools are more likely to choose other languages than Ukrainian to do the EIT and are located in areas with less unemployment and higher wages. Both in rural and urban areas, the share of boys is around 43 percent, suggesting there is quite a gap in the decision to continue to study.
28 Given our performance measure is based on a test taken by school graduates, we do not have schools of level I or
21
Table 4a. Descriptive statistics for rural schools, by class size quartiles
Rural Schools First Quartile Second Quartile Third Quartile Fourth Quartile # Mean Median # Mean Median # Mean Median # Mean Median Mean Score 1839 148.69 148.80 1487 148.45 148.50 1248 148.24 148.30 1462 147.96 148.10 Median Score 1839 146.62 147.00 1487 147.48 148.00 1248 147.77 148.00 1462 147.60 148.00 Percentage >173 1839 9.11 0.00 1487 9.34 0.00 1248 9.62 7.69 1462 10.25 7.69 Percentage >150 1839 47.81 50.00 1487 47.75 50.00 1248 47.15 46.67 1462 46.21 46.29 Percentage<135.5 1839 24.26 20.00 1487 24.56 22.22 1248 25.81 25.00 1462 27.37 25.00 Participation ratio 1839 74.38 75.00 1487 73.85 75.00 1248 73.25 75.00 1462 69.74 71.75 Exams Per Student 1839 3.20 3.17 1487 3.24 3.20 1248 3.28 3.25 1462 3.29 3.26
Nr of Subjects 1839 5.04 5.00 1487 5.87 6.00 1248 6.47 7.00 1462 6.94 7.00 # Students 1839 106.92 96.00 1487 136.87 125.00 1248 196.17 170.50 1462 274.06 234.00 # Teachers 1839 18.98 18.00 1487 21.26 20.00 1248 25.67 23.00 1462 31.99 29.00 # Non-Teaching Staff 1839 12.01 11.00 1487 13.35 13.00 1248 15.67 14.50 1462 17.51 16.00 Students/Teacher 1839 5.53 5.21 1487 6.39 6.16 1248 7.51 7.37 1462 8.43 8.26 Students/Staff 1839 3.39 3.21 1487 3.91 3.78 1248 4.64 4.50 1462 5.39 5.24 Class Size 1839 7.04 7.00 1487 11.43 11.00 1248 15.49 15.50 1462 21.88 21.00 Share Ukrainian 1839 0.91 1.00 1487 0.90 1.00 1248 0.87 1.00 1462 0.89 1.00 Share of Males 1839 43.72 42.86 1487 43.46 44.44 1248 43.21 42.86 1462 42.08 42.31 Unemployment Rate in Rayon 1839 3.24 2.90 1487 3.03 2.70 1248 2.80 2.50 1462 2.66 2.30
22
Table 4b. Descriptive statistics for urban schools, by class size quartiles
Urban Schools First Quartile Second Quartile Third Quartile Fourth Quartile Mean Score 1022 149.93 149.95 957 151.56 151.20 996 151.87 152.20 958 151.51 151.20 Median Score 1022 149.35 149.50 957 151.45 151.50 996 152.00 152.00 958 151.50 151.50 Percentage >173 1022 13.42 10.00 957 15.09 12.20 996 15.47 13.64 958 14.84 12.75 Percentage >150 1022 50.00 50.00 957 52.94 53.33 996 53.96 54.55 958 53.06 53.44 Percentage<135.5 1022 24.93 21.95 957 22.18 20.00 996 21.48 19.62 958 21.88 20.00 Participationratio 1022 96.95 88.12 957 86.38 90.00 996 87.87 91.11 958 88.25 91.05 Exams Per Student 1022 3.31 3.30 957 3.38 3.38 996 3.41 3.41 958 3.43 3.41
Nr of Subjects 1022 6.84 7.00 957 7.58 8.00 996 7.79 8.00 958 7.80 8.00 # Students 1022 325.10 293.00 957 474.63 446.00 996 571.38 554.50 958 626.28 573.50 # Teachers 1022 34.59 31.00 957 44.01 41.00 996 49.67 47.00 958 52.06 48.00 # Non-Teaching Staff 1022 19.23 17.00 957 21.99 20.00 996 23.21 22.00 958 23.93 22.00 Students/Teacher 1022 9.21 9.40 957 10.82 10.72 996 11.54 11.54 958 12.02 12.10 Students/Staff 1022 5.91 5.99 957 7.14 7.16 996 7.80 7.75 958 8.13 8.08 Class Size 1022 13.69 15.00 957 19.54 19.50 996 23.21 23.00 958 28.38 28.00 Share Ukrainian 1022 0.71 1.00 957 0.73 1.00 996 0.72 0.96 958 0.68 0.88 Share of Males 1022 42.96 43.48 957 43.74 44.44 996 43.49 43.75 958 43.79 44.00 Unemployment Rate in Rayon 1022 2.19 1.80 957 2.04 1.70 996 1.91 1.60 958 1.65 1.35
Average Wage in Rayon 1022 1676.80 1542.10 957 1758.29 1688.90 996 1807.38 1763.00 958 1874.15 1877.00 Population in 2001 1022 51378 17516.00 957 76705 51552.00 996 90898 72611.00 958 113152 105654.00
23
Of course, none of the above results controls for other explanatory variables that can influence the school‟s performance measures. The regression analysis presented below will analyze whether these preliminary findings are confirmed once one controls for such confounding factors.
b. Are there selection effects?
Before we can study the determinants of the test scores, we need to discuss a number of sample selection issues as sample selection has the potential to bias our regression estimates.
We have data on 12,075 schools participating in the 2010 EIT29. In the MOE database, however, we only have 11,950 schools which have students in the 11th and/or 12th grade in 2010. For 11683 schools we have information in both databases, implying we have data for at least 94.5 percent of the Ukrainian schools with graduating students (11,683/(11,683+(12,075-11,683)+(11,950-11,683))). Another implication is that almost all schools which have students in the last year of secondary education have students who participate in the EIT. Hence, the „selection‟ introduced by the fact that we use EIT results, which is only taken by students aiming to go to the university, rather than some general test which would be taken by all graduating students , is likely to be minor. Of course, there is also the issue of selection among the students, an issue we will discuss next.
Only those students interested in continuing their studies at a university within Ukraine have an interest in taking the Independent External Test, hence the school average we have are based on a selected group of students rather than all students graduating in a given year. Moreover, while the students take the decision to participate or not themselves, schools do have a possibility to try to influence this choice. For example, if a school would like to get a good average score on the EIT, it can try to persuade weaker students not to take the test.
29
We have 12267 schools in the EIT 2009 data and 13678 in the EIT 2008 data. The 2008 EIT database includes vocational schools, which is not the case in 2009 and 2010. In this section, we focus on the descriptive data for the 2010 EIT. The descriptive statistics for 2008 and 2009 give a qualitatively similar picture
24
To study the degree to which there is selection, we use the „student participation ratio‟, that is, for those schools which have students that take the exam on a specific subject, we compute the ratio of students who take the exam divided by the total number of students in the highest grade (for a vast majority of schools this is the 11th grade, for some it is the 12th grade). Given that all students that participate in the EIT take the Ukrainian exam, a school‟s ratio of the number of students that take the Ukrainian exam on the number of students in the highest year is a good proxy for the extent of selection. If this ratio is 1, it means all students participate, if it is 0 it means nobody participates.
In about 7 % of the cases, the participation ratio indicator is bigger than one, i.e. there are more students taking the test than there are in the 11th/12th grade. One explanation for this is that the MoE data were recorded at a different time than the EIT exams, and that some students might have changed schools between the recording of the MoE data and the EIT exams. A second possible explanation is that some graduates of previous years were allocated to the school were they graduated in the past. A third explanation is simply that there are mistakes in the database. In the regression analysis presented below, we include in the sample only schools with a participation ratio that is less than 101 percent.
Table 5 gives the 2010 participation ratio statistics by region – we see a substantial variation among oblasts with especially low rates of participation in the Western regions of Zakarpatia and Chernivtsi (between 60 and 70 percent) and high rates of participation in Sevastopol and especially Kyiv (over 90 percent).
Table 6 tries to explain the differences between schools in terms of the 2010 participation ratio. We first run a simple OLS regression (1) of the participation ratio on our main variables of interest and a set of dummies reflecting the settlement status (urban versus rural), the oblast in which the school is located and the type of the school. Then (2) we add a set of additional explanatory variables including the gender composition of the school‟s EIT participant, their language choice, the school‟s location population in 2001, and the average wage and the unemployment rate in the rayon where the school is located in 2009. Next (3) we allow for non-linear effects in our main input variables, adding squared terms of the total number of students, the student-teacher ratio at the school and the class size of the graduating class. Finally, we use tobit regression (4) to control for the fact that the participation ratio is constrained to be between
25
zero and one. We run these four regressions first on the total sample and then we run separate regressions for urban and rural schools.
26
Table 5 – Participation Ratio by Oblast
Region # Mean Median St. Dev. Min Max
Zakarpatska Oblast 843 60.7 60.0 24.6 3.3 100.0 Chernivetska Oblast 754 67.9 69.6 22.2 6.7 100.0 Volynska Oblast 1027 74.5 77.3 20.3 1.9 100.0 Khersonsksa Oblast 982 74.2 78.0 21.7 4.7 100.6 Ivano-Frankivska Oblast 975 76.1 79.5 19.7 9.1 101.0 Rivnenska Oblast 1012 76.6 80.0 20.6 12.5 101.0 Chernihivska Oblast 1116 77.2 82.4 21.0 3.8 100.0 Odeska Oblast 1638 77.9 84.6 21.4 1.6 101.0 Khmelnytska Oblast 1280 78.5 84.6 21.3 1.9 100.0 Cherkaska Oblast 1339 80.4 85.4 19.2 2.0 100.0 Zaporizka Oblast 1309 79.3 85.7 21.4 2.4 100.0 Kirovogradska Oblast 1053 79.2 85.7 20.8 9.1 100.9 Vinnytska Oblast 1389 81.2 86.7 18.6 4.0 101.0 Mykolaivska Oblast 1049 80.3 86.7 21.5 2.9 100.9
Autonomous Republic of Crimea 1189 80.9 87.2 19.5 0.9 100.0
Zhytomyrska Oblast 944 80.9 87.5 20.1 4.3 100.0 Lvivska Oblast 1678 82.0 87.7 18.4 2.0 100.9 Poltavska Oblast 1229 83.0 88.2 18.0 7.4 100.0 Ternopilska Oblast 813 83.0 88.4 18.4 1.6 100.0 Donetska Oblast 2363 82.4 89.5 20.2 0.4 100.7 Sumska Oblast 997 82.8 89.5 18.9 1.8 100.8 Dnipropetrovska Oblast 2098 84.1 90.0 17.6 1.0 101.0 Kyivska Oblast 1420 83.7 90.0 18.5 2.6 100.9 Luhanska Oblast 1258 84.6 90.5 17.3 7.2 100.9 Kharkivska Oblast 1870 85.5 91.7 17.1 12.5 100.0 City of Sevastopol 170 85.5 91.8 16.6 20.8 100.0 City of Kyiv 1033 92.4 96.4 13.5 0.4 100.9
27
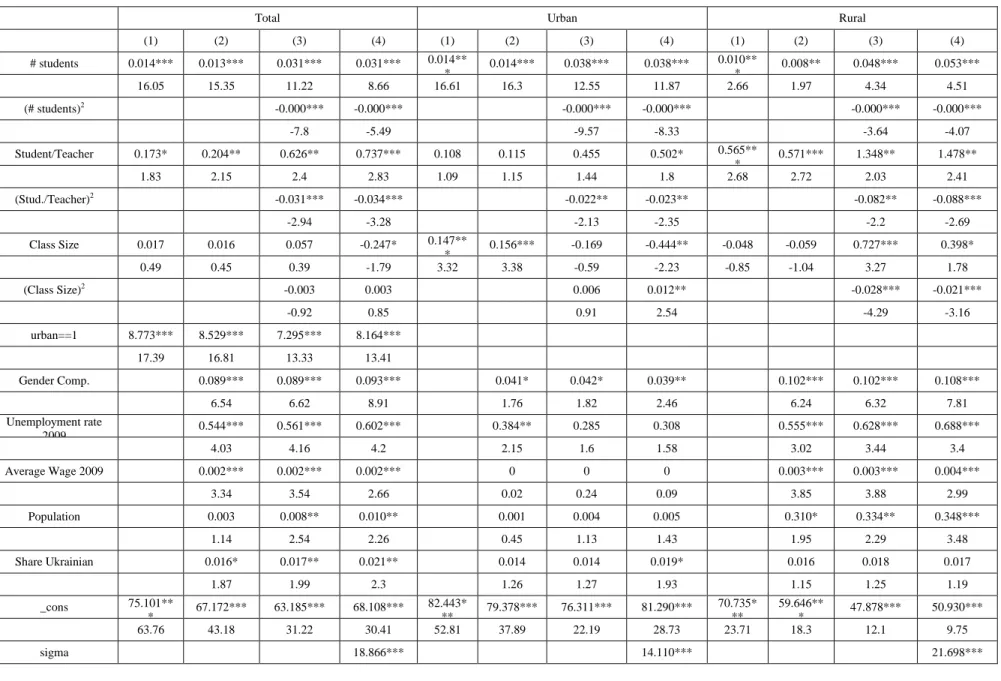
Table 6: Ukrainian Language, Participation Ratio
Total Urban Rural
(1) (2) (3) (4) (1) (2) (3) (4) (1) (2) (3) (4) # students 0.014*** 0.013*** 0.031*** 0.031*** 0.014** * 0.014*** 0.038*** 0.038*** 0.010** * 0.008** 0.048*** 0.053*** 16.05 15.35 11.22 8.66 16.61 16.3 12.55 11.87 2.66 1.97 4.34 4.51 (# students)2 -0.000*** -0.000*** -0.000*** -0.000*** -0.000*** -0.000*** -7.8 -5.49 -9.57 -8.33 -3.64 -4.07 Student/Teacher 0.173* 0.204** 0.626** 0.737*** 0.108 0.115 0.455 0.502* 0.565** * 0.571*** 1.348** 1.478** 1.83 2.15 2.4 2.83 1.09 1.15 1.44 1.8 2.68 2.72 2.03 2.41 (Stud./Teacher)2 -0.031*** -0.034*** -0.022** -0.023** -0.082** -0.088*** -2.94 -3.28 -2.13 -2.35 -2.2 -2.69 Class Size 0.017 0.016 0.057 -0.247* 0.147** * 0.156*** -0.169 -0.444** -0.048 -0.059 0.727*** 0.398* 0.49 0.45 0.39 -1.79 3.32 3.38 -0.59 -2.23 -0.85 -1.04 3.27 1.78 (Class Size)2 -0.003 0.003 0.006 0.012** -0.028*** -0.021*** -0.92 0.85 0.91 2.54 -4.29 -3.16 urban==1 8.773*** 8.529*** 7.295*** 8.164*** 17.39 16.81 13.33 13.41 Gender Comp. 0.089*** 0.089*** 0.093*** 0.041* 0.042* 0.039** 0.102*** 0.102*** 0.108*** 6.54 6.62 8.91 1.76 1.82 2.46 6.24 6.32 7.81 Unemployment rate 2009 0.544*** 0.561*** 0.602*** 0.384** 0.285 0.308 0.555*** 0.628*** 0.688*** 4.03 4.16 4.2 2.15 1.6 1.58 3.02 3.44 3.4 Average Wage 2009 0.002*** 0.002*** 0.002*** 0 0 0 0.003*** 0.003*** 0.004*** 3.34 3.54 2.66 0.02 0.24 0.09 3.85 3.88 2.99 Population 0.003 0.008** 0.010** 0.001 0.004 0.005 0.310* 0.334** 0.348*** 1.14 2.54 2.26 0.45 1.13 1.43 1.95 2.29 3.48 Share Ukrainian 0.016* 0.017** 0.021** 0.014 0.014 0.019* 0.016 0.018 0.017 1.87 1.99 2.3 1.26 1.27 1.93 1.15 1.25 1.19 _cons 75.101** * 67.172*** 63.185*** 68.108*** 82.443* ** 79.378*** 76.311*** 81.290*** 70.735* ** 59.646** * 47.878*** 50.930*** 63.76 43.18 31.22 30.41 52.81 37.89 22.19 28.73 23.71 18.3 12.1 9.75 sigma 18.866*** 14.110*** 21.698***
28
134.82 90.1 100.17
R Adj sq. 0.309 0.316 0.32 0.447 0.448 0.459 0.083 0.098 0.107
N 10906 10906 10906 10906 4922 4922 4922 4922 5984 5984 5984 5984 The regression also includes oblast dummies, dummies for different types of schools and evening schools. The full table can be found in excel tables which can be made available upon request. *** means significant at the 1% level, ** at the 5 % level and * at the 10 percent level.T statistics are based on robust standard errors for the OLS specifications.
29
We find that
School size is positively correlated with the participation-ratio in both rural and urban areas, though the effect is somewhat smaller in the rural areas. When allowing for a non-linear effect of school size (specification 3), we find, based on the complete sample, that the maximum participation ratio is reached at 1156 students, which is close to the 98th percentile of school sizes in our sample. A school at this level has a participation ratio that is roughly 7 percentage points higher than a school of 455 students (75th percentile), 11 percentage point more than a school at the median (227) and 14 percentage point more than a school of 128 students ( the 25th percentile). Note that we get these effects after correcting for a wide range of other factors that can affect a school‟s participation ratio. When restricting the sample to urban schools, we get the maximum at 1060 student (95th percentile). A school at this level can expect a participation ratio that is 3, 6 and 10 percentage point higher than a school with 666, 465 and 305 students respectively.
When restricting the sample to rural schools, we get the maximum at 470 students (between 95th and 99th percentile). A School at this level can expect a participation ratio that is 3.5, 5.7 and 7 percentage point higher than a school with 208, 141 respectively 100 students.
The impact of class size varies from one specification to another, both in terms of significance and in terms of sign. In any case, even if significant, the size of the effect is very small.
We also find that:
The student-teacher ratio has a positive effect in all specifications, indicating that schools with a higher number of students per teacher have higher participation ratios. However, this effect is small in general and even insignificant for the urban schools. In rural schools, we find some evidence of a non-linear effect, with the optimal student-teacher ratio being around the 75th percentile at 8 students per teacher. But again, deviating from that optimum barely reduces the participation ratio
As far as other variables are concerned we find that evening schools have low participation ratios (70 percentage points less than the average school) and that urban schools have substantially higher participation rates ( about 8 percentage points). Also the type of school matters: lycea, colegiums and gymnasiums have significantly higher participation ratios (5 to 10 percentage points higher than ordinary schools). Schools located in rayons with higher registered unemployment have somewhat higher