Edited by: Martin G. Klotz, Queens College (CUNY), USA Reviewed by: Celesate Linde, Australian National University, Australia Helen L. Hayden, Department of Economic Development, Jobs, Transport and Resources, Australia Merrick Ekins, Queensland Museum, Australia *Correspondence: John P. Clarkson john.clarkson@warwick.ac.uk
Specialty section: This article was submitted to Fungi and Their Interactions, a section of the journal Frontiers in Microbiology Received:12 October 2016 Accepted:09 March 2017 Published:04 April 2017 Citation: Clarkson JP, Warmington RJ, Walley PG, Denton-Giles M, Barbetti MJ, Brodal G and Nordskog B (2017) Population Structure of Sclerotinia subarctica and Sclerotinia sclerotiorum in England, Scotland and Norway. Front. Microbiol. 8:490. doi: 10.3389/fmicb.2017.00490
Population Structure of
Sclerotinia
subarctica
and
Sclerotinia
sclerotiorum
in England, Scotland
and Norway
John P. Clarkson1*, Rachel J. Warmington2, Peter G. Walley1, 3, Matthew Denton-Giles4, Martin J. Barbetti5, Guro Brodal6and Berit Nordskog6
1Warwick Crop Centre, School of Life Sciences, University Warwick, Warwick, UK,2Eden Project, Bodelva, UK,3Institute of
Integrative Biology, University of Liverpool, Liverpool, UK,4Centre for Crop and Disease Management, Curtin University,
Bentley, WA, Australia,5Faculty of Science, School of Agriculture and Environment, University of Western Australia, Crawley,
WA, Australia,6Division of Biotechnology and Plant Health, Norwegian Institute of Bioeconomy Research, Ås, Norway
Sclerotinia species are important fungal pathogens of a wide range of crops and wild
host plants. While the biology and population structure ofSclerotinia sclerotiorumhas been well-studied, little information is available for the related speciesS. subarctica. In this study,Sclerotiniaisolates were collected from different crop plants and the wild host
Ranuculus ficaria(meadow buttercup) in England, Scotland, and Norway to determine
the incidence of Sclerotinia subarctica and examine the population structure of this pathogen for the first time. Incidence was very low in England, comprising only 4.3% of isolates while moderate and high incidence ofS. subarcticawas identified in Scotland and Norway, comprising 18.3 and 48.0% of isolates respectively. Characterization with eight microsatellite markers identified 75 haplotypes within a total of 157 isolates over the three countries with a few haplotypes in Scotland and Norway sampled at a higher frequency than the rest across multiple locations and host plants. In total, eight microsatellite haplotypes were shared between Scotland and Norway while none were shared with England. Bayesian and principal component analyses revealed common ancestry and clustering of Scottish and NorwegianS. subarcticaisolates while English isolates were assigned to a separate population cluster and exhibited low diversity indicative of isolation. Population structure was also examined forS. sclerotiorumisolates from England, Scotland, Norway, and Australia using microsatellite data, including some from a previous study in England. In total, 484 haplotypes were identified within 800S.
sclerotiorumisolates with just 15 shared between England and Scotland and none shared
between any other countries. Bayesian and principal component analyses revealed a common ancestry and clustering of the English and Scottish isolates while Norwegian and Australian isolates were assigned to separate clusters. Furthermore, sequencing part of the intergenic spacer (IGS) region of the rRNA gene resulted in 26 IGS haplotypes within 870 S. sclerotiorum isolates, nine of which had not been previously identified and two of which were also widely distributed across different countries.S. subarctica therefore has a multiclonal population structure similar to S. sclerotiorum, but has a different ancestry and distribution across England, Scotland, and Norway.
INTRODUCTION
Sclerotinia species are important pathogens of a wide range of crop plants as well as many wild hosts. Of these, S. sclerotiorum (Lib.) de Bary is probably the best studied with a worldwide distribution and a wide host range of more than 400 plants including many important dicotyledonous crops and wild species (Boland and Hall, 1994). Some of the major crops affected include oilseed rape, soybean, sunflower, lettuce, carrot, potatoes, beans, and peas (Bolton et al., 2006). Infection of the majority of host plants is by ascospores released from apothecia produced through carpogenic germination of soilborne sclerotia, although direct infection by myceliogenic germination can occasionally occur (Hao et al., 2003). Apothecia are formed through sexual reproduction, and asS. sclerotiorumis predominantly homothallic, a multiclonal population structure has generally been observed in studies carried out on a variety of crop plants in Alaska, Australia, Brazil Canada, China, Iran, New Zealand, Turkey, UK, and USA using DNA fingerprinting (Kohn et al., 1991; Kohn, 1995; Cubeta et al., 1997; Carbone et al., 1999; Carpenter et al., 1999; Carbone and Kohn, 2001b; Hambleton et al., 2002; Phillips et al., 2002) or microsatellite genotyping (Sexton and Howlett, 2004; Sexton et al., 2006; Winton et al., 2006; Mert-Turk et al., 2007; Hemmati et al., 2009; Gomes et al., 2011; Attanayake et al., 2013; Clarkson et al., 2013; Aldrich-Wolfe et al., 2015; Lehner et al., 2015). In these studies, the typical population structure is such that one or a small number of clones is sampled at high frequency, with the remainder sampled only once or a few times (Kohn, 1995). The high frequencyS. sclerotiorumclones found at a local scale can sometimes be sampled repeatedly over several years in the same locality and in some cases over a wider geographic area (Hambleton et al., 2002; Clarkson et al., 2013). There is, however, a limit to the geographic distribution ofS. sclerotiorumclones; for instance, none of the
S. sclerotiorumclones from oilseed rape and soybean identified by DNA fingerprinting in Canada (Kohn et al., 1991; Kohli et al., 1992, 1995; Hambleton et al., 2002) were found in various crops from different locations in the USA (Cubeta et al., 1997; Malvárez et al., 2007). The distribution of most
S. sclerotiorumclones is therefore restricted geographically with little or no sharing of genotypes between different locations in the same country, resulting in genetically distinct subdivided populations as identified in Australia (Sexton and Howlett, 2004), UK (Clarkson et al., 2013) and USA (Malvárez et al., 2007). Although there is overwhelming support for homothallism and clonal reproduction in S. sclerotiorum, there has been some evidence for outcrossing and genetic exchange based on linkage disequilibrium measures (Atallah et al., 2004; Sexton and Howlett, 2004; Malvárez et al., 2007; Hemmati et al., 2009; Clarkson et al., 2013) and lack of association of molecular markers with mycelial compatibility group (MCG) (Atallah et al., 2004). More direct evidence of outcrossing has been through rare observations of sibling ascospores derived from a single apothecium belonging to more than one MCG (Atallah et al., 2004; Malvárez et al., 2007) and ascospore dimorphism (Ekins et al., 2006).
Although the population structure ofS. sclerotiorumhas been well-studied, there are fewer reports for related species such as
Sclerotinia minorJagger (Wu and Subbarao, 2006)S. trifoliorum
Erikss. (Njambere et al., 2014) and none forS. subarcticanom. prov.S. minorhas a reported host range of just over 90 species (Melzer et al., 1997) and likeS. sclerotiorumis a major pathogen of lettuce (Wu and Subbarao, 2006). In one of the few population studies,Wu and Subbarao (2006) reported much lower levels of genetic diversity inS. minor compared withS. sclerotiorum
based on MCGs for isolates from lettuce in California. In contrast toS. sclerotiorumandS. minor,S. trifoliorumis bipolar heterothallic (Uhm and Fujii, 1983) and has a more limited host range, being found mainly on cool-season forage and vegetable legumes (Willetts et al., 1980). A recent population study of S. trifoliorum on chickpea in California identified high levels of diversity based on MCGs and microsatellites (Njambere et al., 2014). Compared to the otherSclerotiniaspp.,S. subarcticawas only identified relatively recently on the wild hosts yellow marsh marigold (Caltha palustris), dandelion (Taraxacum sp.), and northern wolfsbane (Aconitum septentrionale) in Norway ( Holst-Jensen et al., 1998). It was first reported on horticultural crop hosts in Alaska, often in sympatry withS. sclerotiorum(Winton et al., 2006). A possible reason for this is that S. subarctica
is difficult to distinguish fromS. sclerotiorum as symptoms on plants are identical, and the two species look very similar in culture although S. subarctica generally forms larger sclerotia (Clarkson et al., 2010). Identification and designation as a new species was therefore based on three nucleotide substitutions in the ITS region and the absence of a 304 base group I intron in the large subunit (LSU) of the ribosomal RNA gene ( Holst-Jensen et al., 1998). Since then,S. subarcticawas first reported in the UK on meadow buttercup (Ranunculus acris) at a single location in England and pathogenicity demonstrated on oilseed rape (Clarkson et al., 2010). More recently, the pathogen has also been identified on a turnip rape crop (Brassica rapasubsp.
oleifera) in Norway (Brodal et al., 2017). Little is known about the biology and epidemiology ofS. subarctica, but one hypothesis is that it is more endemic to Northern latitudes (Winton et al., 2006). In addition, there have been no studies so far on S. subarcticapopulation structure, although microsatellite markers have been published (Winton et al., 2007).
In a previous study, the population structure ofS. sclerotiorum
was examined in England and Wales (UK) for the first time using microsatellites and sequencing the intergenic spacer (IGS) region of the rRNA gene. (Clarkson et al., 2013). In total, 228 microsatellite haplotypes were identified within 384 isolates with one found at high frequency across different crop types and meadow buttercup. Of 14 IGS haplotypes identified, six were unique to buttercup and three were found at high frequency and were also present inS. sclerotiorumpopulations from Canada, the USA, and New Zealand published previously.
To date, S. subarctica has only been found on meadow buttercup at one location in England in sympatry with S. sclerotiorum, but it was hypothesized that S. subarctica may be more prevalent in the north of the UK and is likely to be found on crop plants (Clarkson et al., 2013). Hence one of the main aims of the present study was to sample and identify the
species in furtherSclerotiniapopulations from both crop plants and buttercup in England and Scotland. In addition, we sought to confirm that S. subarctica could still be isolated from the single location in Herefordshire (England) where it was first identified in samples collected in 2009 (Clarkson et al., 2010). For comparison, the relative incidence of S. subarctica and S. sclerotiorum was also examined for crop plants in Norway, a northern “neighbour” of the UK, where a high incidence of
S. subarctica might be expected. Following identification ofS. subarctica, a further aim was to genotype these isolates using microsatellites, hence providing a population structure analysis of this pathogen for the first time. Microsatellite and IGS data were also generated for isolates collected and identified as S. sclerotiorum, allowing population structure at a country scale to be examined for England, Scotland, and Norway. This added to the existing information generated in the previous study that focussed only on S. sclerotiorum populations from different locations in England. Finally, S. sclerotiorum isolates collected from Western Australia and genotyped using the same microsatellite markers and/or by IGS sequencing were also used as a geographically distant comparison with the UK and Norwegian populations.
MATERIALS AND METHODS
Sclerotinia
Isolates from Different Host
Plants
Sclerotinia species sclerotia were collected from a range of diseased crop plants comprising carrot (Daucus carota), cabbage (Brassica oleracea), celery (Apium graveolens), chinese cabbage (Brassica rapa subsp. pekinensis), camelina (Camelina sativa), Jerusalem artichoke (Helianthus tuberosus), lettuce (Lactuca sativa), oilseed rape (Brassica napus subsp. napus), potato (Solanum tuberosum), pumpkin (Cucurbita pepo), swede (B. napus), and turnip rape (B. rapasubsp.oleifera) from different locations in England, Scotland, and Norway between 2009 and 2013 (Table 1). For some crops, structured sampling was carried out whereby sclerotia were collected from infected plants at points at least 8 m apart along transects, with sclerotia collected from different points stored separately. For others, low levels of disease meant that this was not possible and sclerotia were collected from individual infected plants where found. Cultures ofSclerotiniawere obtained from individual sclerotia by surface sterilizing them in a solution of 50% sodium hypochlorite (11– 14% available chlorine, VWR International Ltd, UK) and 50% ethanol (v/v) for 4 min with agitation followed by two washes in sterile distilled water (SDW) for 1 min. The sclerotia were then bisected, placed on potato dextrose agar (PDA; Oxoid) and incubated at 20◦C. After 2–3 days, agar plugs from the leading edge of actively growing mycelium were sub-cultured onto PDA and after ∼6 weeks the mature sclerotia formed were stored both dry at 5◦C and submerged in potato dextrose broth (PDB; Formedium, UK) amended with 10% glycerol (Sigma-Aldrich Company Ltd, UK) at−20◦C. These stock sclerotia were used to initiate new cultures as required.
Isolates ofSclerotinia spp. were also isolated from meadow buttercup in England and Scotland (Table 1) following the
method described by Clarkson et al. (2013). Briefly, this was done by sampling flowers from five plants showing symptoms of infection, which were collected at up to 40 points at 10 m intervals along transects, with flowers from each plant stored separately. The flowers were then incubated on damp tissue paper in sealed plastic boxes at room temperature (∼22◦C) for 4 weeks. Sclerotia formed on the damp tissue paper were then picked off and cultured as described previously.
Isolates of S. sclerotiorum collected between 2009 and 2014 were also obtained from sclerotia collected from infected lupin and oilseed rape from the northern and southern agricultural regions of Western Australia in addition to “standard” isolates from oilseed rape (collected 2004), cabbage, and carrot (collected 2010) (Ge et al., 2012). These were cultured and stored as described previously.
DNA Extraction and Molecular
Identification of
S. sclerotiorum
and
S. subarctica
Sclerotiniaspp. cultures were initiated from stock sclerotia and incubated on PDA at 20◦C for 3–4 days to produce actively growing colonies. Three agar plugs were taken from the leading edge, placed into Petri dishes containing half strength PDB, and incubated at 20◦C for 3 days. The agar plugs were then removed and the mycelial mat washed twice in sterilized reverse osmosis (RO) water and blotted dry on tissue (KimTech; Kimberly-Clark Ltd, UK) before being freeze-dried overnight. Genomic DNA was extracted from the freeze-dried mycelium using a DNeasy Plant Mini Kit (Qiagen Ltd, UK) following the manufacturer’s protocol.
S. subarcticaandS. sclerotiorumisolates were distinguished by PCR amplification of the large subunit of the ribosomal DNA (LSU), where a large (304 bp) intron is absent inS. subarctica
compared toS. sclerotiorum(Holst-Jensen et al., 1998). The 25 µl PCR reaction mixture consisted of 1 x REDTaq ReadyMix PCR reaction mix (Sigma-Aldrich, UK), LR5 and LROR primers (0.4µmol L−1; (Vilgalys and Hester, 1990) and ∼10 ng DNA template. Thermal cycling parameters were 94◦C for 2 min; 35 cycles of 94◦C for 60 s, 52◦C for 60 s, 72◦C for 60 s; 72◦C for 10 min and then a hold at 12◦C. PCR products were visualized on a 1.5% agarose gel with a DNA ladder (EasyLadder I, Bioline Reagents Ltd, UK). Isolates associated with the smaller sized amplicons were identified asS. subarctica and this was further confirmed by PCR amplification and sequencing of the rRNA ITS region. Here, the PCR reaction mixture of 25µl consisted of 1 x REDTaq ReadyMix PCR reaction mix (Sigma-Aldrich, UK), modified standard ITS primers (White et al., 1990) for
S. sclerotiorumITS2AF (TCGTAACAAGGTTTCCGTAGG) and
ITS2AR (CGCCGTTACTGAGGTAATCC; 0.4 µmol L−1) and
approximately 10 ng DNA template. Thermal cycling parameters were 94◦C for 2 min; 40 cycles of 94◦C for 15 s, 59◦C for 15 s, 72◦C for 30 s; 72◦C for 10 min and then a hold at 12◦C. PCR products were visualized on a 1.5% agarose gel to confirm amplification, purified using the QIAquick PCR purification kit (Qiagen, UK), and sequenced (ITS2AF/ITS2AR primers) by GATC Biotech (Germany). ITS sequences obtained for all the
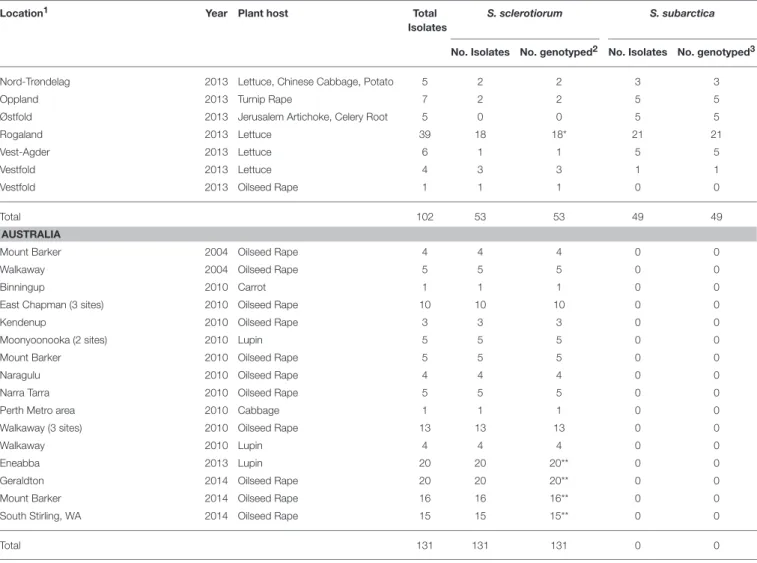
TABLE 1 | Origin and identity ofSclerotiniaspp. isolates.
Location1 Year Plant host Total Isolates
S. sclerotiorum S. subarctica
No. Isolates No. genotyped2 No. Isolates No. genotyped3
ENGLAND AND WALES
Blyth, Nottinghamshire (CA1) 2005 Carrot cv. Nairobi 32 32 32 0 0
Petworth, Sussex (LE1) 2005 Lettuce cv. Silverado 32 32 32 0 0
Preston Wynn, Herefordshire (OR1) 2005 Oilseed Rape cv. Winner 32 32 32 0 0
Holywell, Warwickshire (HO1) 2007 Meadow buttercup 32 32 32 0 0
Preston Wynn, Herefordshire (OR2) 2007 Oilseed Rape cv. Lioness 32 32 32 0 0
Deans Green, Warwickshire (DG1) 2008 Meadow buttercup 32 32 32 0 0
Holywell, Warwickshire (HO2) 2008 Meadow buttercup 32 32 32 0 0
Deans Green, Warwickshire (DG2) 2009 Meadow buttercup 32 32 32 0 0
Elan Valley, Powys (EV1) 2009 Meadow buttercup 32 32 32 0 0
Methwold, Norfolk (CE1) 2009 Celery cv. Victoria 32 32 32 0 0
Michaelchurch Escley1, Herefordshire (MI1) 2009 Meadow buttercup 50 44 32 16 15
Sutton St Nicholas, Herefordshire (PE1) 2009 Pea cv. Setchey 32 32 32 0 0
Vowchurch1, Herefordshire 2009 Oilseed Rape cv. unknown 40 40 32 0 0
Michaelchurch Escley1, Herefordshire 2010 Meadow buttercup 57 53 32 4 4
Michaelchurch Escley2, Herefordshire 2010 Meadow buttercup 32 32 32 0 0
Sutton Bridge, Lincolnshire 2010 Oilseed Rape cv. Catana 32 32 32 0 0
Upwood, Cambridgeshire 2010 Meadow buttercup 32 32 32 0 0
Vowchurch2, Herefordshire 2010 Oilseed Rape 32 32 32 0 0
Michaelchurch Escley, Herefordshire 2011 Meadow buttercup 40 25 24 15 15
Coxwold, North Yorkshire 2012 Carrot cv. Nairobi 32 32 0 0 0
Edwinstowe, Nottinghamshire 2012 Carrot cv. Nairobi 40 40 0 0 0
Total 749 714 600 35 34
SCOTLAND
Coupar Angus, Perthshire 2010 Carrot cv. Nairobi 40 33 32 7 7
Bo’ness, West Lothian 2011 Meadow buttercup 44 43 32 1 1
Dunfermline, Fife 2011 Meadow buttercup 25 24 23 1 1
Bo’ness, West Lothian 2012 Meadow buttercup 45 42 0 3 3
Dunfermline, Fife 2012 Meadow buttercup 31 19 0 12 12
Isla Bend 2012 Potato 18 12 0 6 6
Meigle, Perthshire 2012 Pea 39 27 0 12 12
Muirhead, Lanarkshire 2012 Carrot 20 20 0 0 0
Tyninghame, East Lothian 2012 Swede 28 28 0 0 0
Eyemouth, Berwickshire 2013 Potato 34 16 0 18 18
Forfar, Angus 2013 Oilseed rape 15 15 0 0 0
Forfar, Angus 2013 Carrot 10 10 0 0 0
Glamis, Angus 2013 Carrot 12 12 0 0 0
Meigle, Perthshire 2013 Potato, Saxon 26 14 0 12 12
Redford, Angus 2013 Potato, Rooster 17 15 0 2 2
Total 404 330 87 74 74
NORWAY
Buskerud 1993 Lettuce 1 1 1 0 0
Østfold 2012 Jerusalem Artichoke 1 0 0 1 1
Vestfold 2012 Swede 1 0 0 1 1
Akershus 2013 Camelina 13 13 13 0 0
Buskerud 2013 Lettuce, pumpkin 17 12 12 5 5
Hedmark 2013 Carrot 2 0 0 2 2
TABLE 1 | Continued
Location1 Year Plant host Total Isolates
S. sclerotiorum S. subarctica
No. Isolates No. genotyped2 No. Isolates No. genotyped3
Nord-Trøndelag 2013 Lettuce, Chinese Cabbage, Potato 5 2 2 3 3
Oppland 2013 Turnip Rape 7 2 2 5 5
Østfold 2013 Jerusalem Artichoke, Celery Root 5 0 0 5 5
Rogaland 2013 Lettuce 39 18 18* 21 21
Vest-Agder 2013 Lettuce 6 1 1 5 5
Vestfold 2013 Lettuce 4 3 3 1 1
Vestfold 2013 Oilseed Rape 1 1 1 0 0
Total 102 53 53 49 49
AUSTRALIA
Mount Barker 2004 Oilseed Rape 4 4 4 0 0
Walkaway 2004 Oilseed Rape 5 5 5 0 0
Binningup 2010 Carrot 1 1 1 0 0
East Chapman (3 sites) 2010 Oilseed Rape 10 10 10 0 0
Kendenup 2010 Oilseed Rape 3 3 3 0 0
Moonyoonooka (2 sites) 2010 Lupin 5 5 5 0 0
Mount Barker 2010 Oilseed Rape 5 5 5 0 0
Naragulu 2010 Oilseed Rape 4 4 4 0 0
Narra Tarra 2010 Oilseed Rape 5 5 5 0 0
Perth Metro area 2010 Cabbage 1 1 1 0 0
Walkaway (3 sites) 2010 Oilseed Rape 13 13 13 0 0
Walkaway 2010 Lupin 4 4 4 0 0
Eneabba 2013 Lupin 20 20 20** 0 0
Geraldton 2014 Oilseed Rape 20 20 20** 0 0
Mount Barker 2014 Oilseed Rape 16 16 16** 0 0
South Stirling, WA 2014 Oilseed Rape 15 15 15** 0 0
Total 131 131 131 0 0
1Locations followed by codes in brackets refer to data published previously byClarkson et al. (2013).
2Genotyped using microsatellites and sequencing of intergenic spacer (IGS) region of rRNA gene except*one isolate genotyped by microsatellites only,**genotyped by IGS sequencing only.
3Genotyped using microsatellites.
implemented in MEGA v6 (Tamura et al., 2013) and sequence identity was confirmed by BLASTn analysis.
Molecular Characterization of
Sclerotinia
subarctica
Isolates Using Microsatellites
Isolates identified asS. subarcticawere characterized using eight microsatellite markers in two multiplexed PCR reactions (loci MS01, MS03, MS06, MS08 and MS02, MS04, MS05, MS07) with fluorescent-labeled primer pairs (Applied Biosystems, UK) as developed byWinton et al. (2007). Each PCR reaction mixture of 20µl consisted of 1 x QIAGEN Multiplex PCR Master Mix, 0.5 x Q solution, primer mix (0.4µmol L−1) and∼10 ng DNA template. Thermal cycling parameters were 95◦C for 15 min; 35 cycles of 94◦C for 30 s, 55◦C for 90 s, 69◦C for 75 s; 60◦C for 30 min and then a hold at 12◦C. PCR products were visualized on a 1.5% agarose gel to confirm amplification and two separate PCR amplifications per locus were carried out for each isolate to
ensure reproducibility of results. The size of all PCR amplicons was determined by Eurofins (Germany) using an ABI 3130xl genetic analyser and allele sizes assigned using GENEMARKER (Version 1.6; SoftGenetics, USA). FLEXIBIN (Amos et al., 2007) was then used to bin allele sizes and estimate the relative number of repeats at each locus.
Molecular Characterization of
Sclerotinia
Sclerotiorum
Isolates Using Microsatellites
and IGS sequencing
Isolates identified as S. sclerotiorum were characterized using eight microsatellite markers (Sirjusingh and Kohn, 2001) in two multiplexed PCR reactions (loci 13-2, 17-3, 55-4, 110-4, 114-4 and 7-2, 8-3, 92-114-4) using fluorescent-labeled primer pairs (Applied Biosystems, UK). The PCR reaction mixture of 10µl consisted of 1 x QIAGEN Multiplex PCR Master Mix, 0.5 x Q solution, forward and reverse primer pairs (0.2µmol L−1) and
∼10 ng DNA template. Thermal cycling parameters were 95◦C for 15 min; 35 cycles of 94◦C for 30 s, 55◦C for 90 s, 69◦C for 75 s; 69◦C for 75 s and then a hold at 12◦C. PCR products were visualized on a 1.5% agarose gel to confirm amplification and two separate PCR amplifications per locus were carried out for each isolate to ensure reproducibility of results. The size of all PCR amplicons was determined by Eurofins (Germany) using an ABI 3130xl genetic analyser and allele sizes assigned using GENEMARKER (Version 1.6; SoftGenetics, USA). FLEXIBIN (Amos et al., 2007) was then used to bin allele sizes and estimate the number of repeats for each locus.
S. sclerotiorumisolates were also characterized by sequencing part of the IGS region of the rRNA gene where PCR primers
IGS2F (TTACAAAGATCCTCTTTCCATTCT) and IGS2R
(GCCTTTACAGGCTGACTCTTC) (Clarkson et al., 2013) were used to amplify an 834 bp (approx.) fragment. The PCR reaction mixture of 25 µl consisted of 0.5 x REDTaq ReadyMix PCR reaction mix (Sigma-Aldrich, UK), IGS2F and IGS2R primers (4 µmol L−1) and ∼10 ng DNA template. Thermal cycling parameters were 94◦C for 2 min, 40 cycles of 94◦C for 30 s, 57◦C for 30 s, 72◦C for 2 min followed by 72◦C for 10 min and a hold of 12◦C. PCR products were visualized on a 1.5% agarose gel to confirm amplification, purified using the QIAquick PCR purification kit (Qiagen, UK), and sequenced (IGS2F/IGS2R primers) by GATC Biotech (Germany). IGS primers did not consistently amplify an initial selection of S. subarcticaisolates and hence sequences were not generated for this species.
Analysis of
Sclerotinia sclerotiorum
and
Sclerotinia subarctica
Microsatellite Data
ARLEQUIN (Excoffier et al., 2005) was used to determine the haplotype frequency ofS. subarctica/S. sclerotiorumisolates for each country based on the relative number of repeats at each microsatellite locus and to identify shared haplotypes. Genodive (Meirmans and van Tienderen, 2004) was used to calculate gene diversity (Hs) for each locus (Nei, 1987) and the average across all loci and furthermore generate clonal (haplotype) diversity statistics for each Sclerotinia species in the different countries. These comprised haplotype diversity (div) (Nei, 1987) and a corrected form of the Shannon-Wiener Index (shc). The former is based on frequencies of haplotypes in each population while the latter is based on the abundance and evenness of haplotypes. Whiledivis independent of sample size (Nei, 1987) the Shannon index is prone to bias when comparing unequal sample sizes. However, the corrected form calculated in Genodive accounts for this through a non-parametric approach which uses unequal probability sampling theory (Chao and Shen, 2003). Calculations of both divand shc as implemented in Genodive also included a jackknife approach to estimate the relationship between sample size and diversity and in all cases, the variance in diversity decreased with increasing population size and leveled off below the population size sampled. A bootstrap test (1,000 permutations) also implemented in Genodive allowed us to test if Sclerotinia populations from different countries differed in their haplotype diversity as measured by div and shc. POPPR (Kamvar et al., 2014) was used to calculate multilocus indices
of disequilibrium; the index of association IA and the index ¯rd which accounts for the number of loci (Agapow and Burt, 2001). ARLEQUIN was used to test for subdivision for both
S. sclerotiorum and S. subarctica populations from different countries and was estimated through pairwise comparisons of
RST (Slatkin, 1995), a statistic which uses a stepwise mutation
model which has been widely implemented for microsatellite data [including forS. sclerotiorume.g.,Aldrich-Wolfe et al. (2015)], with significance tested by permuting (1,023) haplotypes between populations. The analysis forS. sclerotiorumincluded data sets for the 12 English S. sclerotiorum populations (384 isolates,
Table 1) published previously (Clarkson et al., 2013).
S. subarctica and S. sclerotiorum microsatellite data were subjected to Bayesian population structure analyses using STRUCTURE v2.3.3 (Pritchard et al., 2000), an approach used previously for Sclerotinia spp. (Attanayake et al., 2013, 2014; Njambere et al., 2014). The markers used in this study map to different chromosomes of theS. sclerotiorumreference genome (Amselem et al., 2011) with the exception of 7-2 and 114-4 which both map to chromosome 4 and 13-2 and 110-4 which both map to chromosome 6. These pairs that map to the same chromosomes were shown byAttanayake et al. (2014)to be of sufficient distance for LD to decay (Bastien et al., 2014) and therefore satisfy the assumptions of STRUCTURE. A burn-in period of 300,000 Markov Chain Monte Carlo iterations and a 300,000 run-length was implemented using an admixture model and correlated allele frequencies for K values between 1 and 6. For each simulated cluster for K = 1–6, four runs were repeated independently for consistency. For theS. sclerotiorum
data, this was followed by a second analysis using a burn-in period of 500,000 Markov Chain Monte Carlo iterations and a 500,000 run-length implemented using an admixture model and correlated allele frequencies forK values between 3 and 5. Again, for each simulated cluster forK =3–5, four runs were repeated independently. For bothSclerotiniaspecies, the python script structure Harvester.py v0.6.92 (Earl and vonHoldt, 2012) was then used to summarize the STRUCTURE output, producing ∆K values using the Evanno method (Evanno et al., 2005) to estimate the most likely underlyingK. Replicate simulations of cluster membership (q-matrices) at K = 4 for S. sclerotiorum
isolates andK =2 forS. subarcticaisolates were used as input for CLUMPP_OSX.1.1.2 (Jakobsson and Rosenberg, 2007) using the Fullsearch algorithm, with weighted H and the G similarity statistic. Summarized cluster membership matrices (q-values) for both individuals and populations were then visualized using distruct_OSX1.1 (Rosenberg, 2004).
The microsatellite data represented a multivariate dataset and to reduce the complexity of the data, principal component analyses (PCA) were used to complement the STRUCTURE analyses. For bothSclerotiniaspecies, analyses were performed first on the microsatellite repeat size data, and then on an allele score matrix constructed by subdividing each microsatellite into repeat size categories, then scoring if the repeat size is present or absent in each isolate, forming a binary score data matrix. Principal components were estimated using the singular value decomposition method implemented in R v3.2.3 ( R-Development-Core-Team, 2015) using the built in “prcomp”
function and the package FactoMineR v1.31.4 (Lê et al., 2008). Scatter plots of the component scores were produced using ggplot2 (Wickham, 2016), with ellipses representing Euclidean distance from the center (confidence level=0.95) of each cluster.
Analysis of IGS Sequence Data for
Sclerotinia sclerotiorum
S. sclerotiorumIGS sequences were aligned using the ClustalW algorithm implemented in MEGA v6 (Tamura et al., 2013) and DNASP v. 5 (Librado and Rozas, 2009) was used to identify haplotypes based on sequence differences (omitting indels), calculate haplotype diversity and also used to examine subdivision between populations from different countries using pairwise comparisons of the nearest neighbor statistic (Snn) (Hudson, 2000) with significance calculated with 1,000 permutations. Again, data sets for the 12 EnglishS. sclerotiorum
populations (384 isolates) published previously (Clarkson et al., 2013) were also included in the analysis. A median joining network of IGS haplotypes (Bandelt et al., 1999) which included sequence data from Canada, New Zealand, Norway, and the USA (Carbone and Kohn, 2001a) was constructed using NETWORK v. 4.6 (Fluxus Technology, USA) for all the datasets from England, Scotland, Norway, and Australia.
RESULTS
Molecular Identification and Frequency of
Sclerotinia subarctica
A total of 843Sclerotiniaisolates were collected from crop plants and buttercup in England (337), Scotland (404), and Norway (102). Identification through amplification of the LSU rDNA showed that 142 of these wereS. subarctica(Table 1) with the proportion rising to 157 of 1,255 isolates when previous data from England (412 isolates) was included (Table 1).S. subarctica
was detected on a wide range of host plants and there was increased incidence in samples collected from Scotland and Norway. In England, only 35 of 749Sclerotiniaisolates (4.7%) were S. subarctica and these were all isolated from a single buttercup meadow in Herefordshire over 3 years (2009–2011). In Scotland however, 74 of 404 isolates (18.3%) wereS. subarctica
and were found in the majority of crops, locations and years between 2010 and 2013. In Norway, 49 of 102Sclerotiniaisolates (48.0%) collected in 2012/2013, again from a wide range of crop types and locations were identified asS. subarctica. Identity of allS. subarcticaisolates was further confirmed by sequencing of the rRNA ITS region and all sequences were identical to that previously deposited in Genbank (GU018183) (Clarkson et al., 2010).
Molecular Characterization of
Sclerotinia
subarctica
Isolates Using Microsatellites
Microsatellite analysis of theS. subarcticaisolates resulted in 5 to 10 polymorphic alleles per locus, with loci MS01, MS02, MS03, MS04, MS05, MS06, MS07, and MS08 having 10, 6, 5, 10, 5, 7, 7, and 6 alleles respectively (Table 2). Two of the loci (MS02 and MS04) were monomorphic for the isolates from England. Overall, 75 microsatellite haplotypes were identified within the
157 S. subarctica isolates genotyped from England, Scotland, and Norway (Figure 1A). The number of different haplotypes as a proportion of the total number of isolates differed between countries, England having fewer haplotypes (14%; 5 haplotypes within 34 isolates) compared to Scotland (51%; 38 haplotypes within 74 isolates) and Norway (82%, 40 haplotypes within 49 isolates). Over all the 75 S. subarctica haplotypes, 18 were represented by more than one isolate with eight shared between Scotland and Norway but none shared between England and Scotland or England and Norway (Figure 1A). A few haplotypes were sampled more frequently than the rest. The most prevalent haplotypes in England were haplotypes 1 and 4 (19 and 7 isolates respectively;Table 3) and both were found in each of the 3 years sampling at the buttercup meadow in Herefordshire. Haplotypes 2 and 3 were most prevalent for both Scotland and Norway (19 and 15 isolates respectively; Table 3) and were represented in samples from potato, buttercup and swede (Scotland) and carrot, lettuce and swede (Norway). Haplotype diversity measuresdiv
andshcwere significantly lower for theS. subarcticaisolates from England compared to Scotland and Norway (Table 4;P<0.001) as was the diversity in Scotland compared to Norway (P<0.05). The index of associationIA forS. subarcticamicrosatellite data ranged between 0.57 (Norway) and 2.9 (England) while¯rd was
between 0.08 (Norway) and 0.58 (England). Significance testing showed that the hypothesis of random mating was rejected in all cases (P <0.001;Table 4). This was also true when clone-corrected data was used in the analysis (Table 4). There was also evidence of subdivision between the S. subarctica populations from the three different countries with theRST fixation index statistic highly significant (P<0.0001) for pairwise combinations of England/Scotland (RST =0.637) and England/Norway (RST
= 0.591). However, this was less significant (P < 0.05) for the Scotland/Norway combination (RST = 0.030) as might be
expected given some sharing of haplotypes.
The Bayesian cluster analysis of theS. subarcticamicrosatellite data using STRUCTURE suggested two genetically distinct ancestral populations (K = 2, being the value associated with the highest value of ∆K). Examining the probability of each isolate belonging to either of the two sub-populations described by the membership coefficient matrix, all 34 of the isolates from buttercup collected from the single site in Herefordshire (Michaelchurch Escley) in England between 2009 and 2012 were assigned to clusterq1, whereas all the isolates from Norway (49) and 68 of the 74 (92%) isolates from Scotland were assigned to
q2 (Figure 2A). This suggests that the majority of the isolates from Norway and Scotland share a common ancestry. However, six of the Scottish isolates (SC52-SC57), which were all collected from meadow buttercup at a site near Dunfermline (Fife) in 2012 were assigned toq1 and hence appear to share ancestry with the English isolates. The reduced genetic diversity in the English isolates and the shared ancestry of Scottish and Norwegian S. subarcticaisolates was also evident in the principal component analysis using either microsatellite repeat number or the binary matrix. The first principal component clearly distinguished Scottish and Norwegian isolates from the English isolates and the reduced genetic variation of the English isolates was indicated by the reduced space they occupied in the PCA map, particularly in dimension 2 (Figures 3A,B).
TABLE 2 | Summary of microsatellite data forS. subarcticaisolates from England, Scotland, and Norway.
Locus1 Allele size range Total alleles Number of alleles Number of private alleles Gene diversity (Hs)2
ENG SCO NOR ENG SCO NOR ENG SCO NOR ENG SCO NOR
MS01 129–146 128–184 128–161 10 3 6 7 1 3 2 0.358 0.515 0.677 MS02 174 161–193 162–180 6 1 6 4 0 0 2 0.000 0.352 0.290 MS03 193–203 170–194 184–193 5 2 3 3 1 1 1 0.166 0.442 0.371 MS04 189 175–200 178–211 10 1 8 5 0 2 5 0.000 0.733 0.742 MS05 320–346 317–333 317–331 5 3 4 2 1 0 0 0.358 0.592 0.505 MS06 378–424 348–416 370–408 7 4 6 4 1 0 2 0.629 0.417 0.616 MS07 372–389 362–374 362–382 7 3 2 5 2 3 0 0.597 0.151 0.330 MS08 378–394 371–383 371–391 6 3 2 5 1 2 0 0.597 0.151 0.297 Mean 7.0 2.5 4.6 4.4 0.9 1.4 1.5 0.338 0.419 0.479
1Loci as defined byWinton et al. (2007). 2Nei’s gene diversity (Nei, 1987).
Molecular Characterization of
Sclerotinia
sclerotiorum
Isolates Using Microsatellites
Microsatellite analysis of theS. sclerotiorumisolates resulted in 7 to 19 polymorphic alleles per locus, with loci 7-2, 8-3, 13-2, 17-3, 55-4, 92-4, 110-4, 114-4 having 11, 15, 19, 20, 20, 7, 8, and 2 alleles respectively (Table 5). Overall, 484 microsatellite haplotypes were identified within the 800S. sclerotiorumisolates that were genotyped (Figure 1B). In England, 343 haplotypes were found within 600 isolates (57%), with 64 (74%), 50 (94%), and 42 haplotypes (70%) identified within 87, 53, and 60 isolates from Scotland, Norway, and Australia respectively. Over all 800 S. sclerotiorum haplotypes, 95 were represented by more than one isolate while 15 were shared between England and Scotland (Figure 1B). No haplotypes were shared between any other countries. In each country, there were a small number of haplotypes sampled more frequently than the rest. In England, 68 isolates representing the most prevalent haplotype 1 were found in the majority of hosts and locations sampled and a further single representative was identified in Scottish buttercup (Figure 1B,Table 6). The second most prevalent haplotype 2 in England comprised 25 isolates from different buttercup meadows but was only identified in a single crop location (lettuce, three isolates). Haplotype 2 was also found in two buttercup meadows (four isolates, 2011; Table 6) in Scotland. However, the most prevalent haplotype 18 in Scotland was represented by five isolates found in two different buttercup locations (2011) and in carrot (2010) (Table 6), but was not present in England. Haplotype 16 comprising four isolates from buttercup and carrot in Scotland (Table 6) was also found in one buttercup meadow in England (Holywell, 2008). In Norway, the most prevalent haplotypes were haplotype 89, 90, and 91 each of which was represented by just two isolates from oilseed rape, pumpkin, and turnip rape hosts while the two most prevalent haplotypes 10 and 11 in Australia both comprised six isolates each from oilseed rape and lupin from different locations (Table 6).
Haplotype diversity measures of div and shc for the S. sclerotiorummicrosatellite data were generally high for England Scotland and Norway but lower for the Australian isolates
(Table 7) but this was only significant for the Norway/Australia pairwise combination for div (P < 0.05). However, pairwise comparisons showed that shc was significantly greater for England compared to Scotland (P <0.05) and Australia (P < 0.01) while shc was significantly greater in Norway compared to all the other three countries (P < 0.001). There was also evidence of genetic differentiation between theS. sclerotiorum
populations from the four different countries with the RST fixation index statistic highly significant (P < 0.0001) for pairwise combinations of England/Norway (RST = 0.094),
England/Australia (RST = 0.186), Scotland/Norway (RST =
0.068), Scotland/Australia (RST=0.152), and Norway/Australia
(RST = 0.198). Differentiation between England/Scotland was
less significant (P<0.01,RST=0.015). The index of association
IA for S. sclerotiorummicrosatellite data ranged between 0.26 (Norway) and 0.95 (Australia) while r¯d was between 0.04
(Norway) and 0.14 (Australia). Significance testing showed that the hypothesis of random mating was rejected in all cases (P< 0.001;Table 7). This was also the case when clone-corrected data was used in the analysis (Table 7).
The Bayesian cluster analysis of the S. sclerotiorum
microsatellite data using STRUCTURE suggested the number of genetically distinct ancestral populations was best represented byK =4 clusters, the value associated with the highest value of ∆K (Figure 2B) The majority of English isolates were assigned to clusterq1 (251, 42%) andq4 (189, 32%) followed byq2 (84, 14%) and to a lesser extentq3 (53 isolates, 9%). Similarly, most of the Scottish isolates were also assigned to clusterq1 (60 isolates, 69%) with the remainder approximately equally divided between
q3 andq4. Norwegian isolates were predominantly assigned to eitherq3 orq4 populations, while the Australian isolates were all associated with clusterq3. Overall this suggests a shared ancestry for the English and Scottish isolates throughq1and q4, while the Norwegian isolates appear to share ancestry with England, Scotland, and Australia viaq3andq4(Figure 2B).
Principal component analysis using the microsatellite repeat size data separated the isolates into broad clusters representing country of origin (Figure 3C). However, the extensive diversity
FIGURE 1 | Microsatellite haplotype frequency for (A)157S. subarcticaisolates from England, Scotland, and Norway;(B)800S. sclerotiorumisolates from England, Scotland, Norway, and Australia for 95 haplotypes comprising more than one isolate.
captured in the English isolates led to a spread of these isolates across the first component space, overlapping with the Australian, Scottish, and Norwegian isolates and the second component failed to resolve the different populations into clear clusters. When the binary matrix values of the microsatellite data were used, the number of variables increased from 8 to 122 thereby enhancing the discriminative power of the principal component analysis. This resulted in the isolates being resolved into clear population clusters, with the English and Scottish isolates being grouped together, and the Norwegian
and Australian isolates forming individual distinct clusters (Figure 3D), which confirmed the results of the STRUCTURE analysis.
Molecular Analysis of
Sclerotinia
sclerotiorum
Isolates Using IGS
Sequencing
In total, 26 IGS haplotypes were identified within the 870 S. sclerotiorum isolates (Table 8) from England (600 isolates),
TABLE 3 | Location, year, host, and frequency of most commonS. subarcticamicrosatellite haplotypes in England, Scotland, and Norway. Location Year Host/crop Microsatellite haplotype1
hap 1 hap 2 hap 3 hap 4 ENGLAND
Michaelchurch Escley, Herefordshire 2009 Meadow buttercup 9 0 0 3
Michaelchurch Escley, Herefordshire 2010 Meadow buttercup 2 0 0 2
Michaelchurch Escley, Herefordshire 2011 Meadow buttercup 8 0 0 2
Total 19 0 0 7
SCOTLAND
Eyemouth, Berwickshire 2013 Potato 0 3 8 0
Isla Bend 2012 Potato 0 6 0 0
Dunfermline, Fife 2012 Meadow buttercup 0 3 0 0
Meigle, Perthshire 2012 Pea 0 3 3 0
Total 0 15 11 0 NORWAY Rogaland 2013 Lettuce 0 1 1 0 Vest-Agder 2013 Lettuce 0 1 2 0 Vestfold 2013 Swede 0 1 0 0 Hedmark 2013 Carrot 0 1 1 0 Total 0 4 4 0 Grand total 19 19 15 7
1Two microsatellite haplotypes most prevalent in England (1 and 4), Scotland, and Norway (2 and 3).
TABLE 4 | Diversity statistics and disequilibrium measures forS. subarcticaisolates from England (ENG), Scotland (SCO), and Norway (NOR) based on microsatellite data.
No. isolates No. haplotypes No. unique haplotypes1 shc2 div3 IA4all clones IA4clone corrected r¯4dall clones r¯4dclone corrected
ENG 34 5 5 0.560 0.642 2.874*** – 0.581*** –
SCO 74 38 30 1.610 0.932 0.779*** 0.259** 0.113*** 0.040**
NOR 49 40 32 2.096 0.987 0.567*** 0.485*** 0.081*** 0.070***
1Haplotypes not found in any other country.
2Shannon-Wiener Diversity corrected for sample size (Chao and Shen, 2003). 3Haplotype diversity corrected for sample size (Nei, 1987).
4Index of Association (I
A) and related measure¯rd(Agapow and Burt, 2001) for all clones and clone corrected data.***(P<0.001);**(P<0.006). Not calculated for clone corrected data from England due to small number of haplotypes.
Scotland (87 isolates), Norway (52 isolates), and Australia (131 isolates). The most common haplotype was IGS3 (333 isolates), found in all three countries, closely followed by IGS2 (269 isolates) which was found in all countries except for Australia. In England, IGS3 (297 isolates) and IGS2 (179 isolates) were the most common haplotypes and were represented by isolates from every location and crop type as well as buttercup. In Scotland, the most prevalent haplotype was IGS2 (49 isolates) followed by IGS1 (16 isolates), both represented in all the buttercup and carrot populations genotyped. In Norway, the most prevalent haplotype was IGS2 (41 isolates) found in cabbage, camelina, lettuce, oilseed rape, and turnip rape from different locations. Conversely in Australia, the most common haplotype was IGS5 (58 isolates) followed by IGS7 (45 isolates) found in both lupin and oilseed rape across the majority of locations. A total of nine
IGS haplotypes (IGS4, 8, 9, 10, 11, 12, 13, 20, 23) from England and Scotland were exclusively found in buttercup isolates. With these data, the haplotype network first published by Clarkson et al. (2013) was expanded considerably from 17 to 26 IGS haplotypes (Figure 4). The nine new haplotypes were from England (IGS18, Vowchurch oilseed rape 2009; IGS19, Sutton Bridge oilseed rape 2010; IGS20, Michaelchurch buttercup site 2, 2010), Australia (IGS21, oilseed rape different locations; IGS22, Mount Barker oilseed rape 2004), Scotland (IGS23, Dunfermline buttercup 2011), and Norway (IGS24, Buskerud lettuce 2013; IGS25, Nord-Trøndelag potato 2013; IGS26, Buskerud pumpkin 2013) (Genbank accession numbers KY798871-KY798879). The nearest neighbor statistic Snn values indicated that populations ofS. sclerotiorumfrom different countries were all significantly differentiated from each other (Table 9).
FIGURE 2 | Bar plots showing the assignment of (A)S. subarcticaisolates (N=157) from England (ENG,N=34), Scotland (SCO,N=74), and Norway (NOR,N =49) to two ancestral populations and(B)S. sclerotiorumisolates (N=800) from Australia (AUS,N=60), England (N=600), Scotland (N=87), and Norway (N= 53) to three ancestral populations from STRUCTURE analysis of microsatellite data. Assignment to populations is based on q values for each isolate (S. subarcticaq1 green, q2 purple;S. sclerotiorumq1 red, q2 green, q3 yellow, q4 blue) and population q values for each country (A, Australia; E, England; S, Scotland; N , Norway.).
TABLE 5 | Summary of microsatellite data forS. sclerotiorumisolates from England (ENG), Scotland (SCO), Norway (NOR), and Australia (AUS). Locus1 Allele size range Total
alleles
Number of alleles Number of private alleles Gene diversity (Hs)2 ENG SCO NOR AUS ENG SCO NOR AUS ENG SCO NOR AUS ENG SCO NOR AUS
7–2 159–175 170–173 156–172 162–236 11 5 2 4 6 3 0 2 4 0.593 0.332 0.491 0.583 8–3 228–260 252–256 246–252 252–270 15 9 3 4 8 4 0 2 4 0.617 0.326 0.557 0.637 13–2 278–382 300–359 289–349 278–373 19 18 8 7 10 3 0 0 1 0.791 0.701 0.758 0.868 17–3 342–394 341–401 339–368 336–377 20 16 11 8 9 3 0 2 2 0.745 0.761 0.751 0.868 55–4 149–217 154–238 155–220 157–185 20 15 10 9 4 6 2 1 0 0.702 0.717 0.821 0.436 92–4 370–381 370–379 369–379 373–379 7 7 5 5 4 1 0 0 0 0.564 0.509 0.525 0.666 110–4 352–387 352–387 368–383 368–383 8 8 7 4 3 1 0 0 0 0.717 0.495 0.568 0.579 114–4 345–421 349–388 350–390 356–408 21 20 10 7 9 6 0 0 1 0.835 0.810 0.750 0.847 Mean 15.1 12.3 7.0 6.0 6.6 3.4 0.3 0.9 1.5 0.695 0.581 0.653 0.686
1Loci as defined bySirjusingh and Kohn (2001). 2Nei’s gene diversity (Nei, 1987).
DISCUSSION
There has been very little research concerning S. subarctica
following the initial rDNA-based phylogeny ofSclerotiniaspecies byHolst-Jensen et al. (1998)and the first report of the pathogen on crop plants in Alaska (Winton et al., 2006) where it was identified on potato, lettuce, cabbage, bean, and squash. This study shows for the first time a clear increase in the incidence ofS. subarcticawith increasing latitude from England, through to Scotland and Norway. In England, the pathogen appears to be insignificant compared to S. sclerotiorum, being identified in only one location (where originally first reported;Clarkson et al., 2010) on meadow buttercup despite widespread sampling. However, a much higher proportion of theSclerotiniasamples were identified asS. subarctica in Scotland (18%) and Norway (48%) with the latter very similar to the 46% reported in Alaska (Winton et al., 2006). Both Alaska and Norway occupy very
similar latitude ranges.S. subarcticawas also widely distributed across different crop plants and buttercup with new hosts reported here for the first time of carrot, celery root, Jerusalem artichoke, pea, and swede. This finding is therefore further evidence thatS. subarcticahas a broad host range similar toS. sclerotiorumorS. minor.
The reasons for the prevalence of S. subarcticain northern latitudes are unclear although it has been suggested that the larger sclerotia the pathogen generally produces may confer a survival advantage over S. sclerotiorum in harsh winters (Winton et al., 2006). Furthermore, we hypothesize that S. subarctica sclerotia may require an increased chilling requirement for rapid germination and apothecial production compared to S. sclerotiorum as observed in preliminary experiments (Warmington, 2014). If this is the case, then a lack of adequate cold temperature durations may therefore limit its reproductive ability, hence slowing down its spread
FIGURE 3 | Principal component analysis of microsatellite data forS. subarcticaisolates from England (N=34), Scotland (N=74), and Norway (N=
49) andS. sclerotiorumisolates from Australia (N=60), England (N=600), Scotland (N=87), Norway (N=53). (A)S. subarcticaindividuals factor map estimated using microsatellite repeat number;(B)S. subarcticaindividuals factor map estimated using an allele presence binary matrix;(C)S. sclerotiorumindividuals factor map estimated using microsatellite repeat number;(D)S. sclerotiorumindividuals factor map estimated using an allele presence binary matrix. Individual isolates are colored by geographic origin. Ellipses represent the Euclidean distance from the center (confidence level=0.95) of each cluster.
further south. A requirement for cold “conditioning” for S. sclerotiorum sclerotia is well-documented for isolates from temperate regions (Phillips, 1987) although germination response to different temperature regimes varies between isolates from different geographic origins (Huang and Kozub, 1991). This, along with the extensive distribution of
S. sclerotiorum (Anonymous, 2005), suggests adaptation to a much wider range of conditions for apothecial production than forS. subarctica.
This is the first study to extensively examine the population structure ofS. subarcticaand the finding that there are multiple
clones (haplotypes) suggests a very similar reproductive strategy to S. sclerotiorum based on homothallic sexual reproduction through carpogenic germination of sclerotia. This is confirmed by observations of apothecial production byS. subarcticaboth in the laboratory (Warmington, 2014) and in the field (Winton et al., 2006). Furthermore, measures of linkage disequilibrium in theS. subarcticapopulations were significant which is again consistent with a selfing clonal population. This was also the case for theS. subarcticapopulation from Alaska (Winton et al., 2007). This confirms the majority of studies withS. sclerotiorumwhere evidence of outcrossing is generally infrequent. However, more
TABLE 6 | Location, year, host, and frequency of the most prevalentS. sclerotiorummicrosatellite haplotypes in England (Hap 1, 2, 3), Scotland (Hap 2, 16, 18), Norway (Hap 89, 90, 91), and Australia (Hap 10, 11).
Year Hap 1 Hap 2 Hap 3 Hap 16 Hap 18
ENGLAND AND WALES
Blyth, Nottinghamshire 2005 Carrot 5 0 0 0 0
Petworth, Sussex 2005 Lettuce 4 3 2 0 0
Preston Wynn, Herefordshire 2005 Oilseed Rape 3 0 0 0 0
Holywell, Warwickshire 2007 Meadow buttercup 6 1 0 0 0
Preston Wynn, Herefordshire 2007 Oilseed rape 3 0 0 0 0
Deans Green, Warwickshire 2008 Meadow buttercup 2 10 1 0 0
Holywell, Warwickshire 2008 Meadow buttercup 4 0 0 1 0
Deans Green, Warwickshire 2009 Meadow buttercup 5 3 0 0 0
Elan Valley, Powys 2009 Meadow buttercup 0 2 0 0 0
Methwold, Norfolk 2009 Celery cv. Victoria 1 0 8 0 0
Michaelchurch Escley, Herefordshire 2009 Meadow buttercup 4 2 0 0 0
Sutton St Nicholas, Herefordshire 2009 Pea cv. Setchey 5 0 0 0 0
Vowchurch, Herefordshire 2009 Oilseed Rape 2 0 3 0 0
Michaelchurch Escley 1, Herefordshire 2010 Meadow buttercup 0 4 0 0 0
Michaelchurch Escley 2, Herefordshire 2010 Meadow buttercup 3 1 0 0 0
Sutton Bridge, Lincolnshire 2010 Oilseed Rape 9 0 0 0 0
Upwood, Cambridgeshire 2010 Meadow buttercup 8 0 0 0 0
Vowchurch, Herefordshire 2010 Oilseed Rape 3 0 1 0 0
Michaelchurch Escley, Herefordshire 2011 Meadow buttercup 1 2 1 0 0
Total 68 28 16 1 0
SCOTLAND
Coupar Angus, Perthshire 2010 Carrot cv. Nairobi 0 0 0 1 1
Bo’ness, West Lothian 2011 Meadow buttercup 1 3 0 2 2
Dunfermline, Fife 2011 Meadow buttercup 0 1 0 1 2
Total 1 4 0 4 5
Hap 89 Hap 90 Hap 91 NORWAY
Buskerud (2 sites; A, B) 2013 Lettuce (A), pumpkin (B) 1 (B) 0 0
Oppland 2013 Turnip rape 0 2 2
Vestfold 2013 Oilseed Rape 1 0 0
Total 2 2 2
Hap 10 Hap 11 AUSTRALIA
Walkaway 2004 Oilseed Rape 0 1
East Chapman (3 sites; A, B,C) 2010 Oilseed Rape 2 (B) 1 (B)
Moonyoonooka (2 sites; A, B) 2010 Lupin 2 (B) 1 (A)
Walkaway (3 sites; A, B, C) 2010 Oilseed Rape 2 (A) 3 (A, B)
Total 6 6
recent analyses using linkage disequilibrium decay with distance indicates that outcrossing can be much more common than is suggested solely by measurement ofIA(Attanayake et al., 2014).
Compared to the preliminary study in Alaska (Winton et al., 2007) where only four microsatellite haplotypes were identified
within 41S. subarcticaisolates (10% of maximum), we identified a more diverse range of haplotypes in Scotland and Norway with 38 and 40 haplotypes found within 74 and 49 isolates respectively (51 and 82% of maximum). Furthermore, only 2–3 alleles were identified per locus in the Alaskan work compared to 5–10 alleles
FIGURE 4 | Median joining networks showing phylogenetic relationships between IGS haplotypes forS. sclerotiorumisolates from Australia, England, Scotland, and Norway (this study) and Canada, USA, New Zealand and Lesser Celandine (R. ficaria) in Norway (Carbone and Kohn, 2001a).The size of each circle is proportional to the corresponding haplotype frequency. Branch lengths are proportional to the number of base substitution changes. A median vector represents a hypothesized haplotype required to connect existing haplotypes within the network.
TABLE 7 | Diversity statistics and disequilibrium measures forS. sclerotiorumisolates from England (ENG), Scotland (SCO), Norway (NOR), and Australia (AUS) based on microsatellite data.
No. isolates No. haplotypes No. unique haplotypes1 shc2 div3 I
A4all clones IA4clone corrected r¯4dall clones r¯4dclone corrected
ENG 600 343 328 2.536 0.982 0.762*** 0.241*** 0.110*** 0.035***
SCO 87 64 49 2.133 0.990 0.662*** 0.542*** 0.095*** 0.078***
NOR 53 50 50 2.652 0.998 0.257*** 0.181** 0.037*** 0.026**
AUS 60 42 42 1.904 0.979 0.945*** 0.579*** 0.138*** 0.090***
1Haplotypes not found in any other country.
2Shannon-Wiener Diversity corrected for sample size (Chao and Shen, 2003). 3Haplotype diversity corrected for sample size (Nei, 1987).
4Index of Association (I
A) and related measurer¯d(Agapow and Burt, 2001) for all clones and clone corrected data.***(P<0.001);**(P<0.006).
in this study. One possible explanation for this is that the Alaskan isolates were all collected from a confined area in the Matanuska Valley which was only developed for agriculture in the early 1900s. Therefore, there has been less opportunity for immigration of differentS. subarcticahaplotypes via crop plant or soil-based introductions compared to Scotland or Norway.
Another significant finding in our study is that a few S. subarctica haplotypes were found more frequently than the rest across multiple crops and locations. For instance, two microsatellite haplotypes which were the most prevalent in both Scotland and Norway were identified in 13 different locations in crops of carrot, lettuce, pea, potato, swede as well as buttercup. Scotland and Norway also shared a further six microsatellite haplotypes. This therefore follows the same
pattern of distribution as observed for S. sclerotiorum both in this study and in previous research (Kohli et al., 1992; Kohn, 1995; Hambleton et al., 2002). The common haplotypes between Scotland and Norway suggests either a common origin and/or exchange of isolates and admixture between these twoS. subarcticapopulations. This was supported by the STRUCTURE and PCA analyses where the majority of isolates from each country were assigned to the same clusters. Therefore, as suggested for S. sclerotiorum (Kohn, 1995; Hambleton et al., 2002), it seems likely that certainS. subarcticahaplotypes persist following initial immigration due to the longevity of sclerotia in the soil with new haplotypes arising locally through mutation and infrequent outcrossing. Haplotypes present across multiple hosts including both crop plants and buttercup for bothS. subarctica
andS. sclerotiorumin this study confirms previous reports that there is no evidence for host specialization (Bolton et al., 2006) in either pathogen and that wild hosts can also potentially act
TABLE 8 | IGS haplotype frequency and diversity forS. sclerotiorum
isolates from England, Scotland, Norway, and Australia.
Haplotype England Scotland Norway Australia Total
IGS1 44 16 3 0 63 IGS2 179 49 41 0 269 IGS3 297 12 3 21 333 IGS4 15 0 0 0 15 IGS5 4 2 1 58 65 IGS6 19 6 0 0 25 IGS7 17 1 0 45 63 IGS8 10 0 0 0 10 IGS9 4 0 0 0 4 IGS10 1 0 0 0 1 IGS11 1 0 0 0 1 IGS12 2 0 0 0 2 IGS13 2 0 0 0 2 IGS14 2 0 0 0 2 IGS15 0 0 0 0 0 IGS16 0 0 1 0 1 IGS17 0 0 0 0 0 IGS18 1 0 0 0 1 IGS19 1 0 0 0 1 IGS20 1 0 0 0 1 IGS21 0 0 0 6 6 IGS22 0 0 0 1 1 IGS23 0 1 0 0 1 IGS24 0 0 1 0 1 IGS25 0 0 1 0 1 IGS26 0 0 1 0 1 Total isolates 600 87 52 131 870 No. haplotypes 17 7 8 5 Haplotype diversity 0.659 0.632 0.377 0.663
as a source of inoculum on crop plants as well as enabling the pathogen to survive in the absence of a susceptible crop host.
In England however, S. subarcticawas restricted to a single buttercup meadow in Herefordshire where repeated detection of the same microsatellite haplotypes each year indicated continual survival and cycling of the same pathogen isolates. Although repeat sampling of this meadow makes direct comparisons with the populations from Scotland and Norway problematic, none of the EnglishS. subarcticamicrosatellite haplotypes were found in Scotland or Norway and they were also clearly assigned to a different population cluster in both the STRUCTURE and PCA analyses. The lack of evidence for admixture in the English isolates suggests that the same ancestral population has endured in isolation without any influx of additional genetic diversity resulting in fixation of alleles. This may have been caused by a founder effect following an initial introduction, with the initial population being a skewed sampling of the alleles from an overall larger population. Evidence for the isolation of the EnglishS. subarctica population was further supported by highly significant differentiation from Scottish and Norwegian populations and as well as low genetic diversity with only five microsatellite haplotypes identified. A similar situation was described for an isolatedS. sclerotiorumpopulation onR. ficaria
in Norway which was characterized by low diversity and apparent localized inbreeding (Kohn, 1995). In addition, despite the availability of susceptible hosts in the area S. subarctica was not identified elsewhere locally. For instance, no S. subarctica
was identified in an adjacent buttercup meadow (Michaelchurch Escley2, Herefordshire) approx. 100 m away (but separated by a road and hedges), although affected by S. sclerotiorum. Similarly,S. subarcticawas not detected in two different oilseed rape fields 6 km away (Vowchurch 2009 and 2010), where S. sclerotiorumwas again identified. This could suggest a limited ability of S. subarctica to spread, despite its potential ability to produce airborne ascospores via apothecia (Winton et al., 2006; Warmington, 2014). However, studies withS. sclerotiorum
have shown that the majority of ascospores may only travel 40–60 m while long distance dispersal depends on wind speed and direction (Qandah and Del Rio Mendoza, 2012).
TABLE 9 | Nearest neighbor statistic (Snn values) forS. sclerotiorumpopulations from USA, Canada, New Zealand, Norway (Carbone and Kohn, 2001a), and England, Scotland, Australia, and Norway (Clarkson et al., 2013, this study).
USA1 Canada1 New Zealand1 Norway1 England2 Scotland2 Australia Norway
USA1 Canada1 0.849*** New Zealand1 0.795*** 0.543* Norway1 0.927*** 0.939*** 0.869*** England2 0.779*** 0.898*** 0.888* 0.916*** Scotland2 0.783*** 0.695*** 0.626** 0.787*** 0.796*** Australia 0.742*** 0.880*** 0.876*** 0.993*** 0.936*** 0.887*** Norway 0.824*** 0.811*** 0.667*** 0.821*** 0.871*** 0.565** 0.922***
1S. sclerotiorum IGS sequences published byCarbone and Kohn (2001a). Isolates from cabbage, groundnut, oilseed rape, radish, tobacco (USA); oilseed rape (Canada); hemp, kiwi fruit (New Zealand), and lesser celendine (Norway).
2Includes S. sclerotiorum IGS sequences published byClarkson et al. (2013). Isolates from hosts inTable 1. Snn values significant at***P
Populations of S. sclerotiorum from England, Scotland, Norway, and Australia were also analyzed in this study and in contrast to our previous work which only examined population structure at regional level in England (Clarkson et al., 2013), these additional isolates allowed us to examine populations at a different spatial (country) scale. Although clonal diversity measures were significantly lower for Australia compared to the other countries, especially for Hc, these estimates were comparable to other studies for S. sclerotiorum
using microsatellites (e.g., Attanayake et al., 2013; Aldrich-Wolfe et al., 2015). The 15 shared microsatellite haplotypes between England and Scotland, assignment of the majority of isolates to two common clusters in the STRUCTURE analysis and a common cluster in the PCA analysis indicated admixture of these populations from a common origin which would be expected in adjacent countries. In contrast, the Australian S. sclerotiorum isolates were quite different from English/Scottish isolates as they were all assigned to different clusters in the STRUCTURE/PCA analyses suggesting a different ancestry which most likely reflects their geographic separation. However, despite the S. sclerotiorum isolates from Norway being separated from English and Scottish isolates in the PCA analysis, some appeared to potentially share some ancestry with both England/Scotland and Australia in the STRUCTURE analysis. Furthermore, in contrast to S. subarctica, there were no shared haplotypes between S. sclerotiorum populations in Norway and Scotland. This would therefore suggest a different pattern of initial distribution ofS. sclerotiorumcompared toS. subarctica.
The IGS sequence data for S. sclerotiorum provided a different level of phylogenetic resolution than the microsatellite data and a further nine new IGS haplotypes were identified, adding to the original 17 described by Clarkson et al. (2013), for S. sclerotiorum populations from the UK and previously published sequence data for populations from Canada, New Zealand, Norway, and the USA (Carbone and Kohn, 2001a). However, the new haplotypes were at low frequency while haplotype IGS 3, which was previously commonly found within
S. sclerotiorum populations from all the above countries, was also identified in the Norwegian and Australian populations. The next most common haplotype IGS 2 was found in all countries except Australia. IGS sequencing therefore allows effective comparisons between different S. sclerotiorum populations globally and the frequency and relationship of the IGS haplotypes seen in the phylogenetic network continues to suggest the wide distribution of a small number of common haplotypes, with lower frequency haplotypes often emerging
from these at the local scale as suggested by Clarkson et al. (2013).
Overall therefore, S. subarctica populations from Scotland and Norway appear admixed, with a common origin and shared microsatellite haplotypes. The lower incidence ofS. subarcticain Scotland than in Norway and the rare occurrence of the pathogen in England may suggest a possible north-south migration and that the UK is at the limit of the pathogen’s southerly distribution. However, further data and analysis would be required to test this theory. In contrast, forS. sclerotiorum, English and Scottish populations were similar, with shared microsatellite haplotypes and a common origin for many of the isolates. The Norwegian population showed only partial evidence of a common ancestry, and as for the Australian population, was clearly distinguished by PCA analysis. This therefore suggests limited admixture and geographic isolation betweenS. sclerotiorum populations from the UK, Norway, and Australia.
AUTHOR CONTRIBUTIONS
JC conceived and obtained funding for the UK work, obtained isolates from diseased plants, carried out microsatellite
genotyping and IGS sequencing of S. sclerotiorum and
S. subarcticaisolates and wrote paper. RW obtained isolates from diseased plants, carried out microsatellite genotyping and IGS sequencing ofS. sclerotiorumandS. subarcticaisolates and co-wrote paper. PW carried out Structure and PCA analyses of microsatellite data and edited paper. MD obtained isolates from diseased plants and carried out IGS genotyping of Australian
S. sclerotiorum isolates. MB and GB obtained isolates from diseased plants and edited paper. BN conceived and obtained funding for the Norway work, obtained isolates from diseased plants and edited paper.
ACKNOWLEDGMENTS
We gratefully acknowledge funding from the UK Department for Food and Rural Affairs (Defra, project IF0188) and the Agriculture and Horticulture Development Board (AHDB, project CP80). The Norwegian contribution to this study was funded by Foundation for Research Levy on Agricultural Products/Agricultural Agreement Research Fund (research grant 207767), Regional Research Fund, Vestlandet (research grant 224787), with additional funding from agricultural industry partners and Norwegian lettuce growers. We also acknowledge funding from Australia’s Grains Research & Development Corporation (research grant CUR00023).
REFERENCES
Agapow, P.-M., and Burt, A. (2001). Indices of multilocus linkage disequilibrium. Mol. Ecol. Notes1, 101–102. doi: 10.1046/j.1471-8278.2000.00014.x
Aldrich-Wolfe, L., Travers, S., and Nelson, B. D. Jr. (2015). Genetic variation of Sclerotinia sclerotiorumfrom multiple crops in the North Central United States. PLoS ONE10:e0139188. doi: 10.1371/journal.pone.0139188
Amos, W., Hoffman, J., Frodsham, A., Zhang, L., Best, S., and Hill, A.
(2007). Automated binning of microsatellite alleles: problems and
solutions. Mol. Ecol. Notes 7, 10–14. doi: 10.1111/j.1471-8286.2006.
01560.x
Amselem, J., Cuomo, C. A., van Kan, J. A. L., Viaud, M., Benito,
E. P., Couloux, A., et al. (2011). Genomic analysis of the
necrotrophic fungal pathogens Sclerotinia sclerotiorum and Botrytis
cinerea. PLoS Genet. 7:e1002230. doi: 10.1371/journal.pgen. 1002230
Anonymous (2005).Distribution Maps of Plant Diseases (Edition 1).Sclerotinia