c
Copyright by Sakshi Jain
OWN AND SPILLOVER EFFECTS OF A CONDITIONAL
CASH TRANSFER PROGRAM TARGETING YOUNG
GIRLS: EVIDENCE FROM INDIA
A Dissertation Presented to
The Faculty of the Department of Economics
University of Houston
In Partial Fulfillment
Of the Requirements for the Degree of Doctor of Philosophy
By Sakshi Jain
OWN AND SPILLOVER EFFECTS OF A CONDITIONAL
CASH TRANSFER PROGRAM TARGETING YOUNG
GIRLS: EVIDENCE FROM INDIA
Sakshi Jain APPROVED: Aimee Chin, Ph.D. Commitee Co-Chair Willa Friedman, Ph.D. Commitee Co-Chair Fan wang, Ph.D. Santosh Kumar, Ph.D. Sam Houston State University
Antonio D. Tillis, Ph.D.
Dean, College of Liberal Arts and Social Sciences Department of Hispanic Studies
OWN AND SPILLOVER EFFECTS OF A CONDITIONAL
CASH TRANSFER PROGRAM TARGETING YOUNG
GIRLS: EVIDENCE FROM INDIA
An Abstract of a Dissertation Presented to
The Faculty of the Department of Economics
University of Houston
In Partial Fulfillment
Of the Requirements for the Degree of Doctor of Philosophy
By Sakshi Jain
Abstract
My dissertation evaluates both own and spillover effects of a conditional cash trans-fer program targeting young girls. The first chapter evaluates the effects of an ongoing conditional cash transfer (CCT) program in India targeting young girls that provides incentives in the form of deferred cash payments, with eligibility at birth and the largest payment coming at age 21. Using a difference-in-differences framework, I exploit varia-tion in exposure to LLY by birth cohort, state, and birth order to estimate the causal impact of the program on childrens health and educational outcomes, as well as the fer-tility behavior of parents. I find that the program significantly increased the likelihood of registering the births of daughters. However, the sex ratio at birth does not change, suggesting no change in female mortality. I find evidence of families having children faster and in turn reducing the birth spacing. However, parents are moving toward lower eventual family sizes as I find an increase in the likelihood of parents adopting sterilization. Finally, the results using math and reading test score data show some evidence of improvement in the education outcomes of daughters. Overall, I find that a financial incentive program plays a limited role in affecting the well-being of girls.
The second chapter paper evaluates the spill-over effects of an ongoing conditional cash transfer (CCT) program in India on the ineligible older siblings living in the same households as the eligible beneficiary. Using difference-in-differences framework, I exploit variation in exposure to LLY by birth cohort, state, and birth order to estimate the spillover effect of the program on the ineligible older sibling’s educational outcomes. I find that the program does not have any effect on the schooling outcomes of the ineligible siblings. I also find negative effect on the math and reading skills of the ineligible siblings of treated children relative to the children in families that received no treatment. The evidence suggests that this effect operates through the reallocation of resources away from the ineligible sibling towards the eligible sibling.
Acknowledgements
I express my sincere gratitude to my advisors and mentors, Dr. Aimee Chin and Dr. Willa Friedman, for their continued support, and guidance. I am grateful to Dr. Fan Wang for his insightful comments and encouragement. This project could not have been completed without their research expertise and patient supervision, all throughout my Ph.D. completion. Their incredible sense of dedication towards work and life has been a source of inspiration. The joy and enthusiasm they have for research is almost contagious and motivating, something that kept me going in the PhD pursuit and more so during the tough times.
I am thankful to all my colleagues, particularly Ashmita, Amrita, Somdeep, Max, Vinh, Sharon, Sergiy, Tung, for being wonderful colleagues and friends. I also thank my dear friends Gautham, Deepthi, Ankita, Deepanwita, and Suchi, for being an immense source of support and being a family away from home.
Finally, I could not have completed work on this dissertation without the continuous and unconditional support of my parents, Mr.Sudhir Kumar Jain and Mrs.Alka Jain who are not only my role models but also my pillars of strength in every walk of life. I am what I am today because of them and owe my everything to them. I also thank my brother and sister Siddharth, and Aashi, to them I express my deepest gratitude. Together, all four of them are my biggest strengths. I am thankful to both Sonal and Sonika for being there during the ups and downs of my life, always. It was my family’s unconditional love, encouragement and their belief in my capabilities, that I could complete work on this study. Thank you.
Contents
1 Effects of a Conditional Cash Transfer Program Targeting Young Girls:
Evidence from India 1
1.1 Introduction . . . 1
1.2 Related Literature . . . 6
1.3 Program Description . . . 8
1.4 Data . . . 10
1.4.1 Registered Births Data . . . 10
1.4.2 Female Share and Fertility Data . . . 11
1.4.3 Schooling and Cognitive Testing Data . . . 13
1.5 Identification Strategy and Estimating Equations . . . 14
1.5.1 Difference-in-Differences Strategy . . . 14
1.5.2 Triple Difference-in-Differences Strategy (DDD) . . . 16
1.6 Results . . . 18
1.6.1 Effects on Sex Ratio . . . 18
1.6.2 Effects on Fertility . . . 21
1.6.3 Effect on Schooling and Cognition . . . 26
1.7 Robustness . . . 27
1.8 Conclusion . . . 29
1.9 Figures . . . 36
1.11 Appendix . . . 53
2 Spillover Effects of a Conditional Cash Transfer Program on Ineligibles: Evidence from India 60 2.1 Introduction . . . 60
2.2 Program Description . . . 64
2.3 Data and Identification Strategy . . . 66
2.3.1 Data . . . 66 2.3.2 Estimating Equation . . . 67 2.4 Results . . . 70 2.5 Conclusion . . . 72 2.6 Figures . . . 79 2.7 Tables . . . 85 2.8 Appendix . . . 95 A Data Appendix 98 A.1 Civil Registration System Data . . . 98
A.2 India Human Development Survey, 2011-12 . . . 99
List of Figures
1.1 Cohort-specific Effects: Female Share in Registered Births Us-ing Official State Panel Data . . . 36 1.2 Female Share in Registered Births . . . 36 1.3 Cohort-specific Effects: Female Share at Birth using Household
Survey Data . . . 37 1.4 Cohort-specific Effects: Female Share at Birth by Birth Order
using Household Survey Data . . . 38 2.1 Cohort-specific Effects: Highest Grade Completed by the
Ineli-gible First Born . . . 79 2.2 Cohort-specific Effects: Likelihood of Ever Enrolled by the
In-eligible First Born . . . 80 2.3 Cohort-specific Effects: Likelihood of Currently Enrolled by the
Ineligible First Born . . . 81 2.4 Cohort-specific Effects: Current Grade of the Ineligible First
Born. . . 82 2.5 Cohort-specific Effects: Math Score of the Ineligible First Born 83 2.6 Cohort-specific Effects: Read Score of the Ineligible First Born 84
List of Tables
1.1 Incentive Structure of Ladli Laxmi Yojana . . . 39 1.2 Summary Statistics of Key Variables Using Official State Panel
Data . . . 40 1.3 Summary Statistics of Key Variables Using Household Survey
Data (Indian Human Development Survey) . . . 41 1.4 Summary Statistics of Key Schooling Variables Using Household
Survey Data (Annual Status of Education Report) . . . 42 1.5 Effect on Female Share and Sex Ratio Using Official State Panel
Data from Civil Registration System . . . 43 1.6 Effect on Female Share at Birth and at Older Ages using
House-hold Survey Data . . . 44 1.7 Effect on Total Number of Children . . . 45 1.8 Effect on Total Number of Children by Gender of the First Two
Children . . . 46 1.9 Effect on Sterilization by the Total Number of Children . . . 47 1.10 Likelihood of being sterilized after the policy, by gender of the
first two children . . . 48 1.11 Effect on Birth Spacing between the first and second child . . . 49 1.12 Effect on Schooling Outcomes for Females Aged 5-8 Years . . . . 50 1.13 Effect on Math Scores of Females Aged 5-8 Years . . . 51
1.14 Effect on Read Scores of Females Aged 5-8 Years . . . 52
A1 Impact of the Program on Birth Registration Using State Panel Data . . . 53
A2 Robustness Check by Dropping Comparison States One by One 54 A3 Effect on Total Number of Children, Women Aged 20-40 . . . . 55
A4 Effect on Sterilization by Number of Children, women aged 20-40 56 A5 Effect on Total Number of Children with state specific women’s cohort trends . . . 57
A6 Effect on Sterilization by Number of Children, with state specific women’s cohort trends . . . 58
A7 Placebo Test: Reassign intervention to alternate age groups . . 59
2.1 Summary statistics of key variables using ASER data . . . 85
2.2 Schooling outcomes of the ineligible older sister . . . 86
2.3 Schooling outcomes of the ineligible older brother . . . 87
2.4 Math test scores of the ineligible older sister . . . 88
2.5 Math test scores of the ineligible older brother . . . 89
2.6 Read test scores of the ineligible older sister . . . 90
2.7 Read test scores of the ineligible older brother . . . 91
2.8 Schooling outcomes of the ineligible older sister, aged 5-12 . . . 92
2.9 Schooling outcomes of the ineligible older brother, aged 5-12 . . 92
2.10 Math test scores of the ineligible older sister, aged 5-12 . . . 93
2.11 Math test scores of the ineligible older brother, aged 5-12 . . . . 93
2.12 Read test scores of the ineligible older sister, aged 5-12 . . . 94
2.13 Read test scores of the ineligible older brother, aged 5-12 . . . . 94
A1 Schooling outcomes of the ineligible older sister . . . 95
A2 Schooling outcomes of the ineligible older brother . . . 95
A4 Math test scores of the ineligible older brother . . . 96
A5 Read test scores of the ineligible older sister . . . 97
A6 Read test scores of the ineligible older brother . . . 97
A1 Variable Description . . . 98
A2 Variable Description . . . 99
Chapter 1
Effects of a Conditional Cash
Transfer Program Targeting Young
Girls: Evidence from India
1.1
Introduction
India has been struggling with a widening gender gap in most socio-economic indicators and the federal and state governments are making efforts to bridge these gaps. Pro-grams and policies have been introduced with the goal of improving the status of girls, particularly in terms of infant survival, health, and education. The government of Mad-hya Pradesh (MP), one of the poorest states in India, introduced such a program to empower young girls.1 The program, called Ladli Laxmi Yojana (LLY), was launched
and announced in 2007 and is the first conditional cash transfer (CCT) program in the state.
Beginning with Progresa in Mexico, CCT programs have been widely used to in-crease school enrollment and improve health outcomes of poor children. CCT programs
typically target school-aged children in poor households. Eligible families then receive cash payments conditional on children’s school attendance and (or) regular health check-ups. In brief, these programs induce the poor to invest in human capital development of their children without constraining their budget allocations. Earlier literature (Schultz, 2001; Skoufias and di Maro, 2006; Behrman and Parker, 2011) shows evidence of mostly positive impacts of CCT programs on school-aged children. These programs have been shown to have positive short-run effects on poverty and long-run effects on human capital development.
Although, there is a large literature of studies evaluating the conditional cash trans-fer (CCT) programs, analysis of this particular program is of interest because it diftrans-fers in design from traditional CCT programs like Progresa, on several dimensions. First, the program covers only first or second born girls, and from the time of birth. This is important in terms of addressing the issues of infant mortality and prenatal sex se-lective abortions. Second, the payments are deferred. They are made in installments starting from enrollment in grade sixth,followed by payments made at meeting eventual schooling targets, and the biggest payment comes at age 21. This raises the issue of how households with liquidity constraints may respond to the program . The financial incentives consist of a longterm savings bond redeemable on the daughters 21st birth-day conditional on her staying unmarried until the age of 18 and completing school level education. Additionally, the parents (either or both) have to adopt sterilization at the time of enrolling their second (birth order) daughter. These dimensions of variability in the design allows me to exploit variation by birth cohort, state, and birth order, which was not possible in previous studies.
This paper is the first to provide evidence on the effects of Ladli Laxmi Yojana in India. I assess the impact of LLY on improving the skewed sex ratio, changing family size and composition, and education outcomes of girls. I estimate the intent-to-treat program effects on sex ratio among living children, fertility preferences, and sterilization.
In order to understand how the parental investments have changed, I look at the effect of the program on eligible daughters health and schooling. Using the official state panel (Civil Registration System Data) and individual level data from nationally representative household surveys (India Human Development Survey and Annual Status of Education of Education Report), I exploit variation in exposure across birth years, states, and birth order to estimate the effects of LLY. Employing a difference-in-differences framework, I compare eligible female children in Madhya Pradesh to their ineligible counterparts in MP and five other similar states. I find that the Ladli Laxmi Yojana had a positive effect on female registration at the time of birth, but find no significant effect on sex ratio at birth or at later-life survival. There is an increase in the number of parents getting sterilized after the program, but surprisingly not after the second daughter, as designed under the policy. However, there is limited evidence of parents increasing investments in daughters health and education in the short and medium term, as a result of the program.
The main challenge for identification of this program’s impact is that it was launched at the same time across the entire state of Madhya Pradesh. Also, the launch of the scheme was at a time when Madhya Pradesh was experiencing high growth, and plausibly increasing rates of return to education as a result. Thus, changes in girls’ health and education outcomes during this period, could simply be because of the high growth in the state.
I address this concern by using variation in the composition of eligible children as well as the state and the year of birth to estimate the effects of the program. Follow-ing the estimation in Duflo (2001), I treat older cohorts who were not exposed to the program when they were born as the comparison group and younger cohorts who were exposed to the program in Madhya Pradesh as the treated group. Then use the other five states, Chattisgarh, Jharkhand, Orissa, Rajasthan and Uttarakhand as comparison states. Finally, I add third and later born children, who were ineligible for the program,
as another comparison group.
The key dependent variables of interest are sex ratio, family size compositions, par-ents’ sterilization, and schooling outcomes. First, I employ a difference-in-differences (DID) estimation by comparing these outcomes across first and second born girls in treated and untreated cohorts in Madhya Pradesh and comparison states. However, the difference-in-differences estimate will only give the causal impact of the policy, as long as the parallel trends assumption holds. Since I reject the parallel trends assumption, I employ a triple difference (DDD) approach to estimate the effects of the program. In addition, using difference-in-differences, the threats of omitted variable concerns still remain, including economic growth and changes in investments in school and hospital quality. The triple difference framework help address most of these issues. Therefore, I compare the changes in outcomes of first and second born girls to the changes in out-comes of third and later born girls. Given that third and later born children were not eligible to participate in the program, I use them as a comparison group to control for possible omitted variables at the state-year level.2 Moreover, most of the third born children in the comparison group are not actually in families where the first and second born daughters are eligible.3. To the extent that there are state-specific shifts in policies,
programs or spending for health and education, the higher birth order children will help control for these state-specific time effects. For example, third born children born in 2006 and 2007 cohorts will certainly not be in families that would have been eligible for the policy, i.e., those with first or second born girls in 2006 or later. Therefore, the third born girls are from the same birth cohorts as the first and second born girls, but are never eligible either before or after the policy because of their birth order. Therefore, I compare the DID estimate with the estimate for the third and higher birth ordered
2Even though the program affects the family size, my results on changes in family size show that most people continue to have three children. This makes using the third and later born children as a valid comparison group.
3Given that I am studying the effects up to year 2011-12 and up to 2009, five and three years after the program, respectively for sex ratio and schooling outcomes
females in treated and control states. This triple difference is the preferred estimate of program impact on sex ratio and schooling outcomes.
My main findings are as follows: First, I find no evidence of a change in either the sex ratio at birth or girls’ later-life survival. However, registered births for girls increase significantly. This seems to be a response to the program condition of registering the daughter within the first year of birth. This led to an increase in sex ratio of registered birth by almost 2%, enough to eliminate the imbalance in sex ratio.4 I find that the likelihood of parents getting sterilized goes up by 8 percentage points, and by 15 percentage points among parents with eligible children. The response towards the adoption of sterilization and smaller family sizes is driven by the non-BPL households.5
I also find a positive effect on the schooling outcomes of eligible girls, and also an improvement in their math and reading skills. It is useful to note that although the girls are still quite young at the time of measurement, I already find evidence of an improvement in their education outcomes, both in terms of schooling and test scores.
Although LLY was implemented in only one Indian state, it is representative of a set of more recent programs introduced in other states along several dimensions. Since, the program is being touted as one of the most successful programs to save and empower women in the state, other states are also emulating and introducing such programs. Therefore, it is important to understand the effects of a financial incentive program with enrollment at birth but delayed future payout. Furthermore, understanding its strengths and weaknesses, as highlighted by my analyses, can help improve the design of programs with similar socio-economics characteristics.
The rest of this paper is organized as follows. Section 2 discusses the related litera-ture; section 3 describes the program; section 4 describes the data; section 5 discusses estimating equations, and identification strategy; section 6 presents the main results;
4The natural rate of sex ratio is 105 males per 100 females.
http://www.searo.who.int/entity/health situation trends/data/chi/sex−ratio/en/
5BPL are the Below Poverty Line households. The government issues a BPL card to families whose income falls below the poverty line.
section 7 shows robustness checks and section 8 concludes.
1.2
Related Literature
Evaluation of most CCT programs in South America and some South Asian countries show that these programs effectively increase poor households’ investments in the de-velopment of their children’s human capital. There is a vast literature examining the effects of CCT programs on children’s health and education outcomes (Skoufias et. al, 1999; Skoufias, Davis, and De La Vega, 2001; Behrman, Sengupta, and Todd, 2005; de Janvry et. al, 2006; Chaudhury and Parajuli, 2010; Burde and Leigh, 2013). Most of these studies find a positive effective of financial incentive programs on improving health and education outcomes of poor children.
Over the years, the issue of Indias missing women (Sen, 1990), has attracted a lot of attention amongst policymakers. Studies claim that about half a million girls go ”missing” every year in India (Jha et al 2006). While the exact figure continues to be a debated issue, it is clear India is still struggling with the problem of skewed sex ratio and gender gaps. The sex ratio at birth has declined sharply and is still far from the natural sex ratio at birth of 952 girls to 1,000 boys. A substantial proportion of the decline in the female share may be attributed to discrimination against girls in the form of non-registration of female birth, sex selection, infanticide and parental neglect.
Indian federal and state governments have introduced several financial incentive pro-grams to improve female survival, and health and education investments in girls. How-ever, there is limited evidence on the effectiveness and causal effect of these financial incentive programs on change in parental investments and attitudes towards their daugh-ters. Anukriti (2017) evaluates one such financial incentive program in India targeted at reducing fertility and improving sex ratio. She finds that the program, called Devirupak,
increases the probability of couples having just one son. Moreover, the program does not change parents attitudes towards having daughters, even though the incentives given to parents with just daughters, were higher. Sinha and Yoong (2009) evaluate the effects of another such program in Haryana, Apni Beti Apna Dhan, a financial incentive program aimed at reducing the sex ratio. They find a positive effect of the program on sex ratio but no change in desired fertility.
This paper adds to the existing literature on the effects of a CCT program in a number of important ways. First, my paper quantifies the effect of a CCT program that is quite different in design from the traditional CCT programs. This is important because most CCT programs are for poor households and begin payments from the time of school enrollment. Additionally, most financial incentive programs in India, are targeted just to below poverty households (Apni Beti Apna Dhan) or do not have any future financial benefits (Devirupak), both in terms of savings bonds or conditional on schooling outcomes. LLY on the other hand has the biggest payment far out in the future but enrollment in the program begins at the time of birth. Second, while many studies have focused on South America and other regions of the developing world, this is the one of the few studies to focus on evaluating the impact of CCT programs in India. India is a transition economy with 17% of the worlds population, but is still grappling with the problem of skewed sex ratio and strong son-preferences with huge gender gaps in health and education. Thus, it is useful to understand how such programs affect the well-being of children in the country. Third, only a handful of studies have examined the effect of CCT programs on changes in fertility and family sizes; most of the previous studies have focused on educational and health attainment. There is a large literature on the impact of quantity on quality (Becker and Lewis, 1973; Rosenzweig and Wolpin, 1980; Rosenzweig and Schultz, 1987; Pitt, Rosenzweig and Gibbons, 1993). The literature shows that parents change their fertility decisions based on the birth of twins, access to methods of contraceptives and family planning programs.
Since the LLY program induces people to have a smaller family size, the quantity-quality literature will suggest that this will in turn increase parental investments in their daughters. Therefore, it is important to understand how people change their fertility and human capital investment decision in response to deferred financial investments. By including fertility as an outcome, I contribute to the scant literature on the effect of CCT programs on changing parental decisions for number of children and adopting family planning practices.
1.3
Program Description
Madhya Pradesh is one of India’s biggest and most populous states with a population of over 75 million people. It is also among the most backward and poor states in the country. Like most socio-economically backward states in India, Madhya Pradesh has historically been a high son preference state and its child sex ratio was 918 females per 1000 males in 2011. 6 There is widespread discrimination against female children in
India that has led to a persistent problem referred to as the phenomenon of ”missing women” in the literature [Sen, 1989]. One of the reasons for this phenomenon is the non-registration of female births. The share of registered births in total births .The female share in registered births was about 46 percent in Madhya Pradesh before the program. The sex ratio was 841 females per 1000 male registered births.7 By the year
2015, this has increased to 904 females births per 1000 male births.
There are several programs and policies being launched that are meant to ensure increased survival of female children as well improve their well being. On a similar lines, the Government of Madhya Pradesh announced and implemented Ladli Laxmi Yojana in April, 2007.8 Under this program, the beneficiaries are first and second born girls born
6Source: Census 2011, India. Child sex ratio is defined as number of females per 1000 males in the age group 06 years.
7Civil registration System Data, India 8http://ladlilaxmi.com/Sharad
on and after January 1, 2006 in families with income less than the minimum taxable income (annual household income less than Rs.250,000(USD 3800)) and whose parents are residents of the state. Prospective beneficiaries have to register themselves with their village Anganwadi centers. Another major condition is that the parents agree to adopt a terminal method of family planning (female (and (or) male sterilization) after the birth of the second (birth order) daughter and before enrolling her in the program.
As per the program9, the state government buys National Savings Certificates (NSC)10 in the joint name of the girl and the designated Project Officer in the block11. The amount of NSC bought is Rs. 6000 (USD 100)12 continuously for the first five years,
adding to a total amount of Rs. 30,000 (USD 500). In addition, the girl gets one time cash payment, at different levels of school completion, of Rs. 2000 (USD 33) cash when she gets enrolled in the 6th grade, a sum of Rs. 4000 (USD 67) when she enrolls in the 9th grade and a sum of Rs. 7500 (USD 125) when she enrolls in grade 11. The girls will also receive a monthly allowance of Rs.200 (USD 3) in grades 11 and 1213. Once the girl turns 21 she is entitled to get a lump sum amount of Rs. 100,000 (USD 1500) with the maturity of the National Saving Certificates, conditional on her graduating grade 12 and staying unmarried until the age of 18.14
The main objectives of the scheme are to improve child sex ratio at birth, increase school enrollment at all three levels - primary, secondary and higher secondary, and dis-courage child marriage. The program was designed such that the parents get a financial incentive (in the form of a savings bond) as soon as the daughter is born, even though the payout is much farther in the future. Also, the program rewards parents for sending their daughters to school, but the cash payment does not begin until she enrolls in grade
9Refer to Table 1
10Interest rate 8% per annum
11An Indian state is divided into districts and these districts are further divided into blocks. 12The exchange rate is $1=60 INR
13The benefit is extended only for two years. Thus, in case the girl fails to pass grades 11 and 12 in two years, the benefit would stop by the end of the second year.
6. Additionally, there are no performance based conditions, both in terms of schooling and health outcomes, implying that the program is more outcomes based and less action based. Thus, while this program is similar to other CCT programs (there is transfer of payments conditional on school participation), the overall design of the LLY program is quite different. The financial bond bought right at the time of birth helps subsidizing the cost of raising a daughter and attributes to the importance of making sure that parents do not discriminate against their daughters and she is financially empowered when she grows up.
While, the program is well- intentioned, it is not obvious that the program will indeed benefit the girls. Given that there is no immediate payment transfer to the parents, it may not induce credit constrained parents to take the initiative to take better care of and educate their daughters. Parents might not be willing to substitute present consumption in order to get a bigger future payment. In addition, some parents might view the future bond payment as a way to pay dowry in the marriage of their daughter and not necessarily as a way to financially empower their daughter. Therefore, an important research question is: are CCT programs that intervene at the time of birth effective enough to improve the well-being of young girls in a developing country, such as India?
1.4
Data
1.4.1
Registered Births Data
I use the official state panel data from Civil Registration System (CRS) of India, which provides records of registration of births and deaths. I use the annual reports of CRS from 2001-2015 to get total registered births and sex ratio at birth for the registered births. The data for these reports is compiled from the statutory Annual Statistical Report prepared by the Chief Registrars of Births and Deaths of States and Union
Territories. The recorded number of registered births are the births that took place and got registered in the given year itself. That is, for a given year, say 2007, the number of registered births recorded does not include information on births that took place in previous years but got registered late in the year 2007.
1.4.2
Female Share and Fertility Data
In order to assess the individual level outcomes, I use the Indian Human Development Survey 2011-12 (IHDS-II). This is a nationally representative panel data of 42,152 house-holds. The data is available at the individual and household level and is available at the district and state level. It includes household socioeconomic characteristics and a roster of all the members in the household, including ever married women and their fertility history.
This data is ideal for the analyses on sex ratio and changes in fertility, since it was conducted in 2011-12. It has information on all the births, live or still/dead, that took place in a given year. However, given the sampling of the IHDS, this implies that there is a section of women who have not yet completed childbearing. Though the survey asks a question about women’s desired number children, using that as a measure of total fertility is potentially endogenous as it is asked at the time of the survey, by when she has already given birth. Moreover, given that I am looking at family size and composition as an outcome, I cannot possibly include family fixed effects.
The first approach to address these issues is to use ”non-eligible” women in MP and women in other comparison states. The way I define ”eligible” and ”ineligible” women is described in detail in the next section. Briefly, a woman who can have a potentially eligible child is defined as treated and the others form the comparison group in MP and non-MP states. I also include state and woman’s age fixed effects, along with controls for woman’s education and a set of other household level controls. In addition, I conduct a set of robustness checks to control for any differential trends in fertility
in MP and comparison states, by including linear and quadratic state-specific women’s cohort trends. Second, I drop the youngest (15-19) and the oldest women(41-55) to just look at women who have possibly completed their childbearing. Additionally, the much older women cohort might be very different from the younger women as they would have had children in the distant past under different conditions than the women who became mothers closer to the policy time, so I later drop them from the sample and run the specifications as a robustness check.
I look at sex ratio at birth for all the births (and not just the registered births). Additionally, this data helps enables looking at the birth order of the child, which helps in defining the eligible and non-eligible group of girls. Since the oldest eligible girl (born in 2006) will be 5 or 6 by 2011-12, I look at female share among children at birth.15
In order to look at how female survival has changed, I look at female share among all the surviving children by the time of the survey, aged 0-12 (birth cohorts 2001-2012). Female share at birth helps us look at the effect on female foeticide whereas female share at older ages helps us look at the effect on female survival and parental neglect of their daughters.
I also use IHDS-II to examine the effects on family sizes, fertility and sterilization outcomes. The data has full birth history of ever married women aged 15-56. This dataset gives us measure of total number of children ever born to a woman and the total number of surviving children by the time of survey. Using this information I can calculate the birth order and sex composition of all the children born to a survey mother.16 The survey also includes information on methods of contraception (including sterilization) used by a woman (and) or her husband, as well as standard demographic and household characteristics.
15using information on all births- children that died after birth and those who were alive by the time of survey
16I exclude observations with missing values for year of birth of children. Also, I exclude children who have died. This restriction results in a loss of about 8 percent of the remaining observations.
1.4.3
Schooling and Cognitive Testing Data
I use the Annual Status of Education Report (ASER) 2009-14 to evaluate the educational outcomes. These are nationwide, repeated cross sectional surveys, representative at the state level. The survey covers nearly 700,000 rural children in age group 3-16 per year- those who are currently enrolled, have never been to school, or have dropped out. In each rural district, 30 villages are sampled. In each village, 20 randomly selected households are surveyed. All the children in a selected household, in the age group 5-16 are administered the same tests in basic reading and basic arithmetic.17
The survey asks every child aged 5 and above, four questions each in reading and math in their native language. The four reading questions are whether the child can recognize letters; words; read a grade one text and read a grade two text. The reading scores are coded as 1 if the child correctly answers the questions. Then I calculate the read score which ranges from 0-4 and is the sum of scores of the four questions.
For testing the math skills, each child is asked to complete four math tasks. The tasks are whether the child can recognize number 1-9; recognize numbers 10-99; subtract and can divide. The math score is coded as 1 if the child correctly completes the tasks. Then I calculate the math score which ranges from 0-4 and is the sum of scores of the four tasks for every child.
The typical age at which students enroll in school is 5 or 6. Since the oldest eligible cohort is 8 years old, I use females aged 5-8 to study the schooling and cognitive out-comes.18 Since the birth cohorts are from 2001-2009 and the exposed birth cohorts are
from 2006-2009, this makes it even less plausible for the third and later born children to be in households with eligible girls.
17ASER surveyors conduct the surveys on Sundays, when most people are at home and children are not in school, and must return to households if the children are not present at the time of survey.
1.5
Identification Strategy and Estimating Equations
The objective of my empirical strategy is to assess the causal impact of a conditional cash transfer program in an Indian state on sex ratio, fertility and educational outcomes. I use a difference-in-differences framework to study the effects of the policy on all these outcomes. The incentive structure of the program is given in Table 1. Given this, my regression analyses is based on two main specifications. First, I use difference-in-difference-in-differences to examine the effect of the program on sex ratio at birth and older ages (conditional on survival), and schooling and test scores outcomes of eligible girls. The second specification employs difference-in-differences strategy to estimate the effect of the Ladli Laxmi Yojana on the probability of a marginal birth and the sex of the child; and fertility and sterilization decisions of the parents.1.5.1
Difference-in-Differences Strategy
Since the program covered first or second born girls born on or after January 1, 2006, I use girls born before 2006 as the comparison group (Duflo, 2001). Using only the first and second born girls before 2006, I employ a double difference frameowrk by using the other five backward states, Chattisgarh, Jharkhand, Uttarakhand, Odisha and Rajasthan as the comparison group. Therefore, I compare outcomes for first and second born girls in MP and comparison states, before and after the program.
Thus, the difference-in-differences equation using the official state panel registration data is:
Yjc =β0+β1·(M Pj·2007&latercohortc) +β2·(M Pj·2006cohortc) +δj+γc+Ujc (1.1)
Yjcis the outcome variable for birth cohortcin statej. Since the policy was announced in 2007 for birth cohorts born from 2006, I add 2007 (2007&latercohort) and 2006 cohorts (2006cohort) separately to distinguish the effects on the two birth cohort samples. The
policy should not affect the registration of 2006 birth cohorts, as they were already born by the time policy was announced. δj and γc are the state and cohort fixed effects. β1
is the double difference estimator that estimates the causal impact of the policy on sex ratio at registered birth and female share in total registered births.
Since, the state panel does not have information on birth order, I cannot use this data to exploit variation in eligibility by birth order. Moreover, the data only has information on registered births but not on the unregistered births. Therefore, I study the effects of the program on sex ratio at birth and later-life survival of females using the individual-level data with information on universe of births: both registered and unregistered. Additionally, I can look at all the births that took place in a given year, irrespective of whether they are alive or dead by the time of survey. Here, I can also use information on birth year and exploit variation in eligibility by using the birth order. The difference-in-differences equation using the individual-level data is:
Yijc=β0+β1·(M Pij ·Af teric) +δj +γc+µXijc0 +Uijc (1.2)
Yijc is the outcome variable for child i from birth cohort c in state j. Af ter is the dummy variable, coded as 1 for birth cohorts 2006 and later. Sample includes only first and second born female children. Specification (2) includes fixed effects for state (δj) and birth cohorts (γc). Xijc0 is a vector of individual and household characteristics controls,which includes mother’s age, mother’s education, religion, caste, rural and Below Poverty Line (BPL) status. β1 is the double difference estimator that would estimate
the causal impact of the policy on female share at birth and among the older age (0-12) surviving children.
In order to look at fertility and sterilization, I define potentially eligible mothers. A woman who had no or one child by 2005 becomes a potential eligible mother, given that her first or (and) second born child (children) would be eligible if they are girls. Given
that these women were making fertility decisions when the program was introduced, I can study how fertility decisions changed because of the program.
I estimate the following difference-in-differences equation for a womaniin state j of age a
Yija=β0+β1·(M Pj·Eligiblecase1ia)+β2·(M Pj·Eligiblecase2ia)+β3·Eligiblecase1ia+
+β4·Eligiblecase2ia+ωa+δj+µXija0 +Uija (1.3) whereYija is the fertility outcome for womani in statej of agea. Eligiblecase1 is a woman who had no child by 2005 and Eligiblecase2 is a woman who had just one child by 2005. Specification(3) includes fixed effects for state (δj) and womans’ age (ωa). Xijy0 is a vector of individual and household characteristics controls,which includes woman’s education, religion, caste, rural and Below Poverty Line (BPL) status. The coefficients of interest are β1 and β2, to study the effects on two possibly eligible cases of women.
1.5.2
Triple Difference-in-Differences Strategy (DDD)
The main underlying assumption of the DID strategy for the sex ratio and education outcomes, is that in the absence of the program, the outcomes of both girls and women in MP would have followed the same trend as that of the similar children and women in comparison states. I address a majority of omitted variable concerns by comparing the double difference estimates for first and second born females (the treated birth cohorts), with the same estimate for the third and later born females.
A major concern with using third and later born females is if the policy itself changes fertility, using the third and higher birth order children will lead to a selection problem. However, there are two reasons why using the third and later born will not lead to a selection bias in this case. First, the fertility results (which I show in section 6) show
that the though the policy does decrease family size, I find that there is no change in people having three or four children. The decline in fertility is mostly for couples who would have had 5 or more children. Second, most of the third born children in the comparison group, given the time period of my analysis (after policy birth cohorts are from 2006-2011), are less likely in the families where the first and second born children would have been eligible. Therefore, these third and late born children are born in the same years as the first and second born children, but will never be eligible for the program. To the extent that there are state specific shifts in investments and other policies or programs for health and education, the higher birth order children will help control for these changes that will affect child health and education. Thus, I use a triple difference framework by exploiting variation by birth order and using the third and later born females as another comparison group, as the preferred specification for sex ratio and education outcomes.
Therefore, the triple-difference estimate of exposure to the CCT program is estimated by:
Yijct=β0+β1·(M Pj·Af terct·1st2ndBorni) +β2·(Af terc·1st2ndBorni)+
β3 ·(1st2ndBorni·M Pj) +β4·(Af teric·M Pj) +β5 ·1st2ndBorni
δj +γc+φt+µXijct0 +Uijct (1.4) where Yijct is the sex ratio and schooling outcomes for a child i in state j of birth cohort cin year t. 1st2ndBorn is a dummy for first and second born child. The sample includes only female children. Specification (4) includes fixed effects for state (δj), birth cohorts (γc) and year of survey (φt)(for ASER data). Xijct0 is a vector of individual and household characteristics controls. The main parameter of interest is the triple-difference estimate of β1.
account. First, inference is based on robust standard errors. Second, I define Af tert at the year level as t ≥ 2006. This is because births that took place during 2006 were conceived before the scheme was announced and are unlikely to have been affected by it. Third, one of the eligibility conditions of LLY is that the family should be non- income tax payers. I do not enforce this condition when defining eligibility in my analyses. This is not a major concern as the number of income-tax payers in India is small due to several tax exemptions.19 Moreover, there is evidence of widespread tax evasion in India. For these reasons, it is unlikely that the income-tax status of a household is a strictly enforced or a binding condition for eligibility.
1.6
Results
1.6.1
Effects on Sex Ratio
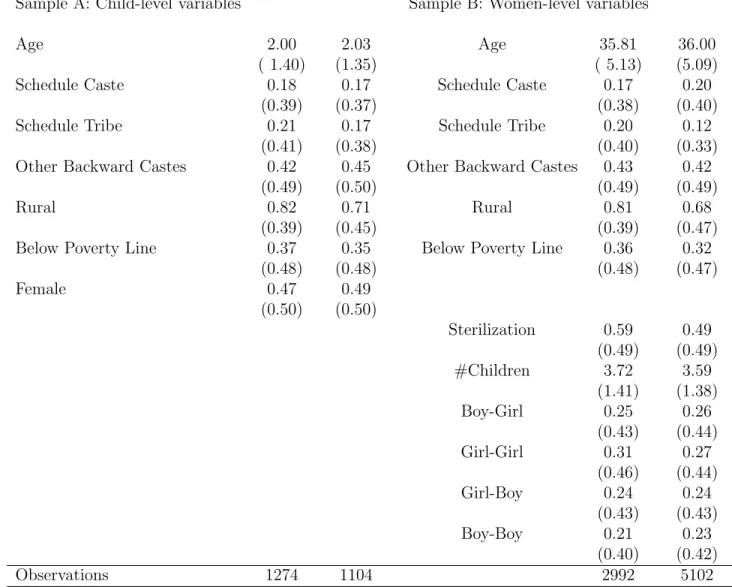
In this section, I test Specification (1) using the official state year data from Civil Registration System and Specifications (2) and (4) using individual-level data. Table 2 presents the descriptive statistics of the main outcomes using the state panel data. Table 3 presents the summary statistics of the main outcomes using the individual data from IHDS-II. Both MP and non-MP comparison states are quite similar before the program is announced. Table 2 shows that for the registered births, the sex ratio and female share in registered births is similar before the program in both MP and comparison states, and is 46% in MP.
Figure 1 plots the cohort-specific effects for female share in total births, for registered births. The figure plots the coefficient of interaction, from equation(1), between the year-of-birth dummy and the treated state (MP). Given that children born in 2006, though
19Banerjee and Piketty (2005) show that incomes below the top 1 per cent are largely exempt from taxation in India.
eligible for the program, could not have been the affected cohort when looking at birth registration, I find that relative to the 2005 birth cohort, the 2006 birth cohort seems unaffected. As soon as the program is announced in 2007,the program has a positive effect on sex ratio at birth and female share in total registered births.20
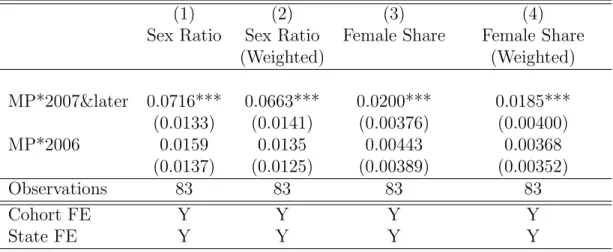
The estimation results from Specification (1) for the two outcome variables using the state panel data are reported in Table 5. In columns (1) and (3), the dependent variable is sex-ratio and the female share in total registered births, respectively. In columns (2) and (4), the estimation results are from the weighted least square (WLS) regressions, weighed by the total number of registered births in every year in each state. Using WLS ensures that all the states do not get an equal weight, as the registration can differ by the population of each state.
I find that sex ratio at birth improves in Madhya Pradesh after the implementation of the program and the results are not sensitive to weighing by total registered births in every state. It is important to understand that this analysis does not include the unregistered births and I am able to evaluate the effect on just registered births and find an improvement in sex ratio at birth for registered births. This can be due to an increase in the survival rate of girls at birth or due to an increase in registration of births conditional on survival. Both margins are correlated with better well-being of the girls and is consistent with the program’s condition of registering female birth.
In order to make the results comparable with the individual-level data, I estimate the effect of the program on female share in total registered births. In Table 5, columns (3) and (4), I look at the share of female births in total registered births. The results show that even though overall birth registration has gone up in Madhya Pradesh, female share in total registered births is increasing at a faster rate after the implementation of the program in the state.
20In Appendix Table A1, I present results for overall effect on registered births by female and male registered births separately respectively and find that both are improving but is higher for female births in the state after the program implementation
Although the state panel data gives us information on just registered births, these results can be discussed in relation to the literature on ”missing girls” in India. The literature identifies two types of ”missing women”, those who are never born through sex-selective abortions and those who go ”missing” after birth because of non registration of their births or due to parental neglect leading to child mortality. In this paper, I can look at the changes in the latter using analysis from the state panel data. I find that sex ratio at birth goes up by almost 2 per cent. This implies that gap between global (about 105 males for every 100 females) and Madhya Pradesh’s sex ratio at birth (for registered births) closes after the program. This is an important finding since most of the sex ratio gap seems to be because of the unregistered births as shown in Table 3. The channel of non-registration of female births causing missing women seems to be closing after the policy.
There are several benefits of registering the birth of child, like admission to schools, obtaining voter ID, employment in government sector, and marriage registration. De-spite these benefits, some parents do not register female births. One reason can be holding themselves un-accountable in case the daughter dies. It can also be due to per-sistent gender discrimination, parents fail to understand the importance of registering the daughters. Thus, because of the program the number of un-registered female births seems to go down. This is important for the well-being of girls in both short and long run.
A limitation of the official state panel data does not help us distinguish if the creased registration of births implies an increase in female birth registration or an in-crease in overall sex ratio at birth and a dein-crease in excess female mortality. The individual-level data includes all births (both registered and not registered) and there-fore, gives us a deeper insight on changes in child survival relative to the changes in birth registration conditional on survival. Figure 2 plots the DID coefficients from equation (2) by birth cohorts. This shows the female share for all the registered and un-registered
births. I find no change in female share after the policy. Since only the first and second born girls were eligible for the program, I plot the DID coefficients from equation (2) by birth cohorts, and by birth order in Figure 3. Panel A shows the female share among the first and second born children and Panel B shows female share among the third and later born children. Thus, there is no evidence for change in female share among the eligible and non-eligible children, by year of birth and by order of birth.
Given that I do not find any evidence of changes in female share among the third and later born children, this suggests that there is no selection bias when using the gender of the third born child. Thus, using the triple difference framework discussed in equation (4), Table 6 shows the effect of the program on female share at birth and older ages, using the IHDS-II. These results are most comparable to the results in columns (3) and (4) of Table 5. Using the individual-level data, the coefficients for female share are close to zero, but I lose significance at the conventional levels. Therefore, I find no evidence of improvement in female share for the exposed cohort both at birth and at older ages. Since the results in Table 6 show that there is no evidence of change in sex ratio for the universe of births, it suggests that the estimated increase in registration is mainly because of the program condition of registering births and does not necessarily reflects changes in excess mortality or sex-selective abortions. This shows that parents did not necessarily change their strong son-preference attitudes in favor of having a daughter.
1.6.2
Effects on Fertility
Furthermore, I estimate the effect of Ladli Laxmi Yojana on the total number and composition of children. Since one of the policy conditions for the parents of the eligible girls was to adopt sterilization before enrolling the second born daughter in the program, I expect couples with eligible second born daughters to have smaller family sizes. In fact, if the program strictly enforced the family planning condition of sterilization, then I should find that these families are more likely to stop at two children.
Table 3 shows the descriptive statistics for the non-eligible women in MP and com-parison states for the fertility outcomes. On average, a woman is 35 years old and has 3.72 children in MP. Table 7 reports the DID coefficients from specifications (3) using indicators for the likelihood of number of children and the specific number of children as outcomes. Column (1) presents the likelihood of having children and the columns (2)-(6) present the likelihood of having one, two, three, four and five or more children. The sample includes ever-married women with at least one child. All specifications in-clude women’s age and state fixed effects. The estimates show that women which started childbearing after 2006 (eligible case 1) are more likely to have two or three children. For women who already had one child by 2005 (eligible case 2), they are less likely to have two children and are more likely to have three or four children. Both types of women are less likely to stop at one child and are less likely to have five or more children. Although I control for a variety of individual and household characteristics, these women may still be different from those observed at much older ages. As a robustness check, I limit my sample to women aged 20-40 and find that the effects remain almost unchanged. These results are reported in Appendix Table A3.
One of the distinctive feature of LLY is that it is more universal in its implementation and both poor and non-poor households are eligible. Therefore, I look at the effect of LLY separately on Below Poverty Line (BPL) and non- BPL households.21 In Table 7,
Panels B and C show the results for poor and non-poor households. I find that BPL families are more likely to have a bigger family size, whereas the non- BPL families seem to show a stronger response to the program conditions of smaller sizes.
In order to test if the effects on the total number of children differ by the gender of the first two children, I estimate specification (3) separately by four different gender combinations of the first two children. These combinations are: boy-girl (BG), girl-girl (GG), Girl-boy (GB), and boy-boy (BB).Given that the program has a condition of
parents adopting sterilization after the birth of the second daughter, I should find effect on families with specifically the first two composition of children- one with boy-girl composition and those with girl-girl composition of the first two children in that order. Table 8 presents the estimates for this specification. Mothers (eligible case2 women) with first and second born girls (GG) are more likely to have four children. Eligible case 1 women are likely to have three children but I lose significance at the conventional levels. This finding is consistent with the literature suggesting no change in the strong son-preferences among most parents. Mothers with eligible girls (boy-girl and girl- girl combination of first and second born children) are less likely to stop at just two children. Since the government claims all of the eligible families are enrolled in the program and from the findings in this paper, we can conclude that the condition of family planning was not enforced. The next section shows the results for the likelihood of parents adopting sterilization and is another channel through which the program affects family planning decisions.
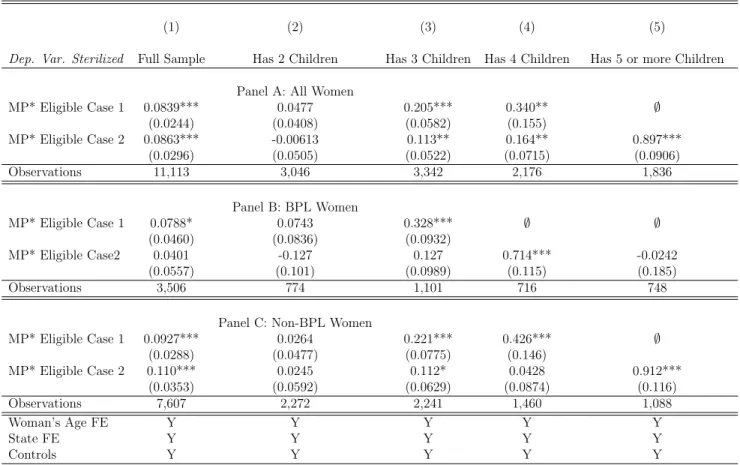
Effect on Sterilization
One of the conditions of the LLY program was for the couples with a second born daughter to adopt sterilization (either or both the parents). I estimate specification (3) to asses the effect of the program on likelihood of couples getting sterilized. Table 3 presents the descriptive statistics for the non-eligible women in MP and comparison states. Sterilization is a widely prevalent method of family planning in MP as compared to the comparison states. On an average 59 and 49 percent women in MP and comparison states, respectively are sterilized.
To the extent that the program strictly enforced the sterilization condition, I expect that couples with second born daughters are more likely to get sterilized. However, since most parents have a strong son-preference attitude, they might not stop after the birth of daughters. If the program does indeed increase the likelihood of couples to adopt
sterilization, I expect to find that the two types of eligible mothers are more likely to get sterilized in MP relative to other states.
Table 9 presents the results for the estimation of specification (3) for the likelihood of couples getting sterilized. I find that there is an overall increase in the likelihood of eligible women getting sterilized in MP relative to other states. Also, eligible case 1 women are more likely to get sterilized after two or three children, whereas eligible case 2 women are more likely to get sterilized after three or four children. These estimates are consistent with the fertility results. Eligible case 1 women are more likely to stop after three children and eligible case 2 women are likely to stop after four children. Thus, even though I do not observe the complete fertility history of these two types of women, I find that they are more likely to have stopped childbearing by the time of survey and adopted sterilization. Additionally, panels B and C of Table 9 show the effects for poor and non-poor households and I find that both households are more likely to respond to the condition of sterilization. However, the response is once again bigger from the non-BPL families.
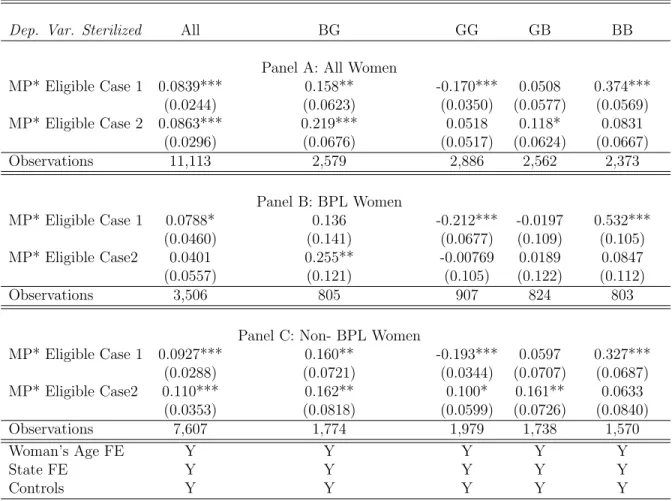
To examine the effects of the program condition of sterilization after the second daughter, I again assess the likelihood of couple adopting sterilization after the second born daughter. Table 10 presents the results for this estimation, by the gender composi-tion of children. Columns (2) and (3) show estimacomposi-tion for the combinacomposi-tions of children , for which the couple is expected to adopt sterilization under the program. Couples with two girls (girl-girl combination) are less likely to be sterilized. An interesting finding is that parents with boy-girl combination are more likely to adopt sterilization as compared to parents with girl-boy combination of the first two children. This suggests the program had a positive effect on couples adopting sterilization, given that they have an eligible daughter and at least one son. If this was true for couples in general and not necessarily the effect of the program, then I would expect to find the similar effect for couples with girl-boy combination. Coefficients for the girl-boy specification are positive and
signif-icant only for case 2 women. Therefore, the results are not necessarily indicative of a general trend in couples adopting sterilization after the birth of son. Additionally, the point estimates for boy-girl are relative bigger than girl-boy combination. This shows that people with an eligible second born daughter did adopt the required sterilization, if the first born is a son. This finding is consistent with the prevalence of strong son preference among Indian parents.
In general, the results for total number of children and likelihood of parents adopting sterilization seems to suggest that parents in MP with eligible daughters did respond to the program. Though the condition of sterilization does not seem to be implemented as was initially designed under the program. Also, the results show that parents are either more likely to have more children or reach their desired family size faster than before the program in MP. In order to understand these channels better, I examine the effect of the program on birth spacing.
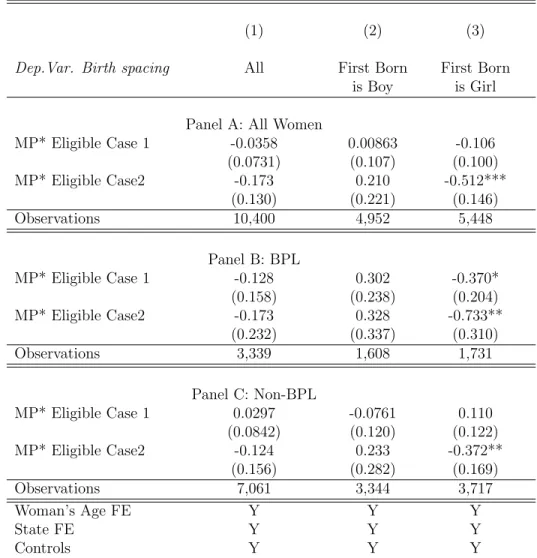
Effect on Birth Spacing
This section shows results for birth spacing between the first and second born children for the two types of women after the program. I examine the effect of the program on the birth spacing between the first two births, by the gender of the first born child. Given that the program induces parents to have smaller families with at least one daughter, LLY can possibly increase the probability of sex-selective abortions as parents will most likely want one son and one (eligible) daughter combination among their children. On the other hand, birth spacing can also decrease as parents will want to reach their desired family size faster and gender composition once they have an eligible daughter. This is because, the results in the previous section show that parents are indeed getting sterilized, however not at the margin at which the program intended. Since I find that sex ratio at birth is not changing (when looking at both registered and unregistered births), we know that changes in sex-selective abortions is not the dominant channel
here. In order to assess the likelihood of the second, which is a decrease in birth spacing, I estimate specification (3) with birth spacing between the first and second child as an outcome.
Table 11 shows the estimation results for changes in birth spacing as a result of the program. I find that it is indeed the case that couples are more likely to reduce the birth spacing between the first and second child. Additionally, I find that birth spacing remains almost unchanged if the first child is a boy, but decreases if the first child is a girl. These results lend support to the findings from the previous two results on fertility preferences and imply that the eligible mothers are more likely to decrease birth spacing in order to reach their desired family size and composition faster, in order to receive the benefits of the program faster. Overall, I find that mothers who start child bearing after the program are responding differently to the program as compared to those who already had a child by 2005.
1.6.3
Effect on Schooling and Cognition
Table 12 shows the estimates ofβ1 from specification(4) using the ASER data for
school-ing and cognition outcomes. Followschool-ing the literature, there can be both positive or neg-ative effects on schooling and education outcomes based on the birth order. Therefore, I report results separately for the first and second born daughters. Also, since the results can be confounded by using the higher birth order children as comparison groups, I just use the third born children as a comparison group here. The birth cohorts are from 2001-2009. Given that I just have three after year birth cohorts from 2006-2009, it is unlikely that the third borns are in households with eligible girls. Columns (2) and (3) suggest that LLY had a positive impact on the likelihood of an eligible girl being enrolled in school and on staying enrolled, respectively. Column (1) shows the highest grade completed by the child. This is the highest level of schooling completed by the girl at the time of survey. This is zero if the child was never enrolled in school or if she
dropped out in grade 1. For those who are currently enrolled, it is the current grade minus 1 and for those who dropped out, it is the grade in which they dropped out minus one. I find no significant effect of the program on the highest grade completed.
The results in Tables 13 and 14 show the effect of the program on cognition skills of the females. The coefficient for the over all math score is positive for both first and second born daughters but is not significant for the second daughter. The coefficient for reading scores is also positive but I lose significance at the conventional levels.
Therefore, it seems the program had a positive effect on the likelihood of staying enrolled in the school for the eligible girls. However, the effect on cognitive skills is smaller and not significant, but is positive. One reason for these results is that these girls are still quite young and almost 98 percent children enroll in primary school in India. The dropout rates are higher in middle and upper level grades, especially for girls. Therefore, the program is well-intentioned as the one time cash benefits to the girls are given at the time of enrollment in different levels of school completion, where the dropout rates have traditionally been higher. Additionally, it is also possible that not all credit constrained parents respond positively to the program in terms of investing in their daughters education. As the literature shows, parents in poor households associate a high opportunity cost with sending their daughters to school, the results I find are less surprising as I analyze the effects on children in rural households.22
1.7
Robustness
My identification strategy relies on the assumption that in the absence of LLY, Madhya Pradesh and the other comparison states did not have systematically different time patterns in the outcome variables. While I show the trends for before years (2001-2005), I can also test whether the results are driven by inclusion of any particular comparison state. Although, all the specifications control for individual and household
characteristics, I re-estimate specification (1) dropping one comparison state at a time. Table A2 presents these results for the state panel data that are comparable with results in Table 5. The results are still significantly positive, showing increase in number of female registered births.
Since the identification also depends on evaluating just the effects of LLY affecting just the eligible females, it is important to account for simultaneous policies or any other changes that can also potentially affect the treated population. For the fertility results, it is important to account for other government programs that target fertility and family planning decisions of women. Although, I include women’s age fixed-effects in all the specifications, I also control for any changes in women’s fertility decisions that differ by different age cohorts in different states. However, it is still possible that other programs specific to a comparison states are confounding the results. While I cannot directly control for state-specific time trends because of the single cross-section data, I address this issue by controlling for state-specific women’s cohort trends by re-estimating specification (3). If my results are capturing the effect of the LLY program on fertility decisions of parents, I should get robust results by adding this additional control. Tables A5 and A6 report the results and find that fertility and family planning results are robust to adding state-specific women’s age cohorts.
Next I conduct a placebo test for the schooling and cognition outcomes, by reassigning the intervention to alternate year. Using the ASER data, I restrict my sample to birth cohorts 1993-2000. Next, I re-assign 1996 as the placebo policy year. This makes children of birth cohorts 1996-2000 as the eligible cohort and 1993-1995 birth cohorts as the comparison group. The comparison states are the same. If my results are capturing the causal impact of LLY on the schooling and cognition outcomes of girls, I should not find significant effects in the placebo regressions. Table A7 shows the results for this placebo test. I do not find significant effects as my main results in Tables 12, 13 and 14. In fact, most of these placebo estimations are close to zero, giving credibility to my
estimation strategy and implying a causal interpretation of my main results.
1.8
Conclusion
This paper evaluates the effect of a conditional cash transfer program that differs in features from most conventional CCT programs on sex ratio, birth registration, fertility and parental investment in their daughters.
I find that the incentive of getting a huge financial payment in future is not enough to induce parents to give up the strong son-preference attitude. I find that the program does not have an effect on changing the sex ratio at birth, looking at the universe of births. However, there is a significant increase in the registration of female births. Therefore, there is no effect on female mortality but a positive effect on birth registration. Additionally, the program has a limited yet positive effect on improving the education outcomes of the eligible girls, both in terms of schooling and cognitive skills. With respect to the fertility outcomes, although people with eligible daughters are more likely to be sterilized, parents with two daughters are less likely to stop at two children as well as adopt sterilization. I also find an unintended negative effect of the program, inducing people to have children faster and thereby reducing the birth spacing among children. This is specially worse when the first born is a girl. Oveall however, parents are less likely to have four or more children, but most continue to have at least three children.
There can be several reasons for these effects of the program. First, for the credit constrained households to react positively to the program, the financial benefits are much farther out in the future which can make it difficult for them to re-allocate present day resources. Second, the program is based on outcomes and not actions, like PROGRESA. Parents have to make sure that their daughter graduates from school (grade 12) in order to get the financial payment, therefore, providing them with an incentive to induce improved learning and cognition skills of the daughter. Also given the data, oldest
treated cohort is just eight years old and so it may be too early to find comprehensive changes in schooling outcomes for these children.Although, since I already find evidence of positive effect of this program on both schooling and learning outcomes, this seems encouraging and will hopefully grow further at higher grades.23
Thus, the analyses presented in this paper have the following policy implications. First, if a less male biased sex ratio is desired, it is desirable to incentivize couples with daughters and not just the first two daughters. This will ensure that parents do not decrease birth spacing when the first born is a daughter, and it will ensure that there are fewer sex selective abortions. Thus, a potential recommendation is to design the program such that parents are incentivized to have daughters, while also allowing them to have a minimum number of desired boys, as an effort to change attitudes towards female discrimination. This will also help ensure less biased attitude towards daughters and will result in fewer ”missing women”. Second, it is important to understand the difference between credit constrained and non-credit constrained households. In this respect, the policy can be more targeted and incentivize poor households more than the non-poor households.
23In India, dropout rates are lower at primary level (about 4%) and much higher at middle and secondary level (grades 6-10), Ministry of Human Resource Development (MHRD) 2014-15
Bibliography
Fred Arnold, Sunita Kishor, and TK Roy. Sex-selective abortions in india. Population and development review, 28(4):759–785, 2002.
Abhijit Banerjee and Thomas Piketty. Top indian incomes, 1922–2000. The World Bank Economic Review, 19(1):1–20, 2005.
Gary S Becker and H Gregg Lewis. On the interaction between the quantity and quality of children. Journal of political Economy, 81(2, Part 2):S279–S288, 1973.
Jere R Behrman, Piyali Sengupta, and Petra Todd. Progressing through progresa: An impact assessment of a school subsidy experiment in rural mexico. Economic devel-opment and cultural change, 54(1):237–275, 2005.
Sonia R Bhalotra and Tom Cochrane. Where have all the young girls gone? identification of sex selection in india. 2010.
Prashant Bharadwaj and Leah K Lakdawala. Discrimination begins in the womb: ev-idence of sex-selective prenatal investments. Journal of Human Resources, 48(1): 71–113, 2013.
V Bhaskar. Sex selection and gender balance. American Economic Journal: Microeco-nomics, 3(1):214–244, 2011.
V Bhaskar and Bishnupriya Gupta. India’s missing girls: biology, customs, and economic development. Oxford Review of Economic Policy, 23(2):221–238, 2007.