Marsh, Herbert W.; Pekrun, Reinhard; Murayama, Kou; Arens, A. Katrin; Parker, Philipp D.; Guo, Jiesi; Dicke, Theresa
An integrated model of academic self-concept development. Academic
self-concept, grades, test scores, and tracking over six years
formal und inhaltlich überarbeitete Version der Originalveröffentlichung in: formally and content revised edition of the original source in:
Developmental psychology 54 (2018) 2, S. 263-280
Bitte verwenden Sie beim Zitieren folgende URN / Please use the following URN for citation:
urn:nbn:de:0111-pedocs-156147 - http://nbn-resolving.org/urn:nbn:de:0111-pedocs-156147
DOI: 10.1037/dev0000393 - http://dx.doi.org/10.1037/dev0000393
Nutzungsbedingungen Terms of use
Gewährt wird ein nicht exklusives, nicht übertragbares, persönliches und beschränktes Recht auf Nutzung dieses Dokuments. Dieses Dokument ist ausschließlich für den persönlichen, nicht-kommerziellen Gebrauch bestimmt. Die Nutzung stellt keine Übertragung des Eigentumsrechts an diesem Dokument dar und gilt vorbehaltlich der folgenden Einschränkungen: Auf sämtlichen Kopien dieses Dokuments müssen alle Urheberrechtshinweise und sonstigen Hinweise auf gesetzlichen Schutz beibehalten werden. Sie dürfen dieses Dokument nicht in irgendeiner Weise abändern, noch dürfen Sie dieses Dokument für öffentliche oder kommerzielle Zwecke vervielfältigen, öffentlich ausstellen, aufführen, vertreiben oder anderweitig nutzen.
We grant a non-exclusive, non-transferable, individual and limited right to using this document.
This document is solely intended for your personal, non-commercial use. Use of this document does not include any transfer of property rights and it is conditional to the following limitations: All of the copies of this documents must retain all copyright information and other information regarding legal protection. You are not allowed to alter this document in any way, to copy it for public or commercial purposes, to exhibit the document in public, to perform, distribute or otherwise use the document in public.
Mit der Verwendung dieses Dokuments erkennen Sie die Nutzungsbedingungen an.
By using this particular document, you accept the above-stated conditions of use.
Kontakt / Contact: peDOCS
DIPF | Leibniz-Institut für Bildungsforschung und Bildungsinformation Informationszentrum (IZ) Bildung
E-Mail: [email protected] Internet: www.pedocs.de
©American Psychological Association, 2018. This paper is not the copy of record and may not exactly replicate the authoritative document published in the APA journal. Please do not copy or cite without author's permission. The final article is available, upon publication, at: 10.1037/dev0000393
Developmental Psychology
An Integrated Model of Academic Self-Concept Development: Academic Self-Concept, Grades, Test Scores, and Tracking Over 6 Years
Herbert W. Marsh, Reinhard Pekrun, Kou Murayama, A. Katrin Arens, Philip D. Parker, Jiesi Guo, and Theresa Dicke
Herbert W. Marsh, Institute of Positive Psychology and Education, Australian Catholic University, and Department of Education, University of Oxford; Reinhard Pekrun, Department of Psychology,
University of Munich, and Institute for Positive Psychology and Education, Australian Catholic University; Kou Murayama, School of Psychology and Clinical Language Sciences, University of Reading, and Research Institute, Kochi University of Technology; A. Katrin Arens, Department of Education and Human Development, and Center for Research on Individual Development and Adaptive Education of Children (IDeA), German Institute for Interna- tional Educational Research; Philip D. Parker, Jiesi Guo, and Theresa Dicke, Institute of Positive Psychology and Education, Australian Catholic University.
This article was supported in part by a grant from the Australian Research Council to H. Marsh (DP130102713) and by four grants from the German Research Foundation to R. Pekrun (PE 320/11-1, PE 320/11-2, PE 320/11-3, PE 320/11-4). Requests for further information about this investigation should be sent to the corresponding author.
Correspondence concerning this article should be addressed to Herbert W. Marsh, Institute for Positive Psychology and Education, Australian Catholic University 25 Barker Street, Strathfield NSW 2135 Australia. E-mail: [email protected]
Abstract
Our newly proposed integrated academic self-concept model integrates 3 major theories of academic self-concept formation and developmental perspectives into a unified conceptual and methodological frame- work. Relations among math self-concept (MSC), school grades, test scores, and school-level contextual effects over 6 years, from the end of primary school through the first 5 years of secondary school (a representative sample of 3,370 German students, 42 secondary schools, 50% male, M age at grade 5 = 11.75) support the (1) internal/external frame of reference model: Math school grades had positive effects on MSC, but the effects of German grades were negative; (2) reciprocal effects (longitudinal panel) model: MSC was predictive of and predicted by math test scores and school grades; (3) big-fish-little-pond effect: The effects on MSC were negative for school-average achievement based on 4 indicators (primary school grades in math and German, school-track prior to the start of secondary school, math test scores in the first year of secondary school). Results for all 3 theoretical models were consistent across the 5 secondary school years: This supports the prediction of developmental equilibrium. This integration highlights the robustness of support over the potentially volatile early to middle adolescent period; the interconnectedness and
complementarity of 3 ASC models; their counterbalancing strengths and weaknesses; and new theoretical, developmental, and substantive implications at their intersections.
Keywords
developmental equilibrium, math self-concept, frame of reference effects, reciprocal effects, big-fish-little-pond effects
Self-concept and related self-beliefs are key constructs in developmental and educational psychology. For many developmental re- searchers, and in many early childhood programs (e.g., Fantuzzo et al., 1996), self-concept has been a “cornerstone of both social and emotional development” (Kagan, Moore & Bredekamp, 1995, p. 18; also see Davis-Kean & Sandler, 2001; Marsh, Ellis, & Craven, 2002). Academic self-concept (ASC) is also widely accepted as a critical psychological construct that leads to success in educational settings (Chen, Yeh, Hwang, & Lin, 2013; Marsh & Craven, 2006; Marsh & Yeung, 1997), in social and emotional situations (Harter, 2012; Marsh, Parada, Craven, & Finger, 2004, Pekrun, 2006), and in daily life more generally (Eccles, 2009; Elliot & Dweck, 2005).
Before outlining the integrated model, we begin with a brief overview of the contributory theories, three of the most important theoretical models in ASC research, which are as follows:
• The internal/external frame of reference (I/E) model relates math and verbal achievement to corresponding measures of ASC;
• the reciprocal effects model (REM) of relations between academic achievement and ASC over time; and
• the big-fish-little-pond effect (BFLPE), that is the negative effect of school-average achievement on ASC.
Although there is much support for each of these theoretical models considered separately, to our knowledge no study has considered all three models within a unified theoretical framework and a single statistical model incorporating parameter estimates to test all three models simultaneously, using a database suitable for testing all three within a single integrated model.
Historically, the understanding of ASC has been limited by the piecemeal approaches that are endemic when separate theories are considered each in isolation. Thus, for example, the main focus of the I/E model is the juxtaposition of math and verbal constructs; however, this focus on domain specificity is largely ignored in the other two models, which typically are tested within a single academic domain. Likewise, the focus of the reciprocal effects model is on longitudinal relations of ASC and achievement over time, but this longitudinal perspective is largely ignored by the other two models, which typically are tested using cross-sectional data. The critical feature of the BFLPE model is its multilevel consideration of contextual effects (the effects of school-average achievement on self- concept), but this multilevel perspective is largely ignored by the other two models, which typically are tested with single-level models. Importantly, this integration of ASC theories (hereafter referred to as the integrated ASC model) results in a number of new predictions (see the online Supplemental Materials, Section 7, for new predictions that could not be derived from the individual components of the integrated ASC model when considered separately). To this integration of models we add a developmental perspective, in which we evaluate support for the consistency of effects (which we subsequently refer to as developmental equilibrium) across the potentially turbulent, a period of early to middle adolescence (first 5 years of secondary school) that involves so many biological and psychological changes (e.g., Eccles, 2009; Eccles et al., 1993; Harter, 2012: Steinberg, 2008).
We also note that the integrated ASC model, and empirical tests of the model, are important because each of the three separate theories leaves open the question as to whether the effects hypothesized in one model are independent of the effects hypothesized in the other two. Only the integrated ASC model (and tests of this model) allows us to examine the robustness of the effects considering all predicted effects combined.
The new integrated ASC model (see Figure 1) incorporates the I/E, REM, and BFLPE models, which are based on the theoretical and empirical work of Marsh and colleagues (e.g., Marsh, 2007; Marsh & Craven, 2006; Marsh, Seaton, et al., 2008; Möller & Marsh, 2013). Thus, its overarching aim is to systematically explain the relations between ASC and academic achievement across domains
(dimensional comparisons within the I/E model; i.e., “My accomplishments in one domain relative to accomplishments in other domains”), time (development within the REM model; i.e., “My current
accomplishments relative to past accomplishments”), and school peer group (social comparisons within the BFLPE model; i.e., “My accomplishments relative to those of my peer group”).
In summary, there are important advantages in bringing these three theoretical models within the unified framework proposed here. The complementarity of these different theoretical perspectives allows us to achieve a broader understanding of the formation of ASC. In addition, integrating the three into a single unified framework results in new theoretical predictions arising from the intersections of the different models (see subsequent discussion). Methodologically, it is also important to emphasize that with appropriate data, all three models can be tested within a single statistical model. We demonstrate how parameter estimates based on one unified statistical model provide tests of each of the three ASC models from a developmental perspective: This reinforces their complementarity.
Integration of Three Theoretical Models of ASC Formation
In the present investigation, we aim to investigate how students develop their beliefs about their competence throughout their adolescence. In pursuing this aim, we take into account three main influences that have been identified in prior research in the three theoretical models, which are as follows: dimensional comparison, reciprocal effects, and social comparison effects.
The I/E Model: Dimensional Comparison Effects
ASCs in specific academic domains are much more differentiated than are the corresponding measures of achievement. Indeed, even though math and verbal achievements tend to be highly correlated, math and verbal self-concepts tend to be nearly uncorrelated (Marsh, 1986, 2007; Marsh, Kuyper, Seaton, et al., 2014). The I/E model provides a theoretical rationale for these seemingly paradoxical results, in positing that ASC in a particular school subject is formed in relation to two comparison processes: an external (social comparison) reference, in which students compare their performances in a particular school subject with the performances of other students in the same school subject, and an internal (dimensional comparison) reference, in which students compare their own performances in that particular school subject with their own performances in other school subjects. In particular, Marsh (1986) proposed that students use an internal comparison process, whereby academic achievement in one domain (e.g., verbal) provides a frame of reference for forming ASC in a contrasting domain (e.g., math).
Although the I/E model posits that achievement is highly positively predictive of ASC in the matching domain, the critical theoretical predictions are the negative cross-paths leading from achievement in one subject to ASC in the other subject; for example, verbal achievement to math self-concept (MSC). The theoretical rationale for the negative cross-paths (dimensional comparisons) is that students will use verbal achievement, for example, as a basis of comparison in the formation of their MSC. Thus, high verbal achievement will detract from a high math self-concept; likewise, students who have good math achievement will have lower MSCs if their verbal achievement is much higher than their math achievement. Following initial tests of the I/E model (Marsh, 1986), the I/E model predictions were found to be supported in 26 countries using Programme for International Student Assessment (PISA) data (Marsh & Hau, 2004). In a subsequent meta-analysis based on 69 data sets, Möller et al. (2009) reported that math and verbal achievements were highly correlated (r = .67), but that the corresponding self-concepts were nearly uncorrelated (r = .10). The paths from math achievement to MSC were positive (ß = .61), but paths from verbal achievement to MSC were negative (ß = -.27).
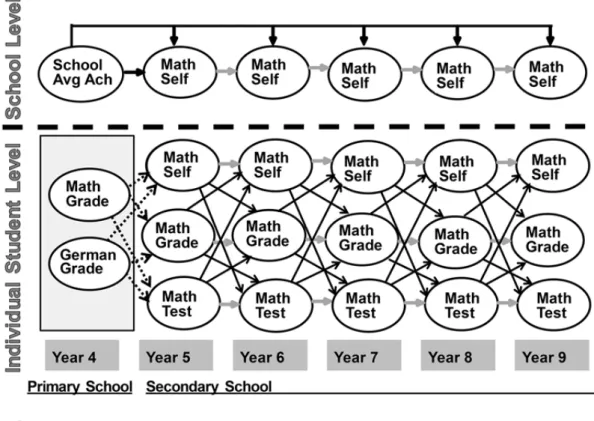
Figure 1. Integrated academic self-concept model. This single conceptual model (and associated statistical model in Table 1) provides tests of all three theoretical models of academic self-concept (ASC) and develop- mental equilibrium. The paths from math and German grades in Year 4 to MSC in Years 5 through 9 provide tests of the internal/external frame of reference model. The paths relating math achievement (test scores and grades) and self-concept in Years 5 through 8 to these measures in subsequent years provide tests of the reciprocal effects model. At the school level, the paths from school-average achievement to MSC provide tests of the big-fish-little-pond effect. The consistency of the paths over time provides tests of developmental equilibrium. For the purposes of illustration, only lag-1 paths are shown (effects of each variable on variables in the immediately subsequent wave). However, in the final a priori model (see the integrated ASC model, Table 1; also see the online Supplemental Materials, Section 3) the following are shown: (i) paths from both math and German grades in Year 4 to all Years 5 through 9 outcomes (the dashed lines from Year 4 school grades to Year 5, but also paths for Year 4 school grades to outcomes in Years 6 through 9); (ii) all lag-1 to lag-4 autocorrelation (horizontal) test-retest paths relating all Years 5 through 9 variables in each Year to the same variable in all subsequent years (the solid horizontal lines from each variable in Years 5 through 8 to the same variable in the next year, lag-1 paths, but also paths from each variable to the same variable in all subsequent years: lags 2 through 4). These paths are constrained to be invariant across years (e.g., lag-1 paths from test scores in Year 5 to test scores in Year 6 are the same as the lag-1 path from test scores Year 8 to test scores in Year 9); (iii) All lag-1 and lag-2 cross-paths relating all Years 5 through 9 variables in each year to each of the different variables in the next year (only lag-1 paths are shown). These paths were constrained to be invariant across years (e.g., lag-1 paths from test scores in Year 5 to MSC in Year 6 were the same as the lag-1 path from test scores in Year 8 to MSC in Year 9); and (iv) covariances between all variables measured within the same wave (e.g., math and German grades at Year 4; MSC, test scores, and grades at Year 5). Support for
developmental equilibrium is based on goodness of fit tests (presented in greater detail in the online Supplemental Materials, Section 3) that provide support for this a priori prediction and a statistical
basis for constraining paths to be invariant across years. Parameter estimates (see Table 1) from this one multilevel, longitudinal path model are used to test the internal/ external frame of reference model, the reciprocal effects model and the big-fish-little-pond effect, in which school-average achievement is based on various combinations of Year 4 school grades, school track, and Year 5 test scores. The Mplus syntax and output showing the full set of lagged paths are presented in the Supplemental Materials, Section 8.
The REM of Relations Between ASC and Achievement
ASC and academic achievement are substantially correlated, but a critical question with important theoretical and policy–practice implications is the temporal ordering of these constructs. Traditional approaches to this issue (Calsyn & Kenny, 1977) took an “either-or” approach— either prior
achievement leads to subsequent ASC (a skill development model) or prior ASC leads to subsequent achievement (a self-enhancement model). However, integrating theoretical and statistical
perspectives, Marsh (1990) argued for a dynamic reciprocal effects model (REM) that incorporates both the skill development and the self-enhancement models, such that both ASC and achievement are posited to be causes and also effects of each other; the REM is testable when both constructs are collected in at least two but preferably three or more waves of data.
In meta-analyses of REM studies, Valentine et al. (2004; also see Huang, 2011) found consistent support for the REM. It is not surprising that prior achievement has an effect on ASC, as this is consistent with ASC theory and research. However, Valentine et al. demonstrated that the effect of prior ASC on subsequent achievement, after controlling for the effects of prior achievement, was also highly significant overall, and positive in 90% of the studies they considered. However, two
limitations of the results summarized in these meta-analyses are addressed here.
First, although REM studies are necessarily longitudinal, most studies are based on one, two or, perhaps, three waves of data, and do not cover an extended developmental period. Here we evaluate support for the REM on the basis of six waves of data covering the early to middle
adolescent (late primary school through high school; see subsequent discussion of Figure 1) period: This provides a stronger test of the consistency of effects over the potentially turbulent
developmental period.
Second, in REM studies, achievement typically is assessed by standardized tests or school grades— and yet, the different achievement indicators have different implications. School grades are a particularly salient source of feedback to students and their parents, are easily compared among classmates, and have important implications for academic careers. Hence, school grades tend to be more correlated with ASCs than they are with test scores (e.g., Marsh, Kuyper, Morin, et al., 2014; Marsh, Kuyper, Seaton, et al., 2014; Marsh, Trautwein, et al., 2005). However, school grades typically are idiosyncratic to specific teachers, settings, and schools. In particular, teachers typically grade on a curve, allocating the highest and lowest grades to the relatively best and least- well performing students within a classroom, respectively. Hence, teachers use the classroom as a narrow frame of reference in their grading procedure, largely ignoring the absolute levels of achievement of students in their class based on a common metric that generalizes over all students. Although the classic meta-analyses support REM predictions in respect of both school grades and test scores, most individual studies have included only one of these indicators of achievement, and apparently none have juxtaposed the two over such an extended developmental period as that considered here or in relation to developmental perspectives. Furthermore, incorporating both verbal and math test scores into the integrated ASC model integrates the typically cross-sectional tests of the I/E model with the reciprocal effects inherent in the REM, and the multilevel effects of school-average achievement in BFLPE studies.
The BFLPE: Social Comparison Effects
According to the BFLPE, students compare their own academic achievement with the achievements of their classmates, and use this social comparison as the basis of their ASCs (Marsh, Kuyper, Morin, et al., 2014; Marsh, Abduljabbar, et al., 2015; Marsh & Parker, 1984; Marsh, Seaton, et al., 2008; Nagengast & Marsh, 2012; Zell & Alicke, 2009). In the BFLPE, students who attend high-ability schools tend to have lower ASCs than do equally able students who attend mixed- or low-ability schools, which is a negative effect of school-average achievement on ASC.
There is now considerable support for the negative effects of school-average achievement on ASC (see reviews by Marsh, Sea- ton, et al., 2008; Marsh & Seaton, 2015). Demonstrating that the BFLPE is one of psychology’s most cross-culturally universal phenomena, three successive Programme for International Student Assessment (PISA) data collections (Marsh & Hau, 2003: 103,558 students from 26 countries; Seaton, Marsh, & Craven, 2010: 265,180 students from 41 countries; Nagengast & Marsh, 2012: 397,500 students from 57 countries) showed that the effect of school-average achievement on ASC was negative in all but one of the 123 samples, and significantly so in 114 samples. Further, not only does the BFLPE tend to increase in size during the period that students attend the same high school (Marsh, Köller, & Baumert, 2001), but Marsh, Trautwein, Lüdtke, Baumert, and Köller (2007) have shown that the BFLPE formed in high school is equally large, or larger, two (Study 1) and four (Study 2) years after graduation from high school. Similarly, Marsh and O’Mara (2008; Guo, Marsh, Parker, & Morin, 2015) showed that ASC formed in high school
contributed to the prediction of long-term educational attainment eight years later, and beyond the effects of school grades, standardized achievement tests, IQ, and socioeconomic status.
Nevertheless, BFLPE studies have several limitations; these are addressed in the present research. First, most BFLPE studies are cross-sectional, so that the school-average achievement associated with a particular school might reflect either the ability of students prior to attending that school, or the subsequent effects of the school on achievement— potentially confounding the temporal ordering. Second, the primary focus on school-average achievement as a measure of de facto selectivity (e.g., selectivity based on neighborhood) might not generalize to explicit selectivity when students are tracked into different schools on the basis of prior achievement (see Marsh, Köller, & Baumert, 2001). Third, because school grades typically do not reflect a common metric, previous BFLPE studies have been based on test scores rather than on school grades. However, school grades are a more salient measure of achievement than are standardized test scores, influence ASCs more than test scores do, and are often an important basis for tracking students. Nevertheless, because of the grading on a curve effect, school-average grades are unlikely to be comparable over schools when schools differ in terms of mean achievement levels. Finally, BFLPE studies traditionally evaluate school-average achievement in the same domain as the corresponding measure of ASC (e.g., the effects of school-average math achievement on MSC). However, integrating the I/E and BFLPE leads to the question of how school-average achievement in a contrasting domain might affect ASC (i.e., the effect of school-average verbal achievement on MSC). Given the unique design of our study, we were able to address each of these limitations of prior BFLPE research by integrating different theoretical and developmental perspectives.
Integrating Developmental Equilibrium into the Integrated ASC Model
Developmental equilibrium. Our study is based on testing the empirical support for what has been referred to as develop- mental equilibrium (Marsh, Craven, et al., 2016; Marsh, Pekrun, Lichtenfeld, et al., 2016; Marshall et al., 2015; see the online Supplemental Materials, Section 1, for further discussion). Although the term equilibrium comes from the physical sciences, it has long been applied as an analogous concept in psychological theorizing—particularly in developmental psychology. Equilibrium is reached when a system achieves a state of balance between potentially
equilibrium balancing competing drives and desires, Argyle, 1967; Erikson, 1974; self- actualization as an equilibrium between actual and ideal self- perceptions; Rogers, 1961). In child development, Piaget and Cook (1952) argued that the psychological system aims to achieve a steady state of equilibrium that allows children to accommodate new experiences using existing schemas, whereas disequilibrium forces children to change their cognitive structures to regain equilibrium. In each of these different perspectives on equilibrium, the critical issue is that of balance, posited to be a psychologically desirable state, and indicating consistency over time.
Here we evaluate support for developmental equilibrium through tests of the consistency of
relations among critical variables over early to middle adolescence—that is, whether the self-system is consistently in a state of balance during this period. Thus, for example, Davis-Kean et al. (2008; also see Davis-Kean, Jager, & Collins, 2009) reported that the relation between ASC and achievement changed with age for young children, but became relatively stable from the age of about 12. This suggests that this relation is stable and has reached a state of equilibrium during the early to middle adolescent period, which is the focus of our study.
Although the term is often used metaphorically, achieving a state of equilibrium clearly has important substantive and psycho- logical implications. Here, however, we operationalize this perspective by integrating it with formal statistical models of longitudinal invariance, based on models of the invariance of effects across multiple waves of data. This has theoretical,
developmental, and substantive implications: for example, the question of whether the effect sizes of critical components in each of these models of ASC formation vary developmentally (Eccles, 2009; Marsh, 2007; Marsh & O’Mara, 2008; Marsh, Seaton, et al., 2008; Murayama et al., 2013), including the relative sizes of paths leading from achievement to ASC, and ASC to achievement in the REM; the size of the BFLPE; and the strength of the internal comparison process in the I/E model. In summary, our major developmental focus is on tests of developmental equilibrium: the consistency over time of relations between ASC and achievement in reference to predictions from the three theoretical ASC models, over the potentially turbulent period of early to middle adolescence (e.g., Eccles, 2009; Eccles et al, 1993; Harter, 2012: Steinberg, 2008).
We also note that our notion of developmental equilibrium closely resembles Fraley, Roisman, and Haltigan’s (2013) “Legacy of Early Experiences in Development,” which they present as an important, ongoing debate in developmental science. Specifically, they argue: “By studying the pattern of associations across time, it should be possible to gain greater insight into the legacy of early
experiences” (p. 113). Indeed, their paradigmatic models closely resemble our integrated ASC model (see Figure 1). They proposed models of the longitudinal effects of a particular event in time that are similar to our evaluation of primary school grades and school-average ability. Their emphasis, like ours, was on the direct and indirect effects of a variable over time. However, as in our evaluation of the REM, they also proposed cross-lagged panel models of the same variables measured on multiple occasions over time. Indeed, our a priori hypothesis of developmental equilibrium can be seen as a special case of a more general model, in which selected effects are consistent over time—a
possibility that they introduced by testing the equality of parameter estimates across multiple waves of data. Like us they argued for consideration of more than two waves of data in which the same constructs are studied—ideally, covering an important developmental period. Further, their study, like ours, integrates multiple models into a single theoretical and statistical framework.
Conceptual implications and new theoretical predictions. Given the importance of studying the consistency of patterns of associations over time (Fraley et al., 2013), we sought to test the consistency of support for predictions from each the ASC models over the critical early to middle adolescent period. The I/E model is the best-known system of knowledge that captures both the social and the dimensional comparison processes that give rise to the ASC. In contrast, the REM model represents the theoretical implications of self-concept for the critical outcome of
achievement. Intriguing paradoxical hypotheses arise from the integration of these theoretical models: In the I/E model, MSC is positively predicted by math achievement but negatively predicted by verbal achievement (the dimensional comparison process). This suggests, perhaps, that verbal self-concept might also have a negative effect on subsequent math achievement (in contrast to the
positive effect of MSC; Parker, Marsh, Morin, Seaton, & Van Zanden, 2015). Although this untested hypothesis appears counterintuitive, it follows directly from the theoretical integration of the I/E and the REM.
Next, we consider the place of the BFLPE within this integrated system. Unlike the REM and, perhaps, the I/E model, the BFLPE is the result of a particular event at a given point in time—namely, school selection—and thus can be considered as distinct from the integrated I/E and REM’s operation within high school. Thus, unlike the REM and the I/E, the BFLPE can be seen as a response to an age-graded developmental task. Specifically, at age 10, children in Germany are sorted into different academic tracks and into schools of different average ability. This sorting of children in relation to prior achievement thus determines a child’s relative position within their peer environment and
subsequently, the influence of the school context on their self-concept (i.e., the BFLPE). The question then is what role this early developmental experience plays in the REM I/E system. Several
possibilities are suggested by Fraley et al. (2013). First, the effect could be initially impactful, before trailing off over time. This might be the case if initial position within the school becomes less important for self- concept over time. In this case, we would expect the effect of school average achievement on ASC to decline over time. Should this be so, the need to address the BFLPE, to arrest poor ASC and its effect on performance, might take on less practical and research significance. Alternatively, the BFLPE could have an enduring or even increasing effect, such that school
placement might assume even more prominence, due to its enduring effect on ASC. Likewise, from the perspective of the REM model, school placement might have an increasing effect, due to its influence on subsequent achievement. Furthermore, and given the I/E model, school- average achievement in one subject might have contrasting effects on ASC and achievement in other subjects.
Taken together then, this research considers the legacy of school selection (as per the BFLPE) on the system of ASC given by the integration of the I/E and REM effects. These new research issues and other benefits come from the heuristic integration of the different models into a unified conceptual framework of self- concept formation. (Also see the online Supplemental Materials Section 7 for other examples of new predictions based on the integrated ASC model.)
Methodological and design implications. Appropriate analysis of the integration of the ASC (I/E, REM, and BFLPE) models and developmental perspectives requires large, representative, longitudinal samples of students from many different schools. Particularly in BFLPE studies, appropriate multilevel models are required that also take into account the nesting of students within schools. Likewise, in REM studies, at least two and preferably many more than two waves of data are required, to test reciprocal effects between ASC and achievement, whereas in the I/E model it is important to contrast ASCs and achievement in at least two domains—typically, math and verbal. Statistical tests of
developmental equilibrium require that the same set of variables be collected in at least three waves of data that span a critical developmental period of interest.
Due in part to methodological and design features that are idiosyncratic to each, research into each of these theoretical models has developed somewhat in isolation of the others. Methodologically, constraining paths to be equal (our test of developmental equilibrium) has statistical advantages (e.g., model identification, convergence, improved parsimony, increased statistical power, ease of interpretation) that are completely aside from the substantive meaning associated with support for developmental equilibrium. Although individual studies, and particularly meta- analyses of the three models of ASC, evaluate the consistency of effects over different age groups, this is rarely based on true longitudinal data in which the same set of variables is administered to the same individuals over an extended developmental period. Extending research into each of these ASC models, we posit new developmental perspectives on each through the integration of all three into a single study. From a developmental perspective, appropriate longitudinal data, strong theoretical models, and
appropriate statistical analyses are important in testing the consistency of support for predictions over critical stages of development, such as the potentially turbulent years of early to middle adolescence considered here.
The Present Study: A Priori Research Hypotheses and Research Questions
Here we integrate and extend three major ASC models (REM, I/E, and BFLPE) to form an integrated ASC model in a longitudinal study of developmental equilibrium. Data (a representative sample of 3,370 students from 42 schools) were collected from the year before the start of secondary school (Year 4 school grades in German and math) and in each of the subsequent 5 years of compulsory secondary schooling in Germany (math school grades, standardized math achievement tests and MSCs). We seek to demonstrate that the three theories of self-concept formation, developmental equilibrium, and appropriate statistical methodology can be unified in a single model, as presented in Figure 1. 1
Hypothesis 1: I/E Model—Paths From Year 4 Variables to Variables in Years 5 Through 9
In Figure 1, paths (dashed lines) from primary-school math grades (Year 4) to MSC (Year 5) are predicted to be positive, but those leading from primary-school German grades (Year 4) to MSC (Year 5) are predicted to be negative (noting however, that we cannot test the corresponding paths to German self-concept, because we do not have measures of German self-concept). We leave as a research question whether there are direct effects of primary-school grades on subsequent MSCs (e.g., the effect of primary grades on MSC in Years 6 through 9 after controlling for the effects of math test scores, school grades in math, and MSCs in Year 5). However, in support of developmental equilibrium, we hypothesize an enduring legacy of the effects of achievement at the end of primary school on outcomes across secondary school years: that the total effects of primary-school grades are invariant over the multiple waves of data.
Hypothesis 2: REM—Paths Relating Variables in Years 5 Through 9
Consistently with REM research, we posit that paths leading from prior achievement to subsequent MSC (e.g., paths leading from test scores and school grades in Year 5 to MSC in Year 6) will be positive, as will be paths leading from prior MSC to subsequent achievement. In support of developmental equilibrium, these lag-1 paths (i.e., paths from variables in one wave to the immediately next wave in Figure 1; also see the Fraley et al., 2013) are predicted to be consistent over all five waves.
Hypothesis 3: BFLPE: School-Average Achievement Effects on MSC in Years 5 Through 9
Consistently with previous BFLPE theory and research, we predict that school-average
achievement, operationalized in a variety of ways, will have a negative predictive effect on ASC measured in each of the first 5 years of secondary school. However, several features of our study contribute to the unique perspective on this issue that extends previous research. Most BFLPE
1 In presentation of the predictions and subsequent path analytic results, we use the term effect in its conventional statistical sense and standard path analytic terminology, as representing a relation that is not necessarily causal (see subsequent discussion of limitations in the Discussion section).
studies (Marsh, Seaton, et al., 2008; Marsh & Seaton, 2015) evaluate de facto selection (e.g., naturally occurring differences in school-average achievement on the basis of geography or post- code) on the basis of the school-average test scores at some point in secondary school, and relate this contextual variable to ASCs collected in the same school year.
As such existing BFLPE research has several potential limitations that we were able to address in this research. Thus, in our integrated ASC model (Table 1 and Figure 1), school-average math
achievement is represented as a latent variable defined by three distinct contextual variables: the traditional BFLPE measure of school-average achievement based on test scores in the first year of secondary school (Year 5, based on tracked schools); school track (high, medium, or low), based on student accomplishments prior to the start of secondary school; and school-average math grades, based on the last year of primary school. However, due to the methodological and theoretical differences associated with each of these contextual measures, we also tested each of them separately.
We hypothesize an enduring and important legacy of the negative effects of school-average achievement at the end of primary school on MSC outcomes across secondary school years. More specifically, the developmental equilibrium proposal leads to the prediction that the total effects of school-average achievement at the start of secondary school are consistent in size across the ensuing years of secondary education. However, we also note that there is an apparent clash between this prediction and previous research showing that the BFLPE increases in size the longer students are in the same school (e.g., the BFLPE should be most negative in Year 9). Hence we leave the
juxtaposition of these two contrasting predictions as a research question, but note that both are consistent with the hypothesis that the BFLPE has an enduring, negative legacy.
Table 1
Integrated ASC Model: Path Coefficients Leading From Predictor Variables in Years 4 Through 8 to Math Outcomes (School Grades, Self-Concept, Test Scores) in Years 5 Through 9
Predictor MSelf5
Estimate SE Predictor Estimate SE Predictor Estimate SE
MGrd5 MTest5
MGrd4 .49 .04 MGrd4 .42 .03 MGrd4 .59 .03
GGrd4 -.26 .04 GGrd4 .01 .03 GGrd4 .09 .03
MSelf6 MGrd6 MTest6
MSelf5 .45 .01 MGrd5 .47 .02 MTest5 .48 .02
MTest5 .11 .02 MTest5 .17 .02 MSelf5 .04 .01
MGrd5 .14 .02 MSelf5 .07 .01 MGrd5 .04 .01
MGrd4 .18 .04 MGrd4 .13 .03 MGrd4 .25 .03
GGrd4 -.20 .04 GGrd4 -.07 .02 GGrd4 .13 .03
MSelf7 MGrd7 MTest7
MSelf6 .45 .01 MGrd6 .47 .02 MTest6 .48 .02
MTest6 .11 .02 MTest6 .17 .02 MSelf6 .04 .01
MGrd6 .14 .02 MSelf6 .07 .01 MGrd6 .04 .01
MGrd4 .03 .04 MGrd4 .03 .03 MGrd4 .13 .03
GGrd4 -.12 .03 GGrd4 -.02 .03 GGrd4 .06 .03
MSelf8 MGrd8 MTest8
MSelf7 .45 .01 MGrd7 .47 .02 MTest7 .48 .02
MTest7 .11 .02 MTest7 .17 .02 MSelf7 .04 .01
MGrd7 .14 .02 MSelf7 .07 .01 MGrd7 .04 .01
MGrd4 .03 .04 MGrd4 -.04 .03 MGrd4 .11 .02
GGrd4 -.08 .04 GGrd4 -.06 .03 GGrd4 .09 .02
MSelf9 MGrd9 MTest9
MSelf8 .45 .01 MGrd8 .47 .02 MTest8 .48 .02
MTest8 .11 .02 MTest8 .17 .02 MSelf8 .04 .01
MGrd8 .14 .02 MSelf8 .07 .01 MGrd8 .04 .01
GGrd4 -.03 .04 GGrd4 -.02 .03 GGrd4 .05 .02 BFLPE Schl-Ach5 -.25 .08 Schl-Ach .03 .12 Schl-Ach .03 .09 Schl-Ach -.01 .07 Schl-Ach -.17 .07
Note. Coefficients more than 1.96 times its standard error (values in parentheses) are statistically significant at a nominal p < .05. Consistently with support for developmental equilibrium, lagged paths are constrained to be invariant across the Years 5 through 9. For example, the lag-1 path MTestYear5 ¡ MSelfYear6 = .447 is equal to the corresponding lag-1 path MtestYear6 ¡ MSelfYear7 = .447). The results from this model are used to test predictions in relation to developmental
equilibrium (DevEq), the internal/external frame of reference model (I/E), the reciprocal effects model (REM), and the
big-fish-little-pond effect (BFLPE). Coefficients in bold are statistically significant at p < .05. ASC = academic self-concept; MGrad = Math School grades (Years 4 through 9); MSelf = Math self-concept (Years 5 through 9); MTest = math test scores (Years 5 through 9); GGrad = German (Deutsch) school grades (Year 4 only); pred = predictor variables; I/E = internal/external; DevEq = developmental equilibrium.
A unique aspect of our study, arising from the integration of the BFLPE and I/E models, is the juxtaposition of effects of school-average math and verbal achievement, based on primary school grades, on subsequent MSC during the next 5 years of high school. Because both math and German contribute substantially to tracking decisions, it might be expected that the effects of school- average measures would have similar results. However, the I/E model suggests that at the individual student level, the effects of math and German grades would be in opposite directions. Extrapolating from this I/E-logic, it may be that school-average German achievement has a positive effect on MSC (in
contrast to the negative effects of school-average math achievement on MSC). Hence, we leave as a research question whether the effects of school-average math grades in Year 4 on MSC differ substantially from those of school-average German in Year 4 on MSC.
Hypothesis 4: Developmental Equilibrium: Consistency of Paths Over Time (Years 5 Through 9)
Consistently with predictions based on developmental equilibrium, the critical features of our a priori model are the stability- and cross-paths in Figure 1.
1a. Autocorrelation paths. All autocorrelation (test–retest, horizontal) paths relating all Years 5 through 9 variables in each wave to the same variable in the subsequent wave (see Figure 1) are expected to be invariant across waves (e.g., all lag-1 stability paths for MSC measured in one wave to MSC measured in the next wave are constrained to be the same across all five waves).
1b. Cross-paths. Cross-paths relating all variables in Years 5 through 9 in each wave to each of the different variables in subsequent waves (see Figure 1) are also expected to be invariant across waves (e.g., lag-1 paths from test scores in Year 5 to MSC in Year 6 are the same as the lag-1 path from test scores in Year 8 to MSC in Year 9). These cross-paths in our integrated ASC model are of particular importance in testing predictions for the three theoretical ASC models that are based on the cross-paths. In particular, tests of the invariance of cross-paths provide a very strong test of developmental equilibrium and the consistency over time of predictions based on these theoretical models.
Method
Sample
The data in our study were based on the Project for the Analysis of Learning and Achievement in Mathematics (PALMA; Frenzel, Pekrun, Dicke, & Goetz, 2012; Marsh, Pekrun, Lichtenfeld, et al., 2016; Marsh, Pekrun, Parker, et al., 2016; Murayama et al., 2013; Murayama et al., 2016; Pekrun et al., 2007; Pekrun, Lichtenfeld, Marsh, Murayama, & Goetz, 2017), a large-scale longitudinal study investigating the development of math achievement and its determinants during secondary school in Germany. The study was conducted in the German federal state of Bavaria and consisted of five measurement waves spanning Years 5 to 9 in secondary school (the last 5 years of compulsory education), as well as school grades from the last year of primary school (Year 4). A unique aspect of our study that derives from the nature of the German school system is that the primary schools considered here, in contrast to the secondary schools, were not tracked, and thus were relatively heterogeneous in relation to achievement in Year 4 (prior to the start of secondary school). Primarily on the basis of primary school performance, starting in Year 5, students are tracked into three school types that are relatively homogeneous in relation to achievement: high- achievement (Gymnasium), middle-achievement (Realschule), or low-achievement (Hauptschule) school tracks.
Excluding a small number of students for whom tracking was not introduced until Year 7 rather than Year 5, students (N = 3,450; 50% girls; M age = 11.7 at Year 5, SD = 0.7), the sampling design resulted in a representative sample of students in Bavaria, in terms of student characteristics (e.g., gender, urban vs. rural, socioeconomic status; see Pekrun et al., 2007). At the first assessment (Grade 5), the sample comprised 2001 students. In each subsequent year, the study not only tracked the children who had participated in previous assessments, but also included those children who had not yet participated in the study but had become children of PALMA classrooms at the time of the
assessment (see Pekrun et al., 2007), resulting in sample sizes of 1,992 (Year 6), 2,327 (Year 7), 2,342 (Year 8), 8; and 2,461 (Year 9) 2,461. Due in part to this sampling design, a substantial portion of the sample had missing data for at least one of the measurement waves. Across the five waves, 38% participated in all five measurement waves (i.e., Grades 5 through 9), and 9%, 19%, 15%, and 19% took part in four, three, two, or one of the assessments, respectively.
Students answered the questionnaire toward the end of each successive school year. All instruments were administered in the students’ classrooms by trained external test administrators. Participation in the study was voluntary and parental consent was obtained for all students. Agreement was high (100% for schools and over 90% for students at each data wave), and the final sample closely represented the intended sample and population more generally (Pekrun et al., 2007). Surveys were identified by an anonymous code number to ensure participant confidentiality.
Measures
MSC was measured in each of the five secondary school years (Years 5 through 9) with the same set of six items, using a five-point Likert scale, ranging from not true, hardly true, somewhat true, largely true, to absolutely true. Across the five waves, the alpha estimates of reliability were consistently high (Year 5 a. .88; Year 6 a. .90; Year 7 a. .89; Year 8 a. .91; Year 9 a. .92). The items used to measure MSC were as follows: “In math, I am a talented student”; “It is easy for me to understand things in math”; “I can solve math problems well”; “It is easy to me to write tests/exams in math”; “It is easy to me to learn something in math”; “If the math teacher asks a question, I usually know the right answer”.
Students’ achievement was measured with school grades (math in Years 4 through 9; German in Year 4) and math standardized achievement test scores (Years 5 through 9). School grades were end-of-the-year final grades obtained from school documents. The standardized PALMA Math Achievement Test (Murayama et al., 2013; Pekrun et al., 2007) was based on multiple-choice and open-ended items to measure students’ modeling and algorithmic competencies in arithmetic, algebra, and geometry. The test was constructed using multimatrix sampling with a balanced incomplete block design, such that the number of items increased with each wave, varying between 60 and 90 items across the five waves, with anchor items to allow for linking the two test forms and the five measurement points. The obtained achievement scores were scaled using one-parameter logistic item response theory, confirming the unidimensionality and longitudinal invariance of the test scales (Murayama et al., 2013).
Statistical Analyses
All analyses were done with Mplus 7.3 (Muthén & Muthén, 2008 –2015). We used the robust maximum likelihood estimator, which is robust against any violations of normality assumptions. All analyses were based on multilevel models (type = two level in Mplus) using manifest variables (Lüdtke, Marsh, et al., 2008; Marsh, Lüdtke, et al., 2009). Specifically, students were nested within schools, resulting in the nonindependence of observations. Ten imputed data sets were created using the default model in Mplus (see earlier discussion of the sampling design), which included all variables used in the analyses, including school- average measures of math achievement and also student background variables (i.e., socioeconomic status, gender, IQ). The final parameter estimates and fit statistics were obtained through the aggregation procedure implemented in Mplus, following Rubin’s (1987) rules.
To facilitate interpretation of parameter estimates and tests of developmental equilibrium, we standardized all measures. As the standardized math test varied from year to year, test scores were standardized separately for each year. For school grades and self- concept responses that varied along a common metric, all measures were standardized in relation to values at Wave 1 (Year 5; see the online Supplemental Materials, Section 2), resulting in a standard effect size metric in relation to standard-deviation units. Particularly in longitudinal cross-lagged studies covering such a substantial period of time with many waves of data, it is important to distinguish between direct effects (the path coefficients in traditional path models) and total effects (the sum of these direct effects and the indirect effects that are mediated through intervening variables).
Developmental Equilibrium: Rationale for the Final Integrated ASC Model
In tests of developmental equilibrium, we conducted formal tests of the invariance of paths leading from one wave to the next, across all waves. To conserve space and maintain a focus on substantive issues, the detailed models in support of developmental equilibrium and related statistical issues are presented in the online Supplemental Materials, Sections 1 and 3, and summarized here briefly. The pattern of path coefficients is determined in part by the number of lags included (see Figure 1). Thus, lag-1 paths are from a variable in one wave to a variable in the next wave, whereas lag-4 paths are from a variable in Wave 1 (Year 5) to a variable in Wave 4 (Year 9). The rationale for including paths greater than lag-1 was based on a mix of theoretical and empirical results. A priori, there is no reason why a model with only lag-1 paths should be the best model (see related discussion by Fraley et al., 2013, who also propose that models with paths greater than lag-1 should routinely be
considered). If additional paths are needed to achieve a good fit, then constraining them to be zero is likely to bias the results and the interpretation of the lag-1 paths. Hence, the theoretically more
conservative approach is to include additional paths unless there is clear evidence that they are not needed.
Our final model (see Figure 1) included the following paths: from Year 4 (the last year of primary school) to all subsequent variables in the next 5 years (the first 5 years of secondary school); autocorrelation (horizontal) test-retest paths from variables (Years 5 through 9) in one wave to variables in subsequent waves (lags 1 through 4); cross-paths from measures (Years 5 through 9) of one construct to a different construct in the next two waves (lag-1 and lag-2 paths). In preliminary analyses (see Models 1 through 4 in the online Supplemental Materials, Section 3), we explored how many lags were needed to fit the data. Models with only lag-1 paths provided a poor fit to the data. Inclusion of paths from the two primary school (Year 4) variables to all variables in Years 5 through 9 (rather than only lag-1 paths to just the Year 5 variables) improved the fit. However, Model 4 (with lags 1 through 4 autocorrelation paths but only lag-1 and lag-2 cross paths) provided an excellent fit to the data (see the online Supplemental Materials, Section 3); this is consistent with our supposition that more than lag-1 paths are needed. This model with multiple lags is also conservative, providing stronger controls for preexisting differences, particularly compared with the typical approach used in developmental studies, which are based on only two waves of data, and studies with more than two waves of data that ignore paths other than lag-1 effects.
In Model 5 (see the online Supplemental Materials, Section 3), we added invariance constraints to Model 4 to test the a priori assumption of developmental equilibrium (that the paths are consistent over waves). In Model 5, there was strong support for complete invariance of autocorrelation- and cross-paths, across all waves.
This included the invariance of cross-paths (e.g., MSC wave𝑖𝑖 Test Scores wavei+1 = MSC
wavei+1 Test scoresi+2), which are central to tests of predictions from our three theoretical
models of ASC formation. However, autocorrelation paths for Lag 1 through 4 paths were also shown to be invariant. For example, not only were lag-1 paths invariant (e.g., MSC wave𝑖𝑖 MSC wavei+1 =
MSC wavei+1 ¡ MSC wavei+2), but also lag-2 paths (e.g., MSC wavei ¡ MSC wavei+2 = MSC wavei+1 ¡ MSC wavei+3), lag-3 paths and lag-4 paths were also invariant. The fit of Model 5 was excellent, and differed little from that of Model 4 with no invariance constraints; this provides support for the more parsimonious model. In the final model in this sequence (i.e. the integrated ASC model; see the online Supplemental Materials, Section 3), we added three school-level variables (school-average math grades from Year 4, school track, and school-average test scores) that defined a latent variable used to infer school-average achievement. This model provided an excellent fit to the data and provided the basis for all subsequent analyses. This latent factor of school-average achievement was well-defined (e.g., standardized factor loadings for the three indicators varied from .94 to .98) and inclusion of the factor at the school level actually resulted in a marginally better fit to the data, relative to the model with no school- level factors (see the online Supplemental Materials, Section 3). Finally, we repeated all the analyses leading up to the final model, including the latent
school-average achievement factor to the final model (see the online Supplemental Materials, Section 3), demonstrating that this did not alter conclusions about the structure of the model at the student level.
This final multilevel model (see Figure 1 and Table 1; also see the online Supplemental Materials, Section 3, for further discussion) is referred to as the integrated ASC model because parameter estimates from this one statistical model provide tests of a priori predictions in relation to the internal/external frame of reference model (Hypothesis 1), the reciprocal effects model (Hypothesis 2), and the big-fish-little-pond effect (Hypothesis 3). Support for the invariance of path coefficients over Years 5 through 9 (the first 5 years of secondary school), demonstrated through tests of developmental equilibrium, provides an important developmental perspective on each of the ASC models considered here. Thus, the invariance of parameter estimates over time provides support for developmental equilibrium in respect of each of the ASC models (Hypotheses 1 through 3), as well developmental equilibrium more generally.
Results
The latent correlation matrix among student-level variables (see the online Supplemental Materials, Section 2) provides an advanced organizer in relation to subsequent analyses. Math test scores in secondary school (Years 5 through 9) were substantially and consistently correlated across the 5 years for both primary school (Year 4) math grades (rs = .65 to .70) and German grades (rs = .48 to .57). Interestingly, these correlations of primary school grades with secondary school test scores were substantially higher than corresponding correlations between test scores and school grades in secondary school (.26 to .43). This is consistent with earlier discussion, and suggests that school grades in untracked primary schools are more like test scores, in that they reflect a more common underlying metric continuum than do grades in Years 5 through 9 in the highly tracked secondary schools. These results have potentially important implications for understanding the grading on a curve phenomenon (see Supplemental Materials, Section 2, for further discussion), as well as our subsequent use of school-average achievement based on these Year 4 math grades. Finally, consistent with much previous research, correlations between MSC and school grades (rs = .42 to .62) are higher than the corresponding correlations between MSCs and test scores (rs = .30 to .34).
Frame of Reference Effects: The I/E Model (Hypothesis 1)
In tests of the I/E model, our focus is on the dashed paths in Figure 1, reflecting the effects of primary school grades (Year 4) on subsequent measures of MSC collected during secondary school (Years 5 through 9). Tests of this model are based on our integrated ASC model (see Table 2). Consistent with the I/E model and Hypothesis 1, the path from Year 4 math grades to MSC in Year 5 is significantly positive (.49, Table 2), whereas the path from Year 4 German grades to Year 5 MSC is significantly negative (–.26).
As noted previously, in evaluating the consistency of effects of Year 4 grades over MSC in Years 5 through 9 we focus on total effects (but present both total and direct effects in Table 2). The total effects of Year 4 Math grades on MSCs in Years 5 through 9 were consistently positive (paths = +.48 to +.54) and were not significantly different from each other (Wald test [df = 4] =8.195, p = .085). In contrast, the total effects of Year 4 German grades on MSCs (paths = -.25 to -.29) in Years 5 through 9 were consistently negative, but again were not significantly different from each other (Wald test [df = 4] = 1.179, p = .703). In summary, there is strong support for the I/E model and for the developmental equilibrium hypothesis, on the basis of the consistency of the effects of Year 4 grades across MSC in Years 5 through 9.
It is also informative to evaluate the direct effects of Year 4 grades on Years 5 through 9 outcomes, controlling for intervening variables (noting that both the direct and total effects are based on Model 7). The question then becomes what are the direct effects of Year 4 school grades on, for example, Year 9 MSC after controlling for the indirect effects that are mediated through MSC, math school grades, and math test scores from Years 5 through 8 (the direct paths in Table 2 are the same as those presented in Table 1, but are repeated to facilitate the comparison of direct and total effects in Table 2). Beyond Year 5, the direct effects of Year 4 math grades continue to be significantly positive for Year 6 MSC (.18), in addition to the positive effects on Year 5 MSC (path =.49), whereas paths to MSC in Years 7 through 9 are nonsignificant. Of course, in subsequent Years 6 through 9, there are still substantial total effects of Year 4 math grades, but these are mediated through outcomes in intervening years.
The pattern of results based on Year 4 German grades is different. In addition to effects on MSC at Year 5, there are new, statistically significant negative direct effects on MSCs in Years 5 through 8 (– .20, -.12, and -.08, respectively). It is only in Year 9 that the negative effects of Year 4 German grades are no longer statistically significant. These new effects of Year 4 German grades in Years 7 and 8 are likely to be due to the fact that intervening variables during secondary school years did not include measures of German achievement, which would otherwise mediate the effects of Year 4 German grades, as was the case with Year 4 math grades.
Table 2
Tests of the Internal/External Frame of Reference Model
Outcome prediction
Math self Math grade Math test Year Predictor Estimate SE Estimate SE Estimate SE
5 Total MGrd4 .49 .04 .42 .03 .59 .03 GGrd4 -.26 .04 .01 .03 .09 .03 Direct MGrd4 .49 .04 .42 .03 .59 .03 GGrd4 -.26 .04 .01 .03 .09 .03 6 Total MGrd4 .54 .05 .46 .03 .57 .03 GGrd4 -.29 .05 -.07 .03 .16 .03 Direct MGrd4 .18 .04 .13 .03 .25 .03 GGrd4 -.20 .04 -.07 .02 .13 .03 7 Total MGrd4 .48 .04 .38 .04 .56 .04 GGrd4 -.28 .04 -.04 .04 .15 .04 Direct MGrd4 .03 .04 .03 .03 .13 .03 GGrd4 -.12 .03 -.02 .03 .06 .03 8 Total MGrd4 .48 .05 .34 .03 .58 .03 GGrd4 -.27 .04 -.09 .03 .19 .03 Direct MGrd4 .03 .04 -.04 .03 .11 .02 GGrd4 -.08 .04 -.06 .03 .09 .02 9 Total MGrd4 .49 .04 .34 .03 .58 .03 GGrd4 -.25 .05 -.06 .03 .18 .03 Direct MGrd4 .03 .04 -.04 .03 .08 .02 GGrd4 -.03 .04 -.02 .03 .05 .02
Note. Mgrd4 = Math school grades in Year 4. Ggrd4 = German school grades in Year 4. Effects
(standard errors in parentheses) are for German and math school grades from primary school (Year 4) on secondary school outcomes in Years 5 through 9 (math self-concept, math school grades, and math test scores). Total effects include both direct and indirect effects. Thus, for example, the total effects of Year 4 math grades on Math grades in Years 5 through 9 are consistently substantial (.459 to .420), but direct effects are only significant for Years 5 and 6; most of the effects of Year 4 Math school grades on Math grades in Years 7 through 9 are mediated through math grades in Years 5 and 6. Coefficients in bold are statistically significant at p < .05. Also see Figure 1 and Table 1.
REM: Temporal Ordering of School Grades, Test Scores, and MSC (Hypothesis 2)
In evaluating the temporal ordering of ASC and achievement, we focus on lag-1 cross-paths relating MSC and math achievement (see Figure 1). The results are consistent with the REM (Hypothesis 2): For our integrated ASC model (see Table 3; also see Figure 1 and Table 1), paths are positive leading from prior MSC to subsequent achievement (school grades, .07, SE = 01; and test scores, .04, SE = .01) and from prior achievement to subsequent MSC (school grades, .14, SE = 02; and test scores, .11, SE = .02). The reciprocal effects associated with school grades were significantly higher than were those for test scores (Wald = 9.761, df = 2, p = .008). This also is consistent with previous research, although these differences were surprisingly small (see Table 3). In additional models (see Table 3) we also tested the effects of grades (without test scores) and test scores (without grades). Not surprisingly, when both school grades and test scores were considered separately, the sizes of the reciprocal effects between achievement and MSC were somewhat higher. However, the pattern of results was similar, in that all reciprocal effects were significantly positive.
Table 3
Tests of the Reciprocal Effects Model Based on Integrated Model: Lag-1 Paths From Each Predictor Variable in One Year to Each Outcome in the Next Year for Math Self-Concepts, Grades, and Test Scores in Secondary School Years 5 Through 9.
Note. Estimates (standard errors in parentheses) for the integrated academic self-concept (ASC) model. For the reciprocal effects model, critical paths in relation to a priori redictions are the cross-paths leading from each predictor variable in one wave to a different outcome variable in the next wave (e.g., MtestYear5 ¡ MSCYear6 where M = math, SC = self-concept). Horizontal paths are paths from each variable to the same variable in a subsequent wave (e.g., MtestYear5 ¡ MSCYear6). Consistently with support for developmental equilibrium in the integrated ASC model, lag-1 paths are constrained to be invariant across Years 5 through 9 (e.g., MtestYear5 ¡ MSCYear6 =MtestYear6 ¡ MSCYear7). In variations to the integrated ASC model specific to the reciprocal effects model, we tested separately for math grades and standardized tests. Coefficients in bold are statistically significant at p < .05.
Outcome prediction
Math self Math grade Math test
Predictor Estimate SE Estimate SE Estimate SE
Integrated ASC model (grades and test scores)
Math self-concept .45 .01 .07 .01 .04 .01
Math grades .14 .02 .47 .02 .04 .01
Math test .11 .02 .17 .02 .48 .02
Predictor grades only
Math self-concept .48 .01 .10 .01
Math grades .16 .01 .51 .02
Predictor test only
Math self-concept .52 .01 .05 .01
BFLPE: Negative Effects of School-Average Achievement (Hypothesis 3)
In support of this hypothesis and extensions of the BFLPE over the five secondary school Years 5 through 9 (see Figure 1), we begin with the integrated ASC model (see Table 4) in which school-average achievement is based on a latent factor defined by school-school-average math Year 4 grades, school-average test scores, and school track. This latent factor was well-defined, as correlations among the three indicators varied from .89 to .94, and the standardized factor loadings varied from .94 to .98. The direct effects were significant in Year 5, but were not significant in Years 6 through 8, indicating that the initial negative effects in Year 5 neither increased nor decreased during these years. However, there was a significantly negative direct effect in Year 9, indicating that the BFLPE is significantly more negative in Year 9, even after controlling for the negative effects in Years 5 through 8. This indicates that following the significant negative effect in Year 5, there is no significant change in the size of the BFLPE over the period of Years 6 through 8, but there is a new, significantly negative BFLPE at Year 9 beyond what can be explained in terms of the effects in Years 5 through 8.
This pattern of results for the direct effects is consistent with the finding that the total effects were statistically significant in all Years 5 through 9 (–.13 to -.26). The test of the equality of the total effects was rejected (Wald = 21.73, df = 4, p < .001), but orthogonal polynomial contrasts were nonsignificant for both linear and quadratic effects. However, comparisons of the total effect for each year against the mean effects for the other 4 years revealed only one statistically significant difference: the negative BFLPE was significantly smaller at Year 8 (–.13, p = .008; see Table 3). Interestingly, although the size of the BFLPE was most negative in Year 9 (–.31), this effect was not significantly different from the average total effects in Years 5 through 8 (p = .132). In summary, on the basis of the total effects, the direction of the BFLPE was reasonably consistent over the 5 years. Although the most negative effect was in the final year of mandatory school,the
nonsignificant linear trend suggests that the effects were notsystematically increasing or decreasing over this critical developmental period. Hence, there is clear support for Hypothesis 3: that there is an enduring negative legacy of the BFLPE.
Effects of different indicators of school-average math achievement and school track. In Models A1 through A3 (see Table 3), we tested the BFLPE separately for: school-average achievement based on Year 4 math grades (Model A1), school track (Model A2), and math test scores (Model A3). Not surprisingly, given the very high correlations among these different indicators, the pattern of results based on each is similar to that which is based on the latent factor already discussed. However, this consistency across the three indicators is important, as two of the indicators are based on primary school performance prior to the start of secondary school. In contrast to these true pretreatment indicators, most previous BFLPE studies are based on posttreatment measures of achievement—as with our school-average measure of math test scores.
Next, we juxtaposed the effects of school-average achievement based on math grades (Model A1) with those based on German grades (Model B1). The critical finding is that the negative BFLPEs for school-average German grades are nearly the same as those based on math grades. Again, this is not surprising, in that the correlation between these two school- average measures (r = .983) is very high, such that contextual effects associated with math and verbal performances could not be
Table 4
Big-Fish-Little Pond Effect (BFLPE): Effects of School-Average Variables on Math Self-Concept in Years 5 Through 9
Common model Model A1 Model A2 Model A3 Model B1 Latent factor School average School School average School average (A1 + A2 + A3) Math grades Track Math test German grades Dependent Estimate SE Estimate SE Estimate SE Estimate SE Estimate SE
MSC-Year 5 Total -.25 .08 -.18 .06 -.16 .05 -.23 .07 -.20 .06 Direct -.25 .08 -.18 .06 -.16 .05 -.23 .07 -.20 .06 MSC-Year 6 Total -.26 .08 -.19 .06 -.17 .05 -.23 .07 -.20 .06 Direct .03 .12 .02 .08 .01 .07 .04 .10 .04 .10 MSC-Year 7 Total -.18 .08 -.13 .06 -.10 .05 -.18 .07 -.12 .06 Direct .03 .09 .03 .06 .04 .05 -.02 .08 .05 .07 MSC-Year 8 Total -.13 .06 -.10 .05 -.07 .04 -.14 .06 -.10 .05 Direct -.01 .07 .00 .05 .00 .04 .00 .05 -.02 .05 MSC-Year 9 Total -.31 .09 -.22 .07 -.19 .06 -.28 .08 -.22 .07 Direct -.17 .07 -.11 .05 -.11 .04 -.14 .06 -.11 .05
Mean total effect -.23 -.16 -.14 -.21 -.17
Note. MSC = Math self-concept (Years 5 -9). Estimates (standard errors in parentheses) for the direct paths from school-average achievement come from the integrated academic self-concept (ASC) model and the corresponding total effects. In the integrated ASC model, school-average achievement represented by one latent variable (based on school-average values for math grades, school track, and test scores). In additional models specific to tests of the BFLPE, separate analyses were done for each of these three measures of school-average math achievement: School average math grades (Model A1, based on Year 4, the last year of primary school); school track (Model A2: high, medium, low track determined prior to the start of secondary school); and school-average test scores (Model A3, based on test scores from Year 5, the first year of secondary school). Model B1 tests the effects of school-average German grades. Coefficients in bold are statistically significant at p < .05. MSC = math self-concept; Year 5 through Year 9 = first five years in secondary school.
Discussion
The present investigation is a large, longitudinal panel study covering the period from the end of primary school through the first 5 years of secondary school (the end of compulsory schooling in Germany). The study uniquely integrates three of the main theoretical models in ASC research (REM, I/E, BFLPE) and offers new developmental perspectives on each. It does so, in part, by capitalizing on a characteristic feature of the German school system, in which students attend nonselective primary schools up to Year 4, but subsequently attend highly achievement-tracked secondary schools. A critical feature of this study is the longitudinal design, covering the last year of primary school and the first 5 years of secondary school, which provides a unique developmental perspective on the consistency and robustness of effects over this critical early to middle adolescent period. In particular, there was strong support for a very demanding test of developmental equilibrium,