URBAN ENERGY ANALYSIS BASED ON 3D CITY MODEL
FOR NATIONAL SCALE APPLICATIONS
R. Nouvel
1, M. Zirak
1, H. Dastageeri
2, V. Coors
2and U. Eicker
1 1HFT Stuttgart – zafh.net, Germany
2HFT Stuttgart – geo-informatics, Germany
ABSTRACT
In this paper, we present a methodology based on 3D city modelling to manage a realistic energy analysis of the building stock, building per building, at a very large scale (national application for instance). This methodology is tested on the City of Ludwigsburg and its more than 14.000 buildings. The influences of the data availability and quality on the model accuracy are analysed, for both geometrical and semantical information data. This paper is concluded by exposing some technological trends and policy needs to improve the accuracy and potentials of this methodology.
INTRODUCTION
Accountable for around 80% of the oil, gas and coal world consumption, urban metropolises are the lead contributors of greenhouse gas production, a main driver of climate change, despite covering only 2% of the Earth’s surface. A rapid transition of urban areas towards energy efficiency and adaption to challenges created by climate change are greatly required. In this context, virtual 3D city models, storing geometrical and semantic data of whole cities, have shown huge potentials in the fields City planning, Environment and Energy, from flood risk simulations to solar potential analyses (Solar Atlas Berlin, 2010). In parallel, the number of cities represented in 3D city models is increasing exponentially, while the investment costs and time required to build these models are decreasing as new automatic data collection technologies such as LiDAR (LIght Detection And Ranging, remote sensing technology measuring distance by illuminating surfaces with a laser) are developed.
Some urban energy analysis based on virtual 3D city model have already been realised at local scale for some city districts like in Berlin (Carriòn et al. 2010, Kaden et al. 2013), Karlsruhe and Ludwigsburg (Nouvel et al. 2013). The data quality of these city models are very variable, depending on the available public database (provided generally by the municipality), and the information data collected on-site. Moreover, as they rely mostly on specific
(non-standardised) data structure defined locally, they are not applicable to other cities and regions.
In this paper, we introduce a methodology of urban heat demand analysis that enables the calculation at national scale of the building heating demands, based on 3D city model (available for all of Germany since 2013), and on two federal databases: theALKIS database (ALKIS, 2014) and European census data. This methodology is first detailed and tested on the whole city of Ludwigsburg (14.000 buildings). Then, the uncertainty of the model is investigated, analysing the influence on the simulated heating demand of building information data. The influence of the CityGML Level of Details, not the same in all cities and regions, is studied as well. In a last section, we describe some technological trends and policy needs which could contribute to the improvement of the accuracy and level of realism of this national-wide energy model.
METHODOLOGY
The urban energy analysis described and tested in this paper is based on an integrated process using a virtual 3D city model. This integrated process is implemented on the urban simulation platform SimStadt, whose development is ongoing in the Project of the same name (SimStadt, 2014).
3D city model
The OGC Standard CityGML (Groeger et al., 2012) has been selected for the modelling of 3D building data. CityGML is an open, multifunctional model that provides a basis for 3D geospatial visualization, analysing, simulation and exploration tools. In recent years, these virtual 3D city models, storing geometric and semantic data of entire cities have shown huge potentials in the fields of city planning, environment and energy, and are increasingly used for these applications.
A considerable advantage of CityGML in comparison to other 3D city model formats is its spatio-semantic model, which specifies object modelling in different levels of detail. Due to this, it is an excellent database for heating demand analysis of existing building stocks, since the level of building parameter
availability can be reflected in the Levels of Detail of CityGML (see Figure 1).
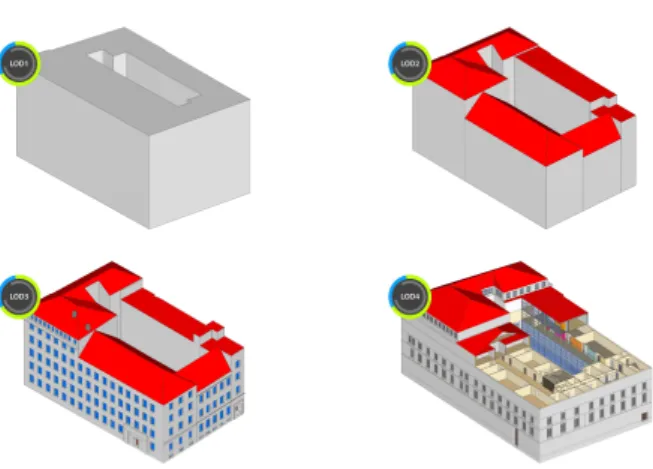
Figure 1 – The four Levels of Detail of CityGML applied to the Building 2 of the Hochschule für Technik Stuttgart.
The most simple geometric representation of a building for a heating demand evaluation consists of a simple rectangular block. This block model consists of the “Level of Detail 1” (LoD1) of CityGML. The Level of Detail 2 (LoD2) adds the roof form to the building level, Level of Detail 3 (LoD3) adds in the positioning of the façade windows, and Level of Detail 4 (LoD4) incorporates the modelling of the indoor space.
3D city model can be generated, either by aerial stereo photography, digital cadastre combined with building information (height, roof type), or airborne laser scanning. In particular, the latter technique allows for an automatic generation of a CityGML model of whole cities in a short time. Since 2013, the complete building stock of Germany has been modelled with CityGML – LoD1. Some regions like Saxony have already completed their 3D city model with LoD2 (Baltrusch et al. 2011).
Given the diverse qualities of the 3D city models, the healing module “CityDoctor” has been developed and integrated into the process. It allows for the control and enhancement of the geometrical quality of the 3D model by closing faulty polygons and volumes or detecting the shared walls of neighboor buildings (Coors et al., 2011).
Building information sources
To conduct an urban energy analysis at very large scale, the two following building information sources, available for the entire German building stock (there may be equivalent data sets in other countries) are used:
• The Authoritative Real Estate Cadastre Information System (ALKIS®)
• The population census data
The ALKIS database is stored and managed by the Working Committee of the Surveying Authorities of the States of the Federal Republic of Germany (AdV). It contains the standardised Building Function codes related to the Building IDs of the 3D city model.
The population census occurs generally every 5 to 10 years, allowing for the collection of socio-demographic information data at the national scale, by sending a survey in every household in the country. In 2011, it was even conducted at the European scale. General building information, such as year of construction, living/used area and number of inhabitants, are included in the survey. The answer rate is generally very high for residential buildings (over 95% in the city of Ludwigsburg).
Although these two data sets are sufficient to simulate the heating demand of all buildings, additional databases may be provided at a more local scale by cities in order to refine the city model and improve the accuracy of the simulation results.
Data pre-processing and generation of the building simulation parameters
The relevant building information data previously described are incorporated in the 3D city model. An automatic data pre-processing module integrated in the urban platform SimStadt allows for the calculation of the required input data of the heating demand simulation, based on the available data and Level of Detail.
The boundary usage conditions (e.g. occupancy time, air change requirement, set-point temperatures) are determined by relating the ALKIS Building Function codes to the standard types of building usages detailed in building energy norms (DIN 18599-10). The physical building properties (e.g. U-values of the building elements, infiltration rate) are assessed by means of benchmarking values from building typology libraries. The building typologies correspond to a classification of the whole building stock according to their building type (for instance single-family house, multi-family house, high tower or offices) and building age class. A building typology may be assigned to each building of the 3D city model, by combining its year of construction from the census data, its building function from ALKIS and some geometrical parameters extracted from the 3D building model (building height, ratio of exterior walls to adjacent walls).
Such building typology libraries are essential to address districts with several thousands of buildings. These libraries can exist at a national level (e.g. in Germany: IWU, 2003 or in the different European countries: Project Tabula, 2012), for certain regions (e.g. the states of Bavaria and Schleswig Holstein in Germany), or for specific city quarters with
exemplary energy audits (e.g. Karlsruhe Rintheim). Generally, the more locally and accurately these building libraries are defined, the higher the accuracy of the on-site construction characteristics is.
Depending on the availability of additional building data sets, the values assessed first through benchmarking or standard values can be updated, particularly in regard to refurbishment measures, in order to refine the urban thermal model and improve the accuracy of the result.
Thus, this data pre-processing supplies formatted inputs to the heating demand calculation module.
Heat demand calculation
Regarding heating demand calculation, customary building performance simulation software tools are mostly not appropriate for a city-scale calculation. Namely, they require overly complex input thermal data, are not designed to use geometry input from city models, and have a programming and computation time that is much too long.
On the other hand, a purely statistical model, consisting of the multiplication of specific consumption ratios by the living area (Mastrucci et al., 2014), does not benefit from the potential of 3D city modelling.
One solution that offers a happy medium is the quasi-static monthly energy balance (standardised in Germany with the DIN 18599 and in Europe with the ISO 13790). This simple but reliable algorithm has been selected in this integrated process. Its limited input requirements are compatible with a 3D city model, while its robust and reasonably accurate algorithm is used worldwide by energy standard organisations (EnEV 2012 and PassivHaus in Germany, TEK 10 in Norway etc.). Moreover, the computing time of this heating demand calculation is well suited to generate and compare long-term urban energy scenarios for districts with thousands of buildings.
From the standard DIN 18599, we have made some simplifications and adaptations. For example, every building is modelled with a single thermal zone, since their internal structure is not detailed for CityGML model LoD1 to LoD3. In the special case of multi-usage building, set-point temperatures, internal gains and air change rates have been averaged according to the respective used area. Moreover, internal gains or air change rates are fixed ratio relative to living area, depending only on the building usage and building age.
Finally, a correction factor based on empirical studies (Born et al, 2002) is integrated into the standard algorithm aiming to estimate the impact of occupant behaviour. Concretely, it directly modifies the heating set-point temperature, depending on the heat losses
coefficient (and then the thermal state) of the building.
The meteorological data used for the simulation are standardised regional monthly mean irradiances per façade orientation, as well as the monthly outside dry bulb temperature (DIN V 4108-6, annex A). The calculation algorithms are implemented in the software Insel 8, coupled with the urban platform SimStadt.
TEST ON THE CITY OF LUDWIGSBURG
Overview
Ludwigsburg is a city of the South-West of Germany with nearly 90.000 inhabitants. These inhabitants live and work in more than 14.000 buildings, representing a total heated area of 5.7 million m². Ludwigsburg is administrated in 12 districts, built at different expansion periods of the city: the oldest district “Mitte” has a majority of buildings built before the 20th century, whereas the district “Plugfelden”, for instance, was built mainly after 1990.
During the project Klima-SEK, a 3D city model CityGML LoD2 representing the whole city of Ludwigsburg has been built, using the laser scanning and model reconstruction technologies (Klima-SEK, 2014). The census data from the European census survey 2011 and the building functions are the only building information data sources available for the whole city (as well as for all of Germany), they have been incorporated into the CityGML 3D city model.
Simulation results
Based on this 3D city model, the heating demand of each heated building of Ludwigsburg was simulated. In the Figure 2, the results are presented on the 3D city model in kilowatt-hours per square meter (normalized by the reference heated area according to DIN 4108-2) per year. Because of data privacy reasons, the heating demand of buildings composed only of one household (single-family houses and row houses) have been grouped and averaged with their neighbor buildings.
Figure 2: Calculated specific heating demand of the city of Ludwigsburg
The simulated specific heating demand of the buildings of Ludwigsburg reach 167 kWh/m².yr, varing between 142 and 185 kWh/m².yr for the 12 different districts. The histogram of the specific heating demand for the total heated area of Ludwigsburg shows a normal distribution centered on 160 kWh/m².yr, in addition to a large representation in the 50 – 75 kWh/m².yr category. This latter corresponds to new construction, built after the implementation of the building energy conservation laws (EnEV in Germany), as well as the recent building refurbishments.
Figure 3: Histogram of specific heating demand in Ludwigsburg
Discussion and limits of the model
No energy consumption data were available at city scale (the different energy suppliers of Ludwigsburg keep them confidential for competition reasons). Thus, although the average heating demand calculated based on the 3D city model is consistent with the German average value of 160 kWh/m².yr (Bine 2002), the verification and calibration of the urban energy model were unfortunately not possible. Furthermore, the definition of the census data field “year of construction” lacks clarity in case of refurbished buildings. Owners of fully refurbished buildings sometimes provide the year of refurbishment and other times the year of original construction. As no other refurbishment information data are considered in this urban energy model, building refurbished state were fsometimes taken into account in the city modellingand other times not. In general, by considering only the census and ALKIS datasets as building information data, the uncertainty of the simulated heating demand may be significant. To assess these uncertainties and verify the simulation results of this urban energy methodology, a energy analysis focussed on the
district Grünbühl of Ludwigsburg is realised in the further section.
INFLUENCE OF THE BUILDING
SEMANTIC DATA
Beside the geometrical Level of Details, the semantic building information has a significant impact on the accuracy of the model. In the urban energy methodology previously presented for very large scale applications, only necessary building data available at national scale were included in the city model. At more local scale, additional building information may be collected to refine the city model, leading to an improvement of result accuracy.
Comparison of “census data model” and “detailed data model” on Ludwigsburg-Grünbühl
Grünbühl is a small residential district in southeastern Ludwigsburg, with a ground area of 15 ha. Most of its 150 buildings were built in the decade after World War II, others later in the 80’s. During the project EnEffStadt Ludwigsburg, detailed relevant building energy data have been collected on-site (e.g. window proportion per façade, thickness of outside insulation for refurbished buildings, basement and attic configurations etc.). The 3D city model has been refined with these detailed information and simulated. Furthermore, the only energy supplier of the district accepted to provide us with the gas consumption data of each building block for the last 5 years, which allowed us for the comparison of the simulation results with the real consumptions.
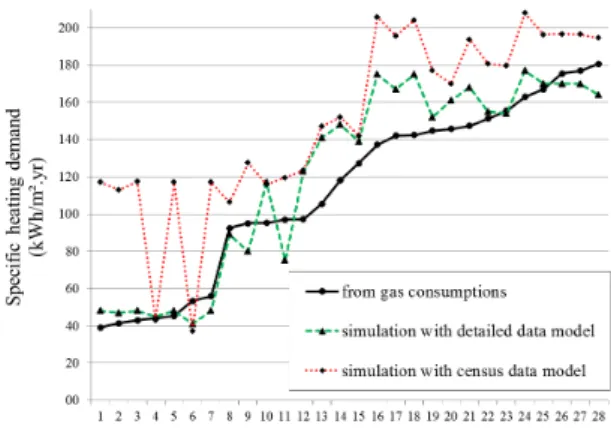
The actual heating demand calculated from the gas consumptions, the simulated heating demand based on these detailed building data and the other simulated heating demand based only on census data have been compared together for different building blocks of the district Grünbühl. The results are represented on the Figure 4.
Figure 4: Comparison between the actual heating demand, and the two simulations based on detailed
The simulated data based on the census data overestimates consequently the actual heating demand (total deviation: +31%), while the simulated heating demand based on the detailed data model follow closely the actual heating demand, with a total deviation of 2%. In particular, the latest refurbished buildings (Building blocks 1 to 7) with the lowest specific heating demand are much more realistically modelled with all the information of the detailed data model than with the census data model.
Then, having detailed enough building information is essential to model realistically building heating demands at urban scale. The next section investigates the impact of some main energy-related building information over the calculated heating demand.
Influence of the different building information data
For the district of Grünbühl and its 150 buildings, the on-site information collection occupied 3 employees during 2 days. At larger scale (e.g. for whole Ludwigsburg), such an operation would be extremely personnel-, cost- and time-consuming. Then, it is essential to know which building information data are the most relevant (and irrelevant) to collect. In other words: which information data have the strongest (and lowest) influence on the calculated heating demands, and in which specific configurations (urban form, building ages etc.).
In this section, several sensitivity analyses for different main building parameters have been performed, applied to the distric Ludiwgsburg-Grünbühl.
• Refurbishment data
Figure 5 shows the overestimation of the heating demand simulation when the refurbishment data are not available (case of the “census data model” compared to the “detailed data model”).
Figure 5: Impact of missing refurbishment data Missing refurbishment data information leads to huge errors in the estimation of the heating demand, from
+70% for the first energy efficient refurbishment in the 80’s to +180% for the latest energy efficient refurbishment (and even much higher for refurbishments following the highest actual standards).
Then, having information data about the latest refurbishment state of the buildings, at less the year of refurbishment, is essential for an urban energy analysis.
• Influence of window to wall ratio
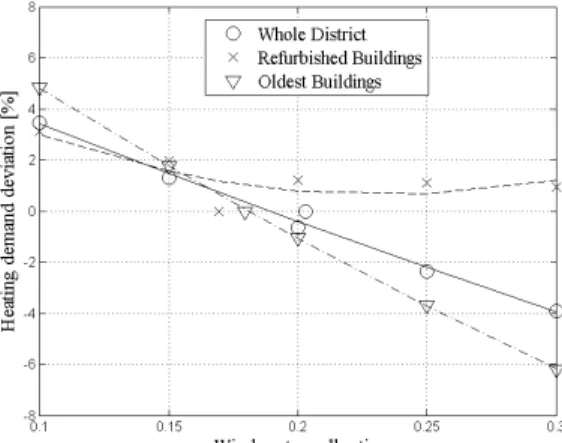
Uncertainties about window to wall ratios may lead to errors in solar gain as well as heat transmission loss calculations, and therefore, affect the heating demand. Figure 6 represents the heating demand deviation relative to the window to wall ratio error for the Grünbühl district. The considered interval of window to wall ratio corresponds to the typical range for residential buildings: 10% - 30%. For the refurbished buildings, the oldest buildings and the whole district, the heating demand deviations were calculated relative to the mean value of real window to wall ratios: respectively 17%, 18% and 20.3%.
Figure 6: sensitivity study of the window to wall ratio
In the case of Grünbühl, the uncertainty on the window to façade ratio led to a deviation smaller than +/-5% on the total heating demand and may be considered as non-key parameter for the simulation of the heating demand.
Nevertheless, this result cannot be generalized to other case studies, since it is specific to the climate (radiations and outdoor temperature), the main building orientation, and the difference between the wall and the window U-values. For instance, most old buildings of Grünbühl have new windows whose U-values are not so far from those of the walls (respectively 1.6 and 1.4 W/m².K).
INFLUENCE OF THE GEOMETRICAL
LEVEL OF DETAILS
Contrary to the City of Ludwigsburg, many cities cannot afford a 3D city model Level of Detail 2 (LoD2) with detailed roof structures. A 3D city model LoD1, which is generated by combining the footprints and the average heights of the building, may be used instead for an energy analysis. Thus, the entire building stock of Germany has been modelled in LoD1 since 2013.
In this section, the influence of this geometrical approximation of the 3D city model on the heating demand calculation results is quantified, by comparing the results of the heat demand calculation based on the LoD1 and on the LoD2 city models of Ludwigsburg
The Figure 7 presents these deviations for the 12 districts of Ludwigsburg. As a general trend, the total heating demand of all districts is slightly overestimated with the LoD1 city model, in a range between 0 and 5%, with an average value of 3% for the whole City of Ludwigsburg.
Figure7. Total heated area and heating demand deviation in different districts of Ludwigsburg. This deviation is considerably correlated with the overestimation of the LoD1 reference heated area, which is calculated in function of the heated volume and of the estimated number of storeys, according to the DIN4108. The reason of this overestimation comes from the data pre-processing, which extracts the geometric data from the 3D city model and transform them in usable data for the heating demand simulation. Having the roof shape in the LoD2, it is easy to estimate if a building contains a inhabited attic storey or not, based on the distance between the ridge and the eaves height. If this distance is judged to small (less than 2 meters), the roof volume is cut off from the heated volume, and the reference building height used for the estimation of the storey
number corresponds to the eaves height. In a LoD1 city model, all the roof are flat, making impossible to differentiate the heated volume from the whole building volume.
This deviation between LoD1 and LoD2 is now analysed at the building level, focussed on the district Grünbühl. Since the difference between LoD1 and LoD2 lays on the roof shape modelling, it is interesting to investigate the impact of the building height on the relative deviation of heated area and heating demand.
Figure8. Total heated area and heating demand deviation depending on the storey number in
Grünbühl.
The Figure 8 details these deviation depending on the number of storeys of the buildings of Grünbühl. The greatest deviations corresponds to the buildings with only 3 storeys (8-10% in average), where the ratio roof volume to building volume is the highest. The deviation decreases then with the increasing number of storey down to 0-2%, except for the 11 storeys category. The latter corresponds to a high tower with a complex geometry, which should be considered as an exception.
We observe also that the correlation between the heated area and the heating demand is not exact. Indeed, additionally to the difference of calculated heated area, the various roof shape in LoD1 and LoD2 leads also to different envelope area and roof orientations, causing different transmission heat looses and solar gains, two important terms of the building energy balance..
SOME TECHNOLOGICAL TRENDS AND
POLICY NEEDS
The uncertainties of this city model based on census and ALKIS data sets have been proved sizeable in the last sections. To improve the data quality, and therefore their realism and accuracy of the proposed methodology for very large scale applications, different solutions from the technological and policy fields exist.
Improvement of data collection with image mining technologies
During the last decade, the utilization of image processing technologies for urban data mining and 3D city model reconstruction have boomed, be it on street-view or aerial pictures, with visual or infra-red pictures.
Thanks to a collection of advanced image processing algorithms (image segmentation, classification methods, Markov Chain Monte Carlo, descriptive and predictive spatial models etc.), window to wall ratio (Musialski, 2010), stories recognition, solar panel surface area, wall absorption coefficient or the refurbishment state of the building (based on infrared camera) may be automatically determined and linked up to the correct buildings and walls by means of geo-referencing.
Furthermore, drones have become a very efficient and low-cost solution, to obtain high resolution aerial pictures and orthogonal views of façade of a whole city in a very short time.
Cloud service for crowd sourcing
To tackle energy transition at urban scale, city municipalities, energy suppliers, housing companies and private owners must be mobilized and bonded around a common long-term urban energy strategy. It is then essential to find a place where they can communicate and exchange together, a place where top-down policies meet bottom-up enterprises. This place may be the web, using the support of a cloud GIS (Ramesh et al. 2013). GIS allows for merging large amounts of data and cartography into a single map which serves as exchange support and decision making tool. Its “cloud” feature (online) allows for making it accessible to every urban actor for crowd sourcing, while managing the different “access perimeters” depending on the user type.
Through web-based services, building owners and tenants may for instance feed the city model with energy-related information concerning their building, and receive as feed-back a customised calculation of the energy saving potential due to some refurbishment measures and the relative investment costs. Construction and refurbishment companies may identify the highest refurbishment requirements in the city and propose a cost estimation to the owners. Energy supplier companies may feed the model with their energy billing data, and investigate the profitability of a new District Heating System, given as the actual heat intensity of an urban area. Then, every urban actor will receive incentive to provide the cloud GIS with detailed energy-related data, participating in the data quality improvement of the city model and then to its higher accuracy and realism.
Introduction of energy-related data in the population census survey
Some of the socio-demographic information data collected during the national/European population census are essential for an urban energy analysis (year of construction, building function, number of inhabitants), but often not enough to get an accurate energy characterization of the city building stock. The inclusion in the census survey of energy-related information data, like type of HVAC systems, last year of refurbishment, building insulation etc., would be very effective in order to realistically take into account the energy state of the national building stock.
Data privacy versus energy refurbishment urgency
Energy billing data at disaggregated level (for instance per building) are precious information, allowing for calibration through reconciliation of a model’s predicted energy consumption with actual consumption. Indeed, since standard calculation methods, as the DIN 18599 in Germany or ISO 13790 in Europa, determine the intrinsic heat demand of one building with standardised occupants, without encompassing the household type or the occupants’ behaviour, they may deviate considerably from the actual consumption.
Unfortunately, the access to these consumption data tends to be restricted in some countries for privacy or marketing reasons. This is particularly paradoxal in Germany, as the federal government is fully involved in a energy-efficiency upgrade of the national building stocks, which requires to know which buildings must be refurbished, in which priority order, and what are the expected energy savings. The trade-off between the privacy of consumption data and more accurate energy analysis deserves to be re-evaluated. When comparing one’s own consumption with that of neighbors is possible, a greater awareness of consumption level is facilitated, potentially leading to more energy-efficient behaviours and then energy conservation. If individual consumption data are communicated to a municipality, the basis for refurbishment options can be better understood, and the planning of low-carbon urban policies can be more accurately developed. If energy supplyers know the energy demand of all the buildings of a district, they might have the opportunity to plan profitable district heating systems based on renewable energies.
CONCLUSION
In this paper, we introduce a methodology of urban heat demand analysis which relies only on national-available 3D city model and building/occupants databases (ALKIS database and European census
data). Having been tested first on the whole city of Ludwigsburg, the next stage would be the calculation of the heating demand of each building of Germany, residential or otherwise. This methodology could even be extended to other regions/countries, on the condition that they have at their disposal a 3D city data model and a cadastral database with standardised building functions.
The uncertainties of this model have been proved sizeable but some great opportunities of data quality improvement exist. They may come from technological fields (image processing, web platforms) or policy decisions (enhancement of the European census data with energy-related information, publication of the energy consumption data).
In any case, 3D city models have the potential to lead the energy transition national-wide. Beside the thermal diagnosis of the existing building stock, they enable the development and planning a more comprehensive urban energy strategy, with the localization of energy saving potentials and the definition of refurbishment priorities, so as to fulfill, in combination with sustainable energy supply concepts, the CO2 saving objective of the German department of energy and environment: carbon neutral District in 2050.
ACKNOWLEDGEMENT
Thanks to the German Ministery of Economy and Technology for funding the project KLIMA-SEK II, and to the City of Ludwigsburg for providing us valuable information and for our long-term truthful collaboration..
REFERENCES
ALKIS, Amtliches Liegenschaftskatasterinfor-mationssystem. Website of Arbeitsgemeinschaft der Vermessungsverwaltungen der Länder der Bundesrepublik Deutschland(June 2014):
http://www.adv-online.de/AdV-Produkte/Liegenschaftskataster/ALKIS/
Balstrusch, s. 2011. Landesweite automatische und halbautomatische Erzeugung von 3D-Gebäudemodellen. Workshop 3D-Stadtmodelle, Bonn.
Bine Informationsdienst – Fachinformationszentrum Karlsuhe 2002.
Born R., Diefenbach N., 2002. Energieeinsparung durch Verbesserung des Wärmeschutzes und Modernisierung der Heizungsanlage für 31 Musterhäuser der Gebäudetypologie. Institut Wohnen und Umwelt (IWU).
Carrión, D., Lorenz, A., Kolbe, T. H., 2010. Estimation of the energetic rehabilitation state of
buildings for the city of Berlin using a 3D City Model represented in CityGML. Proceedings of the 5th International Conference on 3D Geo-Information 2010 in Berlin. The International Archives of the Photogrammetry, Remote Sensing and Spatial Information Sciences, XXXVIII-4/W15, S. 31-36.
Coors, V., Krämer, M., 2011. Integrating Quality Management into a 3D Geospatial Server. 28th Urban Data Management Symposium UDMS Groeger, G., Kolbe, T.H., Nagel, C., Häfele, K.H
2012. OGC City Geography Markup Language (CityGML) En-coding Standard. OGC Doc. No. OGC 12-019.Musialski P. 2010. Processing of Façade Imagery. Technische Universität Wien, PhD-Thesis under the supervision of Purgathofer W. and Wonka P.
Kaden R., Kolbe T.H., 2013. City-wide total energy demand estimation of building using semantic 3D city models and statistical data. SPRS Ann. Photogramm. Remote Sens. Spatial Inf. Sci., II-2/W1, 163-171, 2013.
Klima-SEK projekt. 2011. Information on website of the Hochschule für Technik Stuttgart:
https://www.hft-stuttgart.de/Forschung/Kompetenzen/zgg/Projekt e/Projekt71.html/de
Mastrucci A., Baume O., Stazi F., Leopold U. 2014. Estimating energy savings for the residential building stock of an entire city: A GIS-based statistical downscaling approach applied to Rotterdam. Energy and Buildings, vol 75, p. 358-367.
Nouvel R.; Schulte, C.; Eicker, U., Pietruschka, D.; Coors, V. 2013. CityGML-based 3D City Model for energy diagnostics and urban energy policy support. Proceedings IBPSA World 2013. Ramesh S., Lam K. P. 2013. Urban Energy
Information Modelling: An interactive platform to communicate simulation-based high fidelity building energy analysis using Geographical Information Systems (GIS). School of Architecture Carnegie Mellon University, Pittsburgh, Pennsylvania, USA. Proceedings of Building Simulation 2013.
SimStadt Project, Wärmebedarfssimulation von Stadtquartieren. 2012 – 2015. Website:
www.simstadt.eu (June 2014)
Solar Atlas Berlin Project. From 2010. Website
http://www.businesslocationcenter.de/solaratlas