Soil ecosystem profiling in the
Netherlands with ten references for
biological soil quality
Report 607604009/2008
RIVM Report 607604009/2008
Soil ecosystem profiling in the Netherlands with ten
references for biological soil quality
Rutgers, M. (editor), RIVM Mulder, C. (editor), RIVM Schouten, A.J. (editor), RIVM Bloem, J., Alterra, Wageningen UR Bogte, J.J., RIVM
Breure, A.M., RIVM
Brussaard, L., Department of Soil Quality, Wageningen University De Goede, R.G.M., Department of Soil Quality, Wageningen University Faber, J.H., Alterra, Wageningen UR
Jagers op Akkerhuis, G.A.J.M., Alterra, Wageningen UR
Keidel, H., Laboratory for soil and crop analysis (Blgg), Oosterbeek Korthals, G.W., Applied Plant Research (PPO), Wageningen UR Smeding, F.W., Louis Bolk Institute, Driebergen
Ter Berg, C., Louis Bolk Institute, Driebergen Van Eekeren, N., Louis Bolk Institute, Driebergen
Contact: Rutgers, M. LER/MEV/RIVM [email protected]
This study has been commissioned by the Netherlands Ministry of Housing, Spatial Planning and the Environment, Directorate of Soil, Water and Rural Areas (BWL), within the framework of RIVM project M/607604, Soil ecosystems: monitoring, data management and integration.
© RIVM 2008
Parts of this publication may be reproduced on the condition that the source is acknowledged as follows: 'National Institute for Public Health and the Environment (RIVM), the title of the publication and the year of publication'.
Abstract
Soil ecosystem profiling in the Netherlands with ten references for biological soil quality
The RIVM (Dutch abbreviation for National Institute for Public Health and the Environment) and other institutes have described ten soil ecosystem profiles, or ‘biological soil quality references’, based on soil quality as inferred from existing empirical evidence . This is a pilot study, since no specific protocol has been established yet. The aim is to use these new references as benchmarks in the implementation of a more sustainable use of soils.
References were derived from a combination of data on land use (e.g. dairy farms, arable fields and heathlands) and soil type (sand, peat, clay and Loess). Soils types covering about three-quarters of the surface of the Netherlands are studied in this report.
Several participants, with expertise ranging from soil ecology and microbiology to rural management, selected sites where they believed data to be representative of good soil quality. To do this, they used soil monitoring data from the Netherlands Soil Monitoring Network (in Dutch: LMB). The ten references were derived from empirical data. This report provides also the averages and frequency distributions of soil biological, chemical and physical soil characteristics. The occurence of soil organisms has also been described, as well as their biodiversity.
Key words:
Netherlands Soil Monitoring Network, Biological indicator for soil quality, ecosystem services, references, soil quality, soil biota
Rapport in het kort
Typeringen van bodemecosystemen in Nederland met tien referenties voor biologische bodemkwaliteit
Het RIVM heeft samen met diverse kennisinstituten tien veel voorkomende bodems gekarakteriseerd waar de bodemkwaliteit op orde is, zogeheten referenties voor biologische bodemkwaliteit (RBB). Hier bestonden nog geen criteria voor. Deze referenties kunnen als streefbeeld gebruikt worden om bodemgebruik duurzamer te maken.
De referenties zijn bepaald voor tien combinaties van bodemgebruik (onder andere melkveehouderij, akkerbouw en heide) en bodemtype (zand, veen, klei en löss). Dit is representatief voor driekwart van het bodemoppervlak van Nederland.
Diverse onderzoekers, onder andere op het gebied van bodemecologie, microbiologie en agrarisch bodembeheer, hebben locaties geselecteerd die volgens hun maatstaven een relatief goede
bodemkwaliteit hebben. Hiervoor maakten zij gebruik van de gegevens van het Landelijk Meetnet Bodemkwaliteit (LMB) over de toestand van de bodem. Op basis van deze informatie zijn de tien referenties bepaald. Het rapport bevat ook gemiddelde waarden van de biologische, chemische en fysische eigenschappen van de bodem, evenals een maat voor de spreiding van de gegevens. De mate waarin bodemorganismen voorkomen en hun diversiteit zijn ook beschreven.
Trefwoorden:
Referenties voor Biologische Bodemkwaliteit (RBB), Landelijk Meetnet Bodemkwaliteit (LMB), duurzaam bodemgebruik, bodemecosysteem, bodemorganismen, ecosysteemdiensten, ecologische processen
Preface
This report provides data obtained from ten years of monitoring of the Biological Indicator for Soil Quality (BISQ) in the Netherlands Soil Monitoring Network (LMB). The database of biological, chemical and physical soil characteristics from 325 sampled locations is considered the most extensive of its kind, and represents three-quarters of the surface of the Netherlands. Based on this, several participants have therefore for the first time selected locations at which they assume the soil quality to be relatively good. Ten different but widespread combinations (‘categories’) of land use and soil type were selected. This was an exciting process, because the concept ‘soil quality’ has different meanings in different disciplines, which sometimes resulted in firm discussion. Furthermore, this was as yet unexplored territory. The selections were combined to form ‘biological soil quality references’.
This report is translated from a Dutch version (Rutgers et al. 2007). The set of ten references published in this report is a first cautious step on the path to the production of a standard for sustainable land use. It is expected that more data on the biological, chemical and physical status of the soil from more locations in the Netherlands, as well as increased expertise in the field of soil quality, will make it possible to improve and expand the number of references in the future.
The extensive soil database was produced with the assistance of many people, all of whom made essential contributions to the planning and implementation of the sampling campaigns, analysis of the soil samples and interpretation of the results. We would like to thank the following people for their contributions:
Rob Baerselman Popko Bolhuis Bert van Dijk Wim Dimmers Arthur de Groot Henri den Hollander Frido van der Horst Ruud Jeths Niels Masselink Tamas Salanki Kristel Siepman Erik Steenbergen Meint Veninga An Vos
Harm van Wijnen Marja Wouterse
Various photographs were provided by W. Dimmers, R. van Kats, A. de Groot, M. Zaanen and the authors.
Activities within RIVM were commissioned by the Netherlands Ministry of Housing, Spatial Planning and the Environment (VROM) and took place within project M/607604, entitled ‘Soil ecosystems – monitoring, data management and integration’. Activities carried out by Alterra and WU-Soil Quality took place within the Directorate for Science and Knowledge Transfer themes/programmes
BO-01-002-Soil (Vital Rural Area) and Agro-biodiversity, nr. 432, commissioned by the Ministry of Agriculture, Nature and Food Quality (LNV).
Contents
SUMMARY ...9
STRUCTURE OF THE REPORT ...13
1 INTRODUCTION TO THE LIVING SOIL ...15
1.1 THE MANY FACES OF THE LIVING SOIL...15
1.2 SOIL, SOIL PROCESSES AND SOIL ORGANISMS...16
1.3 THE SOIL FOOD WEB...16
1.4 ORGANISMS BY GROUP...16 1.4.1 Bacteria...16 1.4.2 Fungi...18 1.4.3 Protozoa...18 1.4.4 Eelworms (nematodes)...19 1.4.5 Potworms (enchytraeids) ...19 1.4.6 Earthworms...20
1.4.7 Mites and springtails ...21
1.5 SOIL PROCESSES...21
1.5.1 Carbon and energy flows ...22
1.5.2 Nitrogen cycle ...22
1.5.3 Water...22
1.5.4 Structure formation...23
2 THE STATE OF SOIL IN THE NETHERLANDS...25
2.1 THE NETHERLANDS SOIL MONITORING NETWORK...25
2.2 RESULTS OF TEN YEARS OF MONITORING...28
3 TOWARDS MORE SUSTAINABLE LAND USE ...31
3.1 SUSTAINABLE SOIL...31
3.2 SOIL’S CONTRIBUTION TO SOCIETY...31
3.3 SOIL, LAND USE AND SPATIAL PLANNING...33
3.4 PERFORMANCE OF ECOSYSTEM SERVICES...33
3.5 ROUTE FOR ACTION FOR LAND USERS...34
3.6 SUSTAINABLE REFERENCES AND SOIL ECOSYSTEM PROFILING...35
4 REFERENCES AND SOIL ECOSYSTEM PROFILING...37
4.1 INTRODUCTION...37
4.2 METHOD AND REFERENCE SELECTION...38
4.3 BIOLOGICAL SOIL QUALITY REFERENCES...40
4.4 ARABLE LAND ON CLAY...51
4.4.1 Introduction to arable land on clay ...51
4.4.2 The clay below the arable farms ...52
4.4.3 Selection of the arable land on clay reference...52
4.4.4 Soil ecosystem service performance in the Hoeksche Waard ...53
4.5.1 Introduction to cattle and dairy farms on clay...54
4.5.2 The clay below the dairy farms ...55
4.5.3 Selection of the cattle and dairy farms on clay reference ...55
4.6 CATTLE OR DAIRY FARMS ON LOESS (LIMBURG CLAY) ...56
4.6.1 Introduction to loess ...56
4.6.2 The loess below cattle farms ...57
4.6.3 Selection of the cattle farms on loess reference ...57
4.7 CATTLE OR DAIRY FARMS ON PEAT...58
4.7.1 Introduction to cattle farms on peat...58
4.7.2 The peat soil below cattle farms ...59
4.7.3 Selection of the cattle farms on peat reference ...59
4.7.4 Measures for sustainable cattle and dairy farms on peat ...59
4.8 ARABLE LAND ON SAND...60
4.8.1 Introduction to arable land on sand ...60
4.8.2 The sandy soil below the farms ...61
4.8.3 Selection of the arable farms on sand reference ...61
4.8.4 Measures for sustainable arable farming on sand...61
4.9 CATTLE OR DAIRY FARMS ON SAND...62
4.9.1 Introduction to dairy farms on sand ...62
4.9.2 Sandy soil below cattle farms...63
4.9.3 Selection of the cattle and dairy farms on sand reference ...63
4.9.4 Measures for cattle and dairy farms on sand...64
4.10 SEMI-NATURAL GRASSLAND ON SAND...67
4.10.1 Introduction to semi-natural grassland on sand ...67
4.10.2 Management of semi-natural grassland on sand ...68
4.10.3 Selection of the semi-natural grassland on sand reference ...68
4.10.4 Semi-natural grassland vegetation ...69
4.10.5 Semi-natural grassland management...69
4.11 HEATHLAND ON SAND...70
4.11.1 Introduction to heathland ...70
4.11.2 The soil below heathland ...70
4.11.3 Sampled locations and selection of a sustainable heathland ...71
4.11.4 Heathland management measures ...71
4.12 MIXED WOODLAND ON SAND...72
4.12.1 Introduction to mixed woodland ...72
4.12.2 The woodland soil ...73
4.12.3 Sampled locations and selection of a sustainable woodland soil ...74
4.13 MUNICIPAL PARKS...75
4.13.1 Introduction to municipal parks...75
4.13.2 The soil below the parks ...76
4.13.3 Municipal park reference selection...76
LITERATURE ...77
APPENDIX 1. DEFINITIONS...81
Summary
Soil is used intensively for different purposes, for agriculture, housing, work, transport, nature
and recreation, which makes demands on the soil quality. The soil provides public services, ‘ecosystem services’, which are often essential to the land use. Soil is not always used in a sustainable way, which can result in a current depletion of ecosystem services, which can hold sometime and even occur elsewhere. A change in soil policy has been announced in the major policy proposals of the Ministry of Housing, Spatial Planning and the Environment (VROM), for example in the Fourth National Environmental Policy Plan, the Future Environment Agenda and the revised Dutch Soil Policy Letter (VROM 2003), and this is: land use must be sustainable!
Standards and monitoring systems are required in order to assess soil quality and the sustainability of land use (TCB 2003). These standards and the related monitoring systems are currently under development (Rutgers et al. 2005). The biological soil quality reference is a part of these standards. The reference describes a soil which, according to current knowledge, is considered to be of good quality, as derived from biological, chemical and physical parameters.
RIVM and other institutes have derived ten references for good biological soil quality. The references are specific to ten combinations of land use (e.g. dairy farms, arable fields and heathlands) and soil type (sand, peat, clay and loess). The abiotic and biological soil monitoring data have been obtained from the Netherlands Soil Monitoring Network (LMB). Participants from various backgrounds selected locations which they consider to be of relatively good quality, seen the monitoring data. These selections were then combined to form references. Averages and frequency distributions (percentiles) of the biological, chemical and physical data from ten years of biological soil monitoring are also provided. The references and averages form a soil ecosystem profile and are intended to be used as part of an instrument for sustainable land use in the Netherlands.
In selecting the references, the participants made use of specific expertise in soil quality management (crop rotation, soil cultivation methods, fertilizer application and pesticide application) and soil ecology (stability, biodiversity, functional diversity, ecological processes and soil organisms). Ten years of biological soil monitoring within the LMB has provided data from a total of 285 locations, spread across ten categories of land use and soil type. The locations are representative of a farm (roughly 10 to 40 hectares), a park (1 to 5 hectares) or a nature reserve with uniform vegetation (2 to 10 hectares). The following categories were sampled and analysed within the framework of the monitoring programme:
• 87x cattle or dairy farms on sand,
• 50x cattle or dairy farms on clay,
• 34x arable fields on sand,
• 30x arable fields on clay,
• 20x mixed woodland on sand,
• 19x cattle or dairy farms on peat,
• 11x cattle or dairy farms on loess (Limburg clay),
• 10x heathlands on sand,
• 10x semi-natural grassland on sand,
Molehills are a sign of life in the soil
Participants determined a reference for each category. A description and the averages and range of the biological, chemical and physical data from all locations for each category are also given in this report. Taken in combination, this information forms a profile of the most commonly occurring soil
ecosystems in the Netherlands.
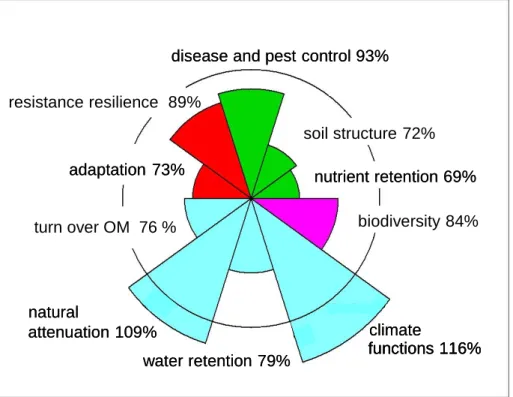
Amoeba charts are useful for summarising the performance of the soil. It is possible to show each separate biological, chemical and physical parameter in an amoeba chart, and yet retain an overview. It is also possible to summarise the outputs of separate ecosystem services in an amoeba chart by combining the values for subsets of biological, chemical and physical parameters (Breure et al. 2004, Schouten et al. 2004, Rutgers et al. 2005).
The biological soil quality references have been selected based on the data available and the expertise of the participants involved. New references will be determined as soon new data become available concerning existing or new categories. A few participants noted that the category ‘cattle or dairy cattle farm on clay’ should be split into two categories, i.e. on marine clay and on river clay.
Differing evaluations made it difficult to choose a well-defined reference for some categories, such as mixed woodland on sand and municipal parks.
Finally, some categories are very much under-represented as far as the number of sampled locations is concerned, hindering the choice of location with a good soil quality (e.g. heathland, semi-natural
grassland and cattle farms on loess). The difficulties encountered in the current selection of references and the method used to combine the assessments of the different participants are to be evaluated and adapted in the near future.
The intention is that the references and averages are used to encourage sustainable land use in the Netherlands. They make it possible to assess soil quality transparently and in quantifiable terms. The condition at a particular location can be compared with the average condition in the Netherlands and with the biological soil quality reference. The reference represents a soil of relatively good quality, as derived from biological, chemical and physical parameters.
The precision of a particular reference from the present set of ten may be inadequate for some purposes. New references will be determined whenever additional data becomes available.
Nevertheless, it may be that there is no suitable reference because of site-specific circumstances or because of a new category which is not included in the LMB monitoring programme, such as dune soils. In such a case, it may be decided to determine a new region-specific or location-specific reference, which may provide the extra precision required.
A reference from the current set of ten is representative of an existing good quality soil, based on its biological, chemical and physical parameters. This does not mean that these existing soils: 1) perform maximally in theory, or 2) perform maximally for each separate ecosystem service, or sub-aspect of the soil ecosystem, in practise. The fact that selection of a reference is based on existing locations within the LMB plays a role in the first point. It is very possible that sites are to be found outside the LMB which have better soil quality, but from which no data have yet been obtained. The fact that selection of reference locations is based on an integral assessment of soil quality plays a role in the second point. This means that the performance of all ecosystem services taken together is optimal in the reference situation and less at all other locations in the LMB. It does not exclude the fact that one or more ecosystem services may function better than at the reference location (see Rutgers et al. 2007 for examples).
The biological soil quality references are a part of a standard for soil quality assessment within a framework for sustainable land use. Such a framework is only of practical use to land users if it is possible to improve soil quality by actually increasing the sustainability of the land use. In other words, a route for action is required, or ‘handles’ to influence soil quality through soil quality management. So far, little attention has been given to this in the definition of the biological soil quality references. We believe that an integrated and consensus-based vision is currently lacking as far as the relationship between soil quality management measures and the effect on the performance of specific ecosystem services is concerned. As a first step, a number of rules of thumb given in the grey literature have been included in this report for the soil ecosystem profile concerned. The relationships between soil quality management measures and the way in which the ecosystem services perform are the subject of a follow-up study.
The biological soil quality references are consistent with the approach as adopted in the EU Water Framework Directive (WFD) and its Good Ecological Status (GES). Conditions for surface waters representative of the GES are described in the WFD, within the boundaries of desirable human influence. The biological soil quality references can be seen as a description of the good ecological status of a soil, within the boundaries set by the land use. It is therefore very possible that the references will gain significance within the future EU Soil Framework Directive (SFD).
The biological soil quality references are part of a framework for sustainable land use. We believe that the introduction of these biological soil quality references is a cautious but significant first step towards the integrated quality assessment of the soil. The proposed method for the assessment of soil quality is an entirely new one, also at an international level. In theory, it is an alternative to the classic and more thematically-oriented soil policies which focus on threats and soil protection (including soil pollution, fertilizer use and pesticide application). This method does not yet replace this thematically-oriented approach, as it still requires further refinement. Furthermore, the Ministry of Housing, Spatial Planning and the Environment and the Ministry of Agriculture, Nature and Food Quality are not yet prepared to give sustainable land use a more normative character, so that the less informal thematic policy remains necessary.
Because we are at the first step in the process, more data and experience will quickly result in changes and improvements in the references and the framework for sustainable land use. The proposed changes to Dutch and European soil policy will stimulate developments which contribute to an integrated soil quality assessment.
We would be very interested in sharing experience, knowledge and expertise with any land users or participants who are working on determining the overall quality of their soil and on making land use more sustainable.
Structure of the report
The report provides information on the following fields of activity: ‘soil quality management in practise’, ‘developments in soil policy’, ‘the soil ecology of semi-natural ecosystems and
agro-ecosystems’ and ‘stress ecology’. Depending on the reader’s background and interests, various parts of the report will be relevant and, hopefully, interesting, whilst other parts may be superfluous. This report is not the final product in the development of a framework for sustainable land use, but should be seen as an account of a step in the right direction, i.e. an initial set of ten biological soil quality references. Many more such steps will need to be made in order to achieve a fully-operational and reliable set of instruments with which to support sustainable land use. Practical experience needs to be supplemented with research results and further data concerning the soil biological status of the Netherlands as far as soil quality management is concerned. This will require intensive collaboration in the years to come, between land users, soil scientists and policy developers.
The following information can be found in this report in various chapters and sections.
• Chapter 1 provides an introduction to life in the soil and the significance of this life to humans and society. This information, which can be obtained from the standard text books, is provided here as a summary. Attention is given to a rational relationship between the various soil ecology
disciplines.
• The state of soil in the Netherlands is summarised in chapter 2. This is based on data from ten years of monitoring of biological, chemical and physical parameters in the Netherlands Soil Monitoring Network (LMB).
• Chapter 3 outlines policy developments and the intention to stimulate sustainable land use. The perspectives of users on both small and larger spatial scales are dealt with. Ecosystem services are a key to the effective assessment of soil quality in relation to the sustainability of land use on various spatial scales.
• Chapter 4 is the core of the report, i.e. the ten soil ecosystem profiles in the Netherlands. Ten tables and amoeba charts are given, together with averages and frequency distributions for biological, chemical and physical data concerning soils found in the Netherlands and the reference quality. Ten separate descriptions are also given of the characteristics of the land use and soil type, including an account of the process leading to selection of the reference. No analysis is carried out in this report into the relationships between the references or the differences between the good quality as hypothesised by the scientists and the average condition in the Netherlands. The actions to be taken by soil managers in order to positively influence soil quality are outlined only partially and indicatively in this report. This too is a subject for further research.
1
Introduction to the living soil
1.1
The many faces of the living soil
People in the Netherlands are becoming increasingly conscious of the fragility of the environment and of the negative impact of human activities on the living environment. The question is no longer ‘whether’, but ‘to what extent’ we influence our living environment, and how far we can go before we cause irreversible damage to our life support system. Air and water have long been the focus of attention, as witnessed by the discussions concerning climate change and measures to reduce nutrient and pollution loads in surface waters.
Soil, however, has lagged behind in this respect. Although most people in the Netherlands are
concerned about soil pollution, they are not really very aware of the fragility of the soil as a part of our living environment. The soil is however far more than a dumping ground for all kinds of pollutants. The soil lives, thanks to all kinds of soil organisms and soil processes which ensure that plants and animals can grow, that the climate remains pleasant, that a farmer can produce, plants can adorn as ornaments in our gardens and natural systems can develop into resilient yet beautiful and diverse landscapes. Unlike air and fresh water, unfortunately, the soil is impenetrable to the naked eye, and the life within it is usually hidden from view. Furthermore, soil processes take place relatively slowly, so that a long time passes before any problems become apparent. It takes decades for a complete soil system to develop and maturation will continue for millennia. In fact, from a land user’s point of view, soil is a natural resource which is almost non-renewable.
There are numerous threats to the soil. Agricultural soil is in danger of losing certain features of healthy soils as a result of the increased scale and intensification of the agricultural sector. The excessive application of fertilizers, pesticides and soil cultivation techniques are used to compensate for losses resulting from the depletion and compaction of the soil, which damages healthy soil. Sealing the soil with roads, buildings, infrastructure, greenhouses and maintenance-friendly gardens adversely affects the water storage and drainage and the natural attenuation capacity of the soil, resulting in flooding and a poor urban climate. Soil cultivation techniques and the lowering of the water table result in the loss of stable organic matter in the soil, resulting in a reduction in water storage capacity, as well as the extra emission of CO2, an important greenhouse gas. This is especially problematic in peaty soils.
However, positive developments are also taking place. For example, there is an increasing awareness of the vulnerability of soil in the Netherlands. There are regulations limiting the application of pesticides and fertilizers, to prevent food quality problems and reduce nutrient and contaminant loads on groundwater and surface water. There is a steady increase in organic farming, with a focus on a healthy soil. People are starting to realise that land use should be sustainable, and that there should be balance in the exploitation of the environment and the economic and social benefits.The prevention of future problems also plays a role. In 2003, the Ministries of Housing, Spatial Planning and the
Environment (VROM), Agriculture, Nature and Food Quality (LNV) and Transport, Public Works and Water Management (V&W) sent a policy letter to the House of Representatives, setting out Dutch soil policy for the coming decade (VROM 2003) and stating that attention should be given to sustainable land use, and not just to the effects of soil pollution and other threats. This is based on the natural capacity of the soil to provide society with services, such as to support agricultural production through
the supply of nutrients, a good soil structure for a healthy root system and natural resistance to disease and pests. These ‘ecosystem services’ may be fully used by a land user, as long as this is done in a sustainable manner. The capacity of the soil to provide ecosystem services should therefore remain intact, if not rather be enhanced. These ecosystem services are described in chapter 3.
1.2
Soil, soil processes and soil organisms
The soil is a dynamic system over a long time scale. It takes tens of thousands of years for the soil profile to form, according to a cycle of creation and destruction. Once mineral particles have been deposited by wind, water or ice, the development of vegetation is an essential element in the formation of soil. ‘Young’ soils have a large mineral and lime content, but contain little organic matter unless they were rejuvenated by ice ages. Organic matter as a final product of photosynthesis is the primary source of carbon and energy in the soil system. The root structure of plants is very important to the soil architecture as they allow a humus profile to build up so that the soil becomes increasingly fertile. In older soils, the lime disappears, acidification takes place and the soil becomes again more compact.
Soil is not only an essential link in our living environment; it is also a living system in its own right. An unimaginable amount of life is to be found in the top layer of the soil. The biomass of all the organisms in a hectare of topsoil from a healthy field is comparable with that of sixty sheep or five cows; often even higher in the case of grassland. The diversity of soil life is also overwhelming. The biodiversity in a spade of fertile garden soil is comparable with that above soil in the Amazon rainforest. All this life together forms the soil system: a complex of mutually-connected organisms in a dynamic environment, connected through interactions such as predator-prey relationships and the conversion of energy and elements.
1.3
The soil food web
Each organism in the soil system has a function and a place in the food web (Figure 1). For example, large groups of organisms have specialised in the decomposition and dispersal of dead organic matter. Other groups of organisms feed on bacteria (bacterial-feeders), fungi (fungal-feeders), plant roots (microherbivores) or animals (predators and top predators). Some soil organisms are very selective and feed only on a few other species, whilst other species, the omnivores, exploit various food sources. There are various ways of examining the soil food web, for example the relationship between the food groups, the carbon and energy flows or the balance between small and large organisms. The difference in size between a bacterial cell and an earthworm is roughly five orders of magnitude (a factor of 100000). A balanced soil contains many small organisms and a few large organisms, according to their body size.
1.4
Organisms by group
1.4.1
Bacteria
With a size of a few micrometers (1/1000 mm; Figure 2), bacteria are the smallest and most abundant organisms, and can be found almost everywhere. A few billion bacteria, made up of tens of thousands of different species, are to be found in just a teaspoon of fertile soil. The concept of ‘species’ does not
have the same meaning as it does for higher organisms. Most bacteria reproduce asexually, but are capable of exchanging genetic material in other ways. Bacteria are primarily classified based on the way in which they convert organic compounds. Though most species are still unidentified, much knowledge has been gathered concerning the significance of bacteria to the soil ecosystem. Because of their small size, they are able to absorb nutrients very effectively and to compete with plant roots for minerals. They are directly involved in almost every biogeochemical cycle, such as the carbon, nitrogen, phosphate, iron and sulphur cycles. As a result, they have an important influence on the supply of nutrients to plants and bacteria themselves are a source of nutrition to many other animals. The soil would cease to function without the presence of bacteria. Important bacteria groups are the decomposers of organic matter, such as cellulose. Some bacteria are able to degrade pollutants, such as oil and pesticides.
It is actually possible to view the soil as a large bioreactor in which the bacteria are responsible for the majority of the conversions which take place, though in contrast to a bioreactor, the soil is poorly mixed and extremely heterogeneous. This means that there are innumerable gradients and microniches, so that biodiversity can be enormous. Some bacteria are able to multiply very quickly and so react rapidly to changes in the environment and the availability of nutrients, such as fertilizer. Bacteria multiply less quickly in acidic and nutrient-poor soils.
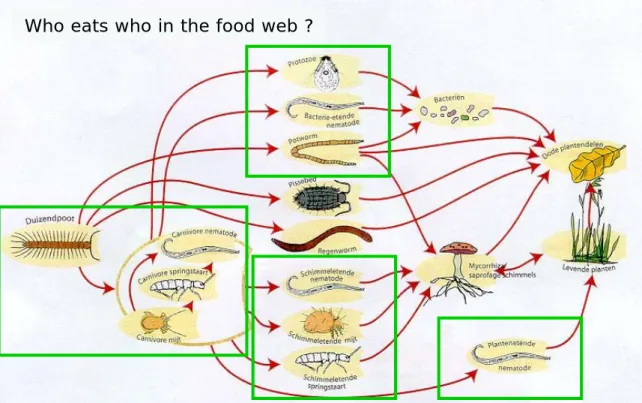
Figure 1. Diagram of the soil food web
The groups not shown in a box are those involved in decomposition processes and primary production. The groups in green boxes represent microherbivores, fungal-feeders and bacteria-feeders. The last box on the left represents the predators and top-predators (figure from R. de Goede).
Who eats who in the food web ?
Who eats who in the food web ?
1.4.2
Fungi
Fungi are another group of micro-organisms (Figure 2). Fungi form threads (hyphae) which have a diameter of just a few micrometers and a length of a few metres. These threads allow fungi to absorb nutrients and water from different places, which makes them better able to withstand dry and nutrient-poor conditions. They also cope better with acidic soils than bacteria. In contrast to bacteria, most fungi are not able to grow in anaerobic conditions, such as wet soil. Intensive cultivation of the soil also causes fungi to disappear. Most fungi are not visible above ground level, with the obvious exception of mushrooms, which grow on the ground in order to spread larger amounts of spores. Most of the fungi however is found below ground level, as mycelium. Natural soils, such as in heathlands, woodlands and semi-natural grasslands, contain more fungi than agricultural soils. Fungi are important in the breakdown of difficult to decompose organic matter, such as lignin, a constituent of plants. Free-living fungi are found in the soil, as well as fungi which form a relationship with plant root cells, the
‘mycorrhizas’, a relationship which is advantageous to both the plant and the fungi. The plant is able to absorb more water and minerals because the hyphae increase the efficiency of the entire root system and, in return, the fungi receive nutrients form the plant host in the form of sugars. Fungi are also a source of nutrition to many other soil organisms.
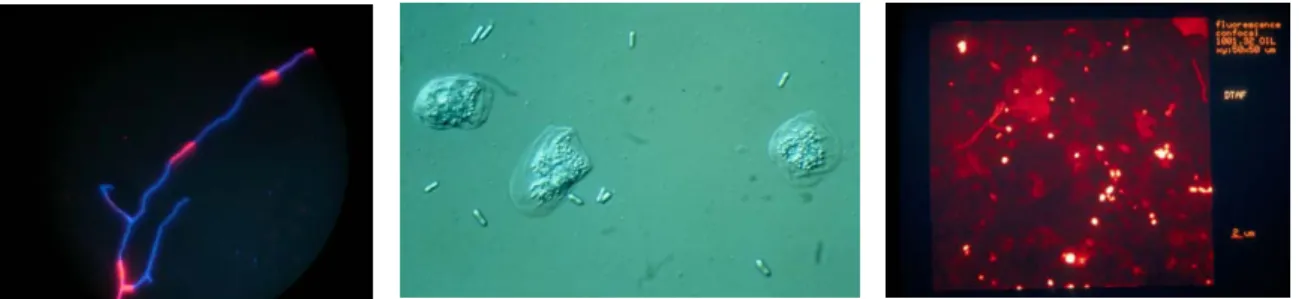
Figure 2. Three groups of micro-organisms
Left: fungal threads (active and non-active parts are shown in different colours, magnification 400x); Middle: protozoa (amongst smaller bacteria; magnification 800x);
Right: bacteria (fluorescent colour, bright dots amongst other soil particles; magnification 1000x).
1.4.3
Protozoa
Protozoa are microscopically small, single-celled animals with a size of 5 to 500 micrometres (Figure 2). They are unable to cope with drought and, like bacteria, live in the layer of water
surrounding and filling the spaces between soil particles, and in organic matter such as plant remains. Unlike larger bacteria-feeders, they are able to find their way into the very smallest pores in the soil. When they decompose, minerals such as nitrogen and phosphate are released, and are therefore again available for plant growth (the nutrient cycle). Protozoa can grow almost as quickly as bacteria and are therefore capable of keeping bacterial numbers under control. This feeding stimulates bacterial activity, in the same way as mowing a lawn stimulates the growth of grass. Protozoa are in turn eaten by larger animals, forming a link in the food web.
1.4.4
Eelworms (nematodes)
Nematodes, also called eelworms, are found in all types of soil. Between 2000 and 10000 nematodes can be found in 100 grams of soil, and between 20 and 60 species. Most eelworms are 0.2 to 3 millimetres long and just 0.01 to 0.06 millimetres in diameter (Figure 3). They are either transparent or pale, and under the microscope look like tiny eels.
Nematodes feed on bacteria, fungi, small invertebrates and plants. The functional groups are classified according to their primary food source: bacterivore, fungivore, carnivore, omnivore, yeasts and algae-feeding or herbivore nematodes. In many cases, it is possible to determine to which functional group a species belongs by studying the form of the mouth and the specific differentiation of the mouth morphology and the stylet. Nematode fauna can also be classified according to other ecological
characteristics, such as the ‘life history traits’. These traits concern the way in which an organism reacts to its surroundings. For example, species which are able to respond quickly to sudden nutrient-rich conditions are called ‘colonisers’, due to their fast reproduction. There are also ‘persister’ organisms, which have long life cycles, low reproduction rates and make specific adaptations to the surroundings. This ecological classification is the basis for the nematode maturity index (MI; Bongers 1990). Environmental factors such as food availability, vegetation composition and abiotic conditions (soil type) determine which combination of nematode species and functional groups are present.
Because of the economic significance, much research is being carried out worldwide into species with pathogenic properties such as parasitic behaviour on agricultural crops. Agricultural infestations can take place if the balance in the ecosystem is disturbed. It is only in the last 20 years that ecological nematode research has reached significant proportions. Nematodes contribute to the ecological function of the soil. For example, microbivore nematodes influence the mineralization of nutrients by feeding on bacteria and fungi and herbivore nematodes feed on cell sap from plant roots and therefore influence primary production in the terrestrial ecosystem.
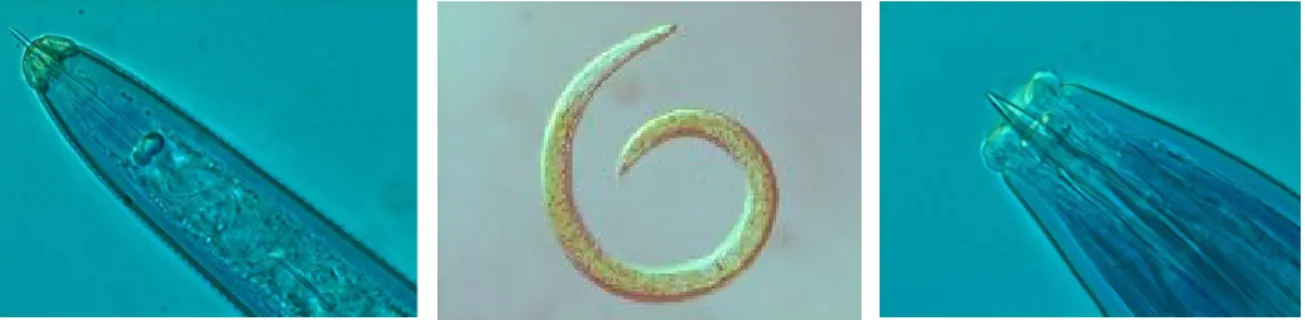
Figure 3. Nematodes (eelworms)
Nematodes come in all shapes and sizes, but are often identified by the mouth parts. From a slightly greater distance (centre) they look like small worms.
1.4.5
Potworms (enchytraeids)
Potworms, or enchytraeids, are small pale worms which are related to the earthworm (Figure 4). They differ from earthworms in their size (up to 2 cm long and only 1-2 mm in diameter) and their
white colour. Potworms are found in almost all soils, with a density varying from a few hundred to a few million per square metre. About 50 different species are found in the Netherlands. Their
importance in the soil is comparable with that of earthworms, though their small size means that the scale on which they influence the soil differs, so that they supplement the earthworm activity.
Potworms feed on plant and animal remains and are therefore found mainly in the uppermost layers of the soil and in forest litter. Like earthworms, they are able to burrow and move actively through the soil, and therefore play a role in mixing organic matter through the soil profile. Furthermore, their wormcasts form small particles of soil aggregate which, together with the organic matter they carry into the soil, contribute to the soil structure. Each type of potworm has its own preference for a certain type of soil or vegetation. The various species also differ in their preference for the soil layer in which they are found and it is these differences, and our knowledge of them, which make potworms such useful bioindicators.
1.4.6
Earthworms
Everybody knows the earthworm. Unlike many other soil organisms, their size makes earthworms easy to observe (‘macrofauna’; Figure 4). About 25 species are known to exist in the Netherlands, though most are rarely observed and only a few are very common. Earthworms can be classified into three ecological groups, based on their choice of food, their behaviour and where they are found in the soil. The importance of earthworms to the soil functioning is strongly related to these differences. ‘Deep burrowers’ are large earthworms which make mainly vertical burrows and carry litter deep into the soil. They increase the organic matter content and improve soil fertility and its capacity for drainage. Species which create a network of burrows at the soil’s surface help compost plant remains and improve soil aggregate stability. Their wormcasts contain large amounts of nitrogen, phosphate and potassium. Worms which live deeper in the soil do not create a network of burrows, but constantly eat their way through the soil. This ‘bioturbation’ stimulates microbial activity and promotes aeration of the soil. The presence of earthworms is dependent on soil properties such as acidity, moisture level, temperature and texture. There must also be sufficient food available. Earthworms are very sensitive to soil cultivation, such as ploughing and manure injection, as well as to soil pollution.
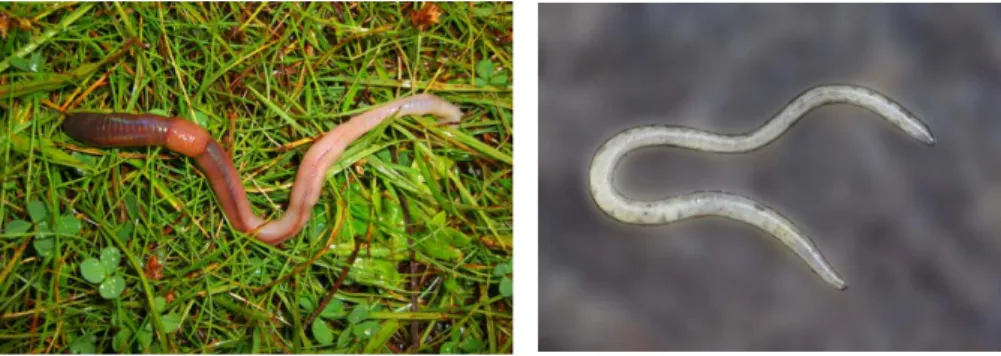
Figure 4. Earthworm and potworm
The earthworm (left) is one of the largest soil organisms and is considered a 'soil engineer’. Earthworms play a key role in the decomposition and fragmentation of organic matter and in the formation of a good soil structure. Worms often form the staple diet for small mammals and birds. The potworm (right) is much smaller but also plays an important role in decomposition.
1.4.7
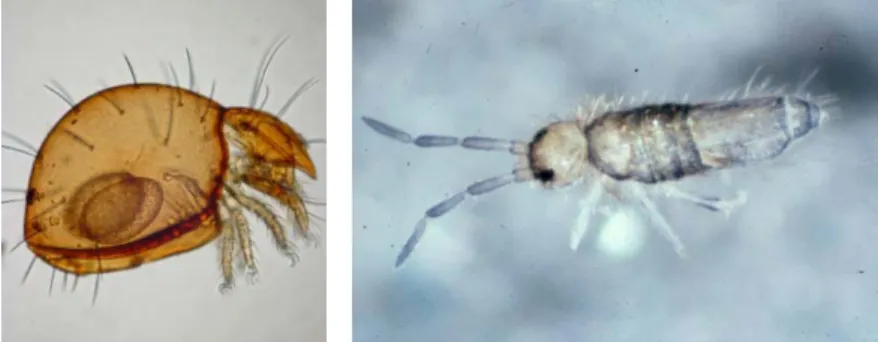
Mites and springtails
After bacteria, protozoa and nematodes, mites and springtails are the most commonly-found small animals in the soil. Mites roughly resemble spiders, and springtails are fast-moving little insects. Between 40 000 and 120 000 individuals can be found living in one square metre of soil in the Netherlands. Most types are very active and spread bacteria and fungal spores through the soil either on their feet or via their waste. At least 600 species are found in the Netherlands, classified for research purposes according to what they feed on or their life cycle. For example, fungal-feeders take bites of growths of fungi, eating whole threads at a time. They need a soil rich in fungi, though they only eat the contents of the fungi, by piercing the threads and sucking them dry. This means that they are able to take immediate advantage of the nutritious content, but that their contribution to nutrient flows is limited as the threads are left behind, undigested. There are also various predators, for example nematode-feeders. Examples of life cycle groups are phoretic and asexual species. Phoretic species are able to adapt to a changing environment. If the surroundings become inhabitable, they clamp onto a larger insect, such as a midge or fly, and are quickly transferred to a new habitat. In contrast, certain groups of the asexual species are actually dependent on a stable environment, where it is an advantage for the offspring to be identical to the parents. Food groups and life cycle groups are valuable tools for gaining insight into the ecological quality of the soil.
Figure 5. A mite (left) and a springtail (right)
1.5
Soil processes
Soil can be regarded as a large, complex, poorly mixed bioreactor. Macro elements and energy are the primary constituents of the living soil system and of all life on earth. The following macro elements are often identified: carbon (C), hydrogen (H), oxygen (O), nitrogen (N), phoshorus (P), potassium (K) and sulphur (S). Carbon chains form the building blocks of molecules from which life is built, and in which energy from the sun is stored. Above-ground, water and CO2 are converted into sugars through
photosynthesis. The sugars are converted into starch, protein and other cell materials. As a result of eating and being eaten (the food web), carbon and energy flow through the ecosystem. Life therefore revolves around the carbon cycle and the resulting energy flows.
The cycles of other important elements are also linked to the carbon cycle, and the transport of many elements takes place through water. Hydrogen, oxygen and carbon are key elements in the bulk of this
transport and in the utilisation of energy by life on earth. Nitrogen is an important element in proteins, biomolecules which are responsible for all biological conversions. Phosphorus is the most crucial element in DNA molecules and in oxidative phosphorylation, the process by which cells convert and store energy. Potassium regulates the energy and electrolyte balance in cells. Sulphur is an essential component of many proteins, and is also important in the supply of energy in some organisms.
As well as the macro elements named above, there are many other elements which are important to the functioning of the soil system. Iron is a key element in various biomolecules, including chlorophyll, which is involved in the capture of energy from the sun through photosynthesis. Manganese, copper, nickel, molybdenum and other metals are components of proteins or involved in certain oxidation and reduction reactions in the soil.
A number of specific characteristics for the most important soil processes are given below.
1.5.1
Carbon and energy flows
Reduced carbon is transferred into the soil from dying plants, excretion from roots or from animal manure. This reduced carbon is the main source of carbon and energy in the soil system. Bacteria, fungi and the whole soil food web, up to and including earthworms, use oxygen and oxidation reactions to produce biomass from this reduced carbon, during the process of which a lot of CO2 is also formed.
The decomposition of organic carbon to CO2 is also called C mineralization, and is easily measured as
soil respiration (O2 depletion and CO2 production). Under anaerobic conditions, methane (CH4) can
also be produced by methanogenic bacteria, especially in wet peat soils (marsh gas). Methane is a much more active greenhouse gas than CO2 (23 times). In well-drained peat soils and mineral soils (sand,
sandy clay and clay), methane-oxidizing bacteria again convert methane into the less harmful CO2.
Some organisms, such as nematodes and fungi, are able to use living plant roots for their carbon and energy requirements.
1.5.2
Nitrogen cycle
Nitrogen enters the soil from fertilizers and plant remains. In addition, air pollution implies the transfer and deposition of nitrogen (atmospheric deposition). Some species of bacteria (nitrogen fixers), which usually live in the tubers of legumes such as clover, are able to bind atmospheric nitrogen and convert it into organic nitrogen. Organic nitrogen produced by the remains of soil organisms, fertilizer and plant remains is broken down throughout the soil food web and secreted in a mineral form as
ammonium (N mineralization), which is strongly adsorbed by soil particles. Through certain bacteria (nitrifiers) ammonium is converted into the much more mobile nitrate, which is easily transported through water. Plants are therefore able to absorb it rapidly, but it also means it can leach into groundwater and surface water. This means that the nitrogen is lost to the plants, and that the
groundwater becomes contaminated. In anaerobic conditions, many bacteria use nitrate for respiration, which reduces nitrate to gaseous nitrogen (N2). This is the process of denitrification. Nitrogen is
transferred to the atmosphere and is again lost to the plants. N2O (laughing gas) is also released as a
by-product during nitrification, and is a powerful greenhouse gas, 300 times more active than CO2.
Because nitrogen is so mobile and so easily lost from the soil, it is often a limiting factor in plant growth and an important factor in the application of fertilizer. Nitrogen mineralization from organic matter is an important process in fertile soil.
1.5.3
Water
The largest transporter of matter and biomolecules is water. Soil organisms are largely composed of water. The water balance and the water cycle are crucial to life on earth. The soil influences this cycle,
and vice versa. The water cycle in the soil is important to the living environment, on both a local and larger spatial scale.
Water leaves the reservoir, the ocean, as a result of evaporation and begins a long cycle via
precipitation, absorption in the soil and absorption by plants and animals, to ultimately return to the ocean through evaporation, transportation and/or precipitation. On a small scale too, it is possible to identify evaporation, precipitation, absorption and local transportation in the soil and organisms as a part of the larger cycle. A water molecule can therefore pass through many organisms before returning to the ocean.
Moisture conditions vary in the soil as a result of climate factors such as temperature, wind, atmospheric humidity, precipitation and drought, as well as the water requirements of the terrestrial ecosystem and the mobility of the water molecules. The soil is sometimes dry, sometimes much too wet and, rarely, exactly right. Even in dry conditions, water is usually present in the smallest pores, though plants and animals find it difficult to extract. The soil acts as a sponge which absorbs water in times of excess, and slowly releases water to the terrestrial ecosystem in times of drought. The soil structure is a crucial factor in this process.
1.5.4
Structure formation
The soil structure and the soil’s capacity to retain water and nutrients are improved by fungi and bacteria, which form aggregates from soil particles. Bacteria and fungal activity is stimulated by the predation by nematodes, microarthropods (mites and springtails), potworms and earthworms. The casts and the burrowing behaviour of earthworms improves porosity and soil aeration and promotes the growth of roots, enabling the growth of stronger and more productive crops. The soil structure is improved through the burial of plant remains by certain species of earthworms, i.e. the transport of organic matter, because this results in better water retention. Excess rainwater is primarily drained away through the deep vertical tunnels made by the deep burrowing earthworm species. Soil cultivation and fertilization have a direct influence on earthworms and micro organisms and therefore determine soil structure and soil fertility.
2
The state of soil in the Netherlands
2.1
The Netherlands Soil Monitoring Network
The Netherlands Soil Monitoring Network (LMB) was established in 1993. Its original purpose was to provide a national overview of pollutant concentrations in the soil. There are 200 locations in the LMB; 20 locations in each category, each having a unique land use and soil type combination. Biological monitoring in the LMB was begun in 1997 (Schouten et al. 1997, 2002), for which an additional 180 locations were selected which are of interest from a soil ecology point of view, such as nature reserves, municipal parks and organic farms. All 380 locations are sampled once every six to seven years. The distribution of the sampling locations throughout the Netherlands is shown in Figure 6. Data from at least one sampling round are now available for each location.
In addition to a standard soil analysis using a set of chemical parameters, the soil is also analysed using the Biological Indicator for Soil Quality (BISQ) and a number of additional physical characteristics, including bulk density, penetration resistance and moisture content. BISQ is a very useful way of measuring soil organisms and soil processes. Soil quality management and farm management data are also collected. BISQ provides indicators for the following organisms and processes (Schouten et al. 1997, 2002):
• Carbon cycle and nitrogen cycle
• Bacteria and fungi (microbes)
• Eelworms (nematodes)
• Potworms (enchytraeids)
• Earthworms (lumbricids)
• Mites and springtails (microarthropods)
Protozoa were not analysed due to problems with the methodology. Indicators are determined for most organisms, based on biomass, abundance, composition and species diversity data. Species identification takes place up to genus or species level. Earthworms are handsorted, while enchyhtraeids, nematodes and mictroarthropods are extracted from the soil. Several methods for microbial analysis are used, such as fungal and bacterial biomass determination by microscopic techniques and image analysis, microbial activity measurements, carbon and nitrogen mineralization rates, and diversity parameters (denaturing gradient gelelectrophoresis, and catabolic profiling with Biolog® plates). For more details the reader is referred to Schouten et al. (2002).
For earthworms, six 20x20x20 cm cubes of soil were dug at random locations. For potworms and the mites and springtails, 6 cores were taken (length 15 or 7.5 cm; diameter 5.8 cm). For nematodes, bacteria, fungi, soil characteristics and process parameters, about 320 samples of 10 cm deep were taken using a soil core sampler, then mixed together. The BISQ sampling programme takes place in the months April and May as the various soil ecosystems are then active and relatively stable, and the moisture and nutrient levels fairly constant and relatively independent of weather conditions. A detailed description of the biological soil analysis with the BISQ is given by Schouten et al. (2002).
The LMB is implemented at ‘farm level’ as data on substance flows (supply and transport) are already collected for the agricultural sector as a whole by the Agricultural Economics Research Institute (LEI). These data enable the calculation of balances and soil and groundwater loads. It is uncommon to carry
Figure 6. Biological soil monitoring locations in the Netherlands Soil Monitoring Network (LMB) Land use and soil type combinations are each given a unique symbol and colour: dairy cattle and cattle farms (◊), arable land (), natural areas ({), sand (green/beige), clay (blue/red), peat (brown) and loess (white/pink).
Sampling sites BISQ / DSMN
Dairy farm sand organic Dairy farm sand extensive Dairy farm sand intensive Dairy farm sand intensive+ Dairy farm river clay intensive Dairy farm marine clay organic Dairy farm marine clay intensive Dairy farm peat organic Dairy farm peat intensive Dairy farm loess organic Dairy farm loess intensive Arable farm sand organic Arable farm sand intensive Arable farm marine clay organic Arable farm marine clay intensive Horticulture sand
Bulb-growing sand Semi-natural grassland sand Heathland sand
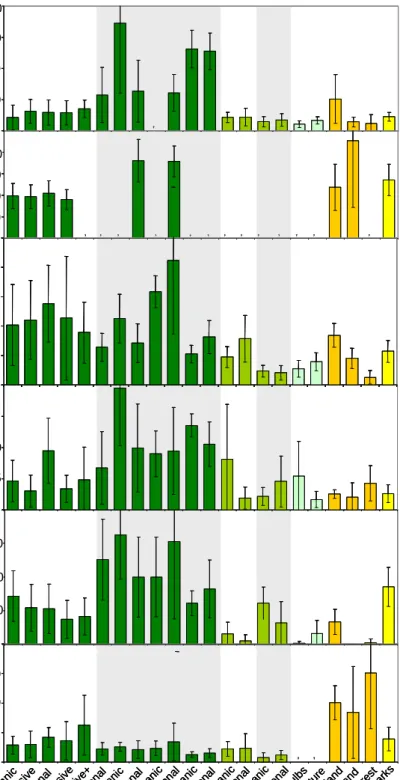
Figure 7. Number or biomass of soil organisms for certain land use and soil type combinations
Data are obtained from ten years of monitoring. The colour of the bars indicates the land use: dark green - cattle or dairy farming, light green - arable farming, light blue - horticulture and bulb growing, orange - natural areas and yellow - urban green (parks). A white background is used for the soil type sand, a grey background for clay, loess or peat. Error bars are standard deviations. Micro-arthropods in mixed forest are determined also in organic layer, while nematodes and bacteria were determined in the mineral layers
0 2 0 0 4 0 0 6 0 0 8 0 0 Wo r m t o t aal aa 2) 0 2 5 5 0 7 5 1 0 0 Po t w o r m to ta a l a a n t a 2 ) 0 5 0 1 0 0 1 5 0 2 0 0 M i cr o -ar t t o t aal a ant 2 ) ? ? 0 2 0 0 4 0 0 6 0 0 8 0 0 B a ct er i bi om as s a ? 0 10 20 30 40 50 Sc h i m bi o m as s a ? ? ? ? ? ? ? ? ? ? ? ? ? 0 30 60 90 120 150 N em a tode n totaa l aa ntal (nx 1 0 0 /100g v e rse gr ond ) ba cte ri a bi om as s (µ g C / g D W ) fu ng i bi om ass (µg C / g D W ) ne ma tod e s num ber (n x 1 00 / 1 0 0g v e rs e g) po tw o rm s num ber (n x 1 00 0 / m 2) e a rt hw or ms num ber (n / m 2) mi c ro-ar th ro p o d s num ber (n x 1 00 0 / m 2) 0 50 150 100 200 400 600 25 50 75 30 60 90 120 0 0 0 0 10 20 30 40 0 200 400 600 800 Sand orga nic Sand co nven tion al e xtens ive Sand conv entio nal San d con ven tion al in tensi ve Sand c onv entio nal in tens ive+ Riv er c lay co nve ntion al Ma rine c lay o rgan ic Mari ne cl ay co nvent ional Peat org anic Peat conv ention al Loe ss orga nic Loe ss co nven tional Sand org ani c Sand co nven tiona l Mari ne cl ay o rgani c Mari ne c lay co nven tion al Sand co nven tiona l flo wer b ulbs Sand conv entio nal h orticu lture San d s em i nat ura l gras sland Sand heat hlan d Sand mi xed fo rest San d c ity park s 0 2 0 0 4 0 0 6 0 0 8 0 0 Wo r m t o t aal aa 2) 0 2 5 5 0 7 5 1 0 0 Po t w o r m to ta a l a a n t a 2 ) 0 5 0 1 0 0 1 5 0 2 0 0 M i cr o -ar t t o t aal a ant 2 ) ? ? 0 2 0 0 4 0 0 6 0 0 8 0 0 B a ct er i bi om as s a ? 0 10 20 30 40 50 Sc h i m bi o m as s a ? ? ? ? ? ? ? ? ? ? ? ? ? 0 30 60 90 120 150 N em a tode n totaa l aa ntal (nx 1 0 0 /100g v e rse gr ond ) ba cte ri a bi om as s (µ g C / g D W ) fu ng i bi om ass (µg C / g D W ) ne ma tod e s num ber (n x 1 00 / 1 0 0g v e rs e g) po tw o rm s num ber (n x 1 00 0 / m 2) e a rt hw or ms num ber (n / m 2) mi c ro-ar th ro p o d s num ber (n x 1 00 0 / m 2) 0 50 150 100 200 400 600 25 50 75 30 60 90 120 0 0 0 0 10 20 30 40 0 200 400 600 800 Sand orga nic Sand co nven tion al e xtens ive Sand conv entio nal San d con ven tion al in tensi ve Sand c onv entio nal in tens ive+ Riv er c lay co nve ntion al Ma rine c lay o rgan ic Mari ne cl ay co nvent ional Peat org anic Peat conv ention al Loe ss orga nic Loe ss co nven tional Sand org ani c Sand co nven tiona l Mari ne cl ay o rgani c Mari ne c lay co nven tion al Sand co nven tiona l flo wer b ulbs Sand conv entio nal h orticu lture San d s em i nat ura l gras sland Sand heat hlan d Sand mi xed fo rest San d c ity park s 0 2 0 0 4 0 0 6 0 0 8 0 0 Wo r m t o t aal aa 2) 0 2 5 5 0 7 5 1 0 0 Po t w o r m to ta a l a a n t a 2 ) 0 5 0 1 0 0 1 5 0 2 0 0 M i cr o -ar t t o t aal a ant 2 ) ? ? 0 2 0 0 4 0 0 6 0 0 8 0 0 B a ct er i bi om as s a ? 0 10 20 30 40 50 Sc h i m bi o m as s a ? ? ? ? ? ? ? ? ? ? ? ? ? 0 30 60 90 120 150 N em a tode n totaa l aa ntal (nx 1 0 0 /100g v e rse gr ond ) ba cte ri a bi om as s (µ g C / g D W ) fu ng i bi om ass (µg C / g D W ) ne ma tod e s num ber (n x 1 00 / 1 0 0g v e rs e g) po tw o rm s num ber (n x 1 00 0 / m 2) e a rt hw or ms num ber (n / m 2) mi c ro-ar th ro p o d s num ber (n x 1 00 0 / m 2) 0 50 150 100 200 400 600 25 50 75 30 60 90 120 0 0 0 0 10 20 30 40 0 200 400 600 800 0 2 0 0 4 0 0 6 0 0 8 0 0 Wo r m t o t aal aa 2) 0 2 5 5 0 7 5 1 0 0 Po t w o r m to ta a l a a n t a 2 ) 0 5 0 1 0 0 1 5 0 2 0 0 M i cr o -ar t t o t aal a ant 2 ) ? ? 0 2 0 0 4 0 0 6 0 0 8 0 0 B a ct er i bi om as s a ? 0 10 20 30 40 50 Sc h i m bi o m as s a ? ? ? ? ? ? ? ? ? ? ? ? ? 0 30 60 90 120 150 N em a tode n totaa l aa ntal (nx 1 0 0 /100g v e rse gr ond ) 0 30 60 90 120 150 N em a tode n totaa l aa ntal (nx 1 0 0 /100g v e rse gr ond ) ba cte ri a bi om as s (µ g C / g D W ) fu ng i bi om ass (µg C / g D W ) ne ma tod e s num ber (n x 1 00 / 1 0 0g v e rs e g) po tw o rm s num ber (n x 1 00 0 / m 2) e a rt hw or ms num ber (n / m 2) mi c ro-ar th ro p o d s num ber (n x 1 00 0 / m 2) 0 50 150 100 200 400 600 25 50 75 30 60 90 120 0 0 0 0 10 20 30 40 0 200 400 600 800 Sand orga nic Sand co nven tion al e xtens ive Sand conv entio nal San d con ven tion al in tensi ve Sand c onv entio nal in tens ive+ Riv er c lay co nve ntion al Ma rine c lay o rgan ic Mari ne cl ay co nvent ional Peat org anic Peat conv ention al Loe ss orga nic Loe ss co nven tional Sand org ani c Sand co nven tiona l Mari ne cl ay o rgani c Mari ne c lay co nven tion al Sand co nven tiona l flo wer b ulbs Sand conv entio nal h orticu lture San d s em i nat ura l gras sland Sand heat hlan d Sand mi xed fo rest San d c ity park s Sand orga nic Sand co nven tion al e xtens ive Sand co nven tiona l San d con ven tion al in tensi ve Sand c onv entio nal in tens ive+ Riv er c lay co nve ntion al Ma rine c lay o rgan ic Mari ne cl ay co nvent ional Peat org anic Peat conv ention al Loe ss orga nic Loe ss co nven tional Sand org ani c Sand co nven tiona l Mari ne cl ay o rgani c Mari ne c lay co nven tion al Sand co nven tiona l flo wer b ulbs Sand conv entio nal h orticu lture San d s em i nat ura l gras sland Sand heat hlan d Sand mi xed fo rest San d c ity park s
out biological soil analyses over such large areas. The heterogeneity of the soil and the differences in cultivation techniques were regarded as a problem. However, the aim of the LMB, BISQ and
Biological Soil Quality Reference is to provide a picture of soil quality at a national level, broken down into categories where necessary and possible. This is basically an ecological soil typology, but one which is determined by the most important land use forms and the identification of measures which promote sustainable land use. This requires that samples can be taken from a representative section of the land use category. The LMB approach, to do this using farms, is a very practical one.
There are however a number of land-use forms which do not lend themselves to this ‘farm approach’, such as woodlands, heathlands, natural grasslands, and municipal parks. These four forms have usually clear boundaries, but are less homogeneous in terms of vegetation cover than farms. It was therefore decided not to include any unmanaged area in the LMB, but to limit it to areas with rather uniform canopy or structure. The LMB methodology was applied as accurately as possible in these areas.
2.2
Results of ten years of monitoring
Biological, chemical and physical soil parameters were monitored and analysed over a ten year period and the results were input into an extensive database. As data are added, the size of the database and its significance to policy and research increases year by year. A number of biological soil parameters are summarised for different land use and soil type combinations in Figure 7. Some of the conclusions which can be inferred from the data are:
• Land use, soil type and soil management all influence the density and composition of soil organisms.
• There are more mites and springtails found in ‘natural’ areas than in other areas. The possible explanation is that mites and springtails are more sensitive to soil disturbance than other animals.
• Far fewer earthworms are found in nature reserves than in agriculturally-managed grasslands. A fair number of earthworms are found in semi-natural grasslands. Woodland and heathland soils contain very few earthworms, if any at all. The low pH is known to be one of the reasons for this.
• There is much less life in soil under arable land compared with that under grassland, as shown by the reduced biomass and numbers for almost all soil organisms. Intensive soil cultivation
techniques are thought to be one of the most important reasons for the reduction in organic matter and soil organisms.
• The most potworms and earthworms are found in cattle and dairy cattle farms on clay, loess and peat.
• The total biomass of bacteria is highest in clay and loess soils. Nematodes are most abundant in peat.
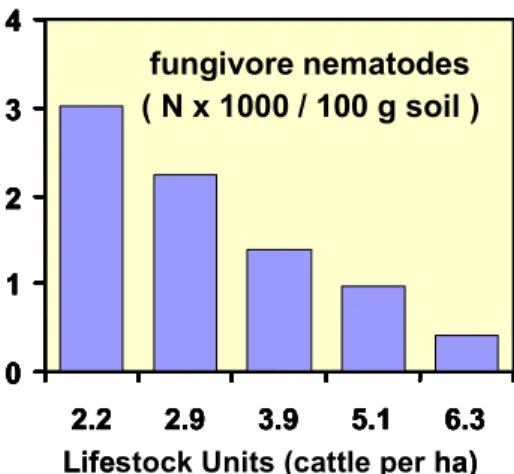
As well as the land use and soil type, the intensity of the land use also determines the composition of the soil ecosystem. The management intensity on dairy cattle farms (grassland, sometime rotated with maize) on sandy soils varies greatly within the monitoring network. This is because 87 locations are sampled, spread over four management categories, i.e. organic, extensive, conventional and extra intensive. This last category describes dairy farming supplemented with another type of farming, such as pig or poultry farming. The results show that the biodiversity of eelworms in the soil in dairy farms decreases with increasing management intensity, expressed as the number of livestock units per hectare. The number of fungal-feeding eelworms shows a sharp decrease (Figure 8). The relationship
between cattle density and the composition of nematode communities was analysed by Mulder et al. (2003, 2005b).
Many of the results from ten years of biological soil monitoring have been published in different reports by various institutes (for example Schouten et al. 1997, 2000, 2001, 2002, Van der Waarde et al. 2002, Van Eekeren et al. 2003, Mulder et al. 2004, Bloem et al. 2004, Breure et al. 2004, Smeding et al. 2005 and Rutgers et al. 2002, 2005, 2007) and in scientific journals (for example Didden 2003, Mulder et al. 2003, 2005a, 2005b, 2005c, 2005d, 2006, Schouten et al. 2004 and Bloem et al. 2006).
The effect of changes in the soil ecosystem on ecosystem services, in terms of processes and organism numbers, diversity and activity, is not addressed in this report. Rutgers et al. (2005, 2007) have
established a relationship between these changes and ecosystem services for specific cases, an example of which is given in chapter 3.
Figure 8. Decrease in fungal-feeding nematodes
Relationship between soil management intensity (expressed as livestock units per hectare) and the number of fungal-feeding nematodes.
fungivore nematodes ( N x 1000 / 100 g soil ) 0 1 2 3 4 2.2 2.9 3.9 5.1 6.3 fungivore nematodes ( N x 1000 / 100 g soil ) fungivore nematodes ( N x 1000 / 100 g soil ) 0 1 2 3 4 2.2 2.9 3.9 5.1 6.3 fungivore nematodes ( N x 1000 / 100 g soil )
Lifestock Units (cattle per ha)
fungivore nematodes ( N x 1000 / 100 g soil ) 0 1 2 3 4 2.2 2.9 3.9 5.1 6.3 fungivore nematodes ( N x 1000 / 100 g soil ) fungivore nematodes ( N x 1000 / 100 g soil ) 0 1 2 3 4 2.2 2.9 3.9 5.1 6.3 fungivore nematodes ( N x 1000 / 100 g soil )
3
Towards more sustainable land use
3.1
Sustainable soil
Land users and land use experts, especially in the agricultural sector, often have a good understanding of soil quality and how to use the land in a sustainable manner (Koopmans et al. 2006, 2007, Oenema 2003). The Ministries of LNV and VROM recently conducted a study into the sustainability of land use in agriculture (Van Dam et al. 2006, Bodem+ 2006). The quality of the soil for farming is determined by the organic matter content, drainage, the capacity to supply moisture, the bearing capacity, nutrient supply and low weed pressure. Fertilization, soil cultivation techniques, crop rotation and water table management all play an important role in determining these properties. Farmers and agricultural advisors are of the opinion that sustainable land use is only possible if the following management measures are applied:
• The nutrient supply and organic matter balance should be maintained through the application of solid organic fertilizer and, where necessary, the surface application of slurry.
• Light machinery should be used on the land, with a low load and low tyre pressure and this should be done at times when the soil is not sensitive to compaction, i.e. during dry periods.
• Non-intensive crop rotation, limited and shallow soil cultivation techniques and a high percentage of grassland.
• Limited pesticide application.
Trying to achieve higher production, for example by choosing a certain crop rotation, threatens the sustainability of land use. The conclusion drawn is that Dutch agriculture is relatively sustainable, but that there are specific areas which require improvement, such as using machinery on the land which is too heavy, or used at the wrong time. The sustainability of land use is assessed in this study from the point of view of agriculture (Bodem+ 2006). A step towards more sustainable land use is aimed for by this report, for all land users and on various spatial scales.
3.2
Soil’s contribution to society
The concept ‘soil quality’ plays an important role in sustainable land use. It is a directional concept; it allows evaluation of the soil and can therefore be used in improving soil management practices towards more sustainable land use. The Ministries of VROM and LNV do not propose a normative character within the policy framework of sustainable land use and the preservation of soil quality.
Soil quality, sometimes also called ‘soil health’, can be determined through assessment of the soil’s ‘ecosystem services’. The soil provides ecosystem services which can be exploited by the land user, within certain sustainability limits. For example, ecosystem services ensure that plants can grow, that water is drained and made available and that pollutants are broken down to produce non-noxious compounds. This description of ecosystem services is based on the assumption that they are a final product of the soil ecosystem. Ecological functions differ from ecosystem services in that a function is never a final product.
Although soil quality management takes place primarily on a local scale, land use and the associated soil ecosystem services are of significance on many different spatial scales. Local land use, for