Publications of the National Public Health Institute A 3/2008
Department of Environmental Health National Public Health Institute Kuopio, Finland
and
Department of Environmental Sciences University of Kuopio, Finland
Kuopio 2008
Characterization of Microorganisms
in Indoor Environments
Ulla Lignell
CHARACTERIZATION OF MICROORGANISMS IN INDOOR
ENVIRONMENTS
A C A D E M I C D I S S E R T A T I O N
To be presented with the permission of the Faculty of Natural and Environmental Sciences, University of Kuopio, for public examination in auditorium L21,
Snellmania Building, on February 9th 2008, at 12 o’clock noon.
National Public Health Institute, Department of Environmental Health, Kuopio, Finland
and
Department of Environmental Sciences, University of Kuopio, Finland
P u b l i c a t i o n s o f t h e N a t i o n a l P u b l i c H e a l t h I n s t i t u t e K T L A 3 / 2 0 0 8
Copyright National Public Health Institute
Julkaisija-Utgivare-Publisher Kansanterveyslaitos (KTL) Mannerheimintie 166 00300 Helsinki
Puh. vaihde (09) 474 41, telefax (09) 4744 8408 Folkhälsoinstitutet
Mannerheimvägen 166 00300 Helsingfors
Tel. växel (09) 474 41, telefax (09) 4744 8408 National Public Health Institute
Mannerheimintie 166 FIN-00300 Helsinki, Finland
Telephone +358 9 474 41, telefax +358 9 4744 8408 ISBN 978-951-740-770-0
ISSN 0359-3584
ISBN 978-951-740-771-7 (pdf) ISSN 1458-6290 (pdf)
Kannen kuva - cover graphic: Yliopistopaino
S u p e r v i s e d b y
Research Professor Aino Nevalainen, Ph.D. Environmental Microbiology Laboratory Department of Environmental Health National Public Health Institute Kuopio, Finland Professor Pentti Kalliokoski, Ph.D. Department of Environmental Sciences University of Kuopio Kuopio, Finland Dr. Merja Kontro, D.Sc. (Tech.) Department of Ecological and Environmental Sciences University of Helsinki Lahti, Finland R e v i e w e d b y
Professor Linda Stetzenbach, Ph.D. Department of Environmental and Occupational Health University of Nevada Las Vegas, Nevada, USA Dr. Regine Szewzyk, Ph.D. Department of Environmental Hygiene Federal Environment Agency Berlin, Germany O p p o n e n t
Professor Tiina Reponen, Ph.D. Department of Environmental Health University of Cincinnati Cincinnati, Ohio, USA
Ulla Lignell, Characterization of microorganisms in indoor environments Publications of the National Public Health Institute, A3/2008, 116 Pages ISBN 978-951-740-770-0; 978-951-740-771-7 (pdf-version)
ISSN 0359-3584; 1458-6290 (pdf-version) http://www.ktl.fi/portal/4043
ABSTRACT
In indoor environments, moisture damage and related microbial growth are associ-ated with adverse health effects. In this thesis, five studies were conducted to char-acterize how the microbial conditions in indoor environments are affected by the use of the building, by the presence of moisture damage, renovation of that damage, and time. A special focus was placed on the development of detection methods of an interesting bacterial genus, Streptomyces.
The effects of nutrients on the growth of streptomycetes were studied on 26 media. In addition, pH effects were examined with seven media. The pH range was 4.0 to 11.5 in intervals of 1.5 units. Glucose and tryptone allowed good growth of strepto-mycetes. The widely used tryptone yeast extract glucose (TYG) medium and tryp-tone soy agar (TSA) proved to be suitable media for the growth of streptomycetes isolated from indoor environments. The pH range for growth and sporulation was large, depended on nutrients, and was not a species-specific property.
Microbial concentrations were analyzed in eight school kitchens and compared with other parts of the schools. The airborne microbial concentrations in the kitchens were lower than those encountered in the other parts of the schools.
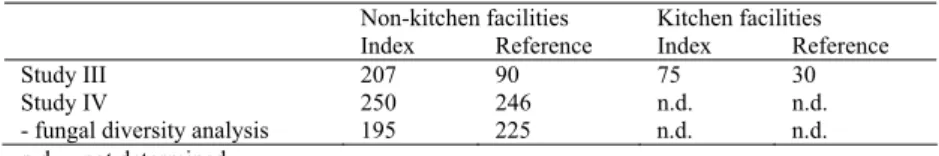
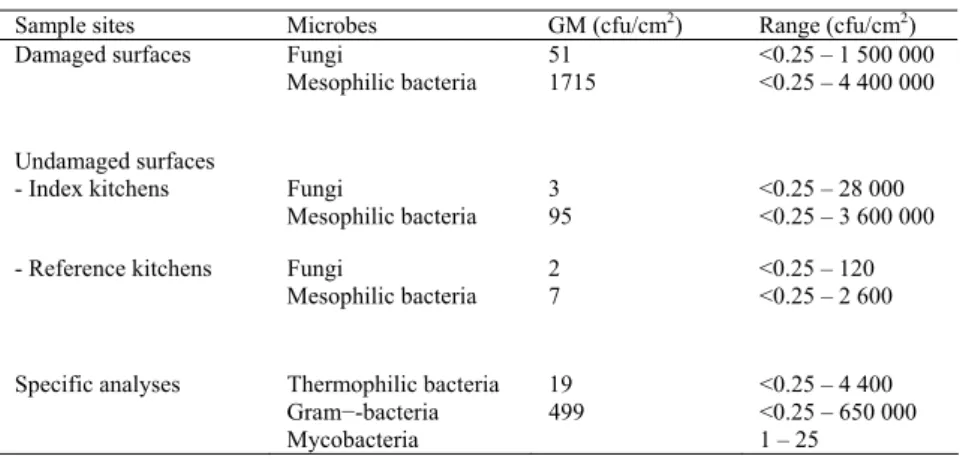
The effects of moisture damage on microbial flora in indoor environments were in-vestigated in eight schools including school kitchens by air and surface sampling, in two schools two years before renovation via air samples and in 81 homes with house dust samples. It was found that moisture damage elevated microbial concentrations. In the moisture-damaged schools (index schools, n=6), culturable airborne microbial concentrations were higher than in the reference schools (n=2) and this was also true for kitchen facilities. Microbial concentrations were higher on moisture-damaged surfaces, than on undamaged surfaces. In addition, high concentrations of microbes, especially bacteria, were detected from undamaged surfaces in moisture-damaged kitchens. Moisture damage also affected the diversity of mycobiota. In the index school, diversity was larger than in the reference school.
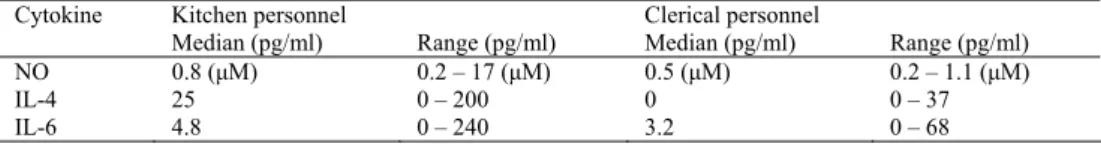
Symptom prevalence of occupants was enquired by questionnaires among kitchen and clerical personnel in eight schools and among pupils in two schools. The
expo-sure occurring in moisture-damaged schools was associated with a high prevalence of symptoms.
The effects of moisture damage renovation were studied by air sampling in two schools, one of which was undergoing renovation procedures and in addition, the pupils’ symptoms were asked with a questionnaire. Remediation measures decreased microbial concentrations in the index school. Although the culturable airborne con-centrations decreased in the first year after remediation, the mycobiota did not change. Only after thorough cleaning in the second year after remediation, did the microbial profile approach that found in the reference school. When repairs were underway, there were no differences between the schools in the symptom prevalence of children. After the remediation, prevalence of respiratory symptoms decreased in the index school.
The long-term variation in microbial concentrations was followed with air samples in five consecutive years in two schools. In the second study year, concentrations were higher than those measured in the other years. Long range microbial transport is possible also in wintertime and simultaneous outdoor air sampling may be needed to obtain a better perspective.
The usefulness of the newly developed qPCR method in assessing microbial condi-tions in two schools and 81 residences by means of house dust samples was investi-gated and also compared with the traditional culture method. QPCR proved to be a feasible method in analyzing microbial concentrations. Concentrations obtained were several orders of magnitude higher than those detected by culturing. Since non-viable spores and microbial fragments can also cause adverse health effects, qPCR may give a more accurate view of the microbial exposure and be more informative than conventional culturing.
Concentrations of several fungi in house dust analyzed by the quantitative poly-merase chain reaction (qPCR) method increased when the extent of moisture dam-age increased in the house.
Ulla Lignell, Mikrobikarakterisointi sisäympäristöissä Kansanterveyslaitoksen julkaisuja, A3/2008, 116 sivua ISBN 978-951-740-770-0; 978-951-740-771-7 (pdf-versio) ISSN 0359-3584; 1458-6290 (pdf-versio)
http://www.ktl.fi/portal/4043
TIIVISTELMÄ
Kosteusvaurioilla ja mikrobikasvulla on sisätiloissa esiintyessään yhteys terveyshait-toihin. Tässä väitöstutkimuksessa, joka koostuu viidestä osajulkaisusta, tutkittiin, kuinka sisätilojen mikrobistoon vaikuttavat rakennuksen käyttötarkoitus, kosteus-vauriot ja niiden korjaus ja vuosien välinen vaihtelu. Painopiste oli bakteereihin kuu-luvien streptomykeettien detektiomenetelmien kehittämisessä.
Ravinteiden vaikutusta streptomykeettien kasvuun tutkittiin 26 kasvualustalla. Glu-koosi ja tryptoni mahdollistivat streptomykeettien hyvän kasvun. Yleisesti käytössä olevat tryptoni-hiivauute-glukoosialusta (THG) ja tryptoni-soija-agar (TSA) olivat käyttökelpoisia kasvualustoja sisätiloista eristetyille streptomykeeteille. Lisäksi tut-kittiin pH:n vaikutusta seitsemällä alustalla. Tutkittu pH-alue oli välillä 4,0 – 11,5 1,5 yksikön välein. Kasvun ja itiöinnin pH-alue oli laaja ja se riippui ravinteista, muttei ollut lajikohtainen ominaisuus.
Mikrobipitoisuuksia mitattiin kahdeksassa koulukeittiössä ja pitoisuuksia verrattiin koulujen muiden tilojen pitoisuuksiin. Mikrobipitoisuudet keittiöiden sisäilmassa olivat pienempiä kuin koulujen muissa tiloissa.
Kosteusvaurioiden vaikutuksia mikrobistoon tutkittiin kahdeksassa koulussa ilma- ja pintanäytteiden avulla mukaan lukien koulujen keittiötilat, kahdessa koulussa kahte-na vuonkahte-na ennen kosteusvauriokorjauksia ilmanäytteiden avulla ja 81 asunnossa huonepölynäytteiden avulla. Kosteusvauriot kohottivat mikrobipitoisuuksia. Koste-usvaurioituneissa kouluissa ja keittiötiloissa mikrobipitoisuudet sisäilmassa olivat suurempia kuin vertailukouluissa ja -keittiöissä. Mikrobipitoisuudet olivat suurem-pia vauriopinnoilla kuin vertailupinnoilla. Kosteusvaurioituneissa keittiöissä myös muilla kuin varsinaisilla vauriopinnoilla havaittiin suuria mikrobipitoisuuksia, erityi-sesti bakteeripitoisuudet olivat korkeita. Kosteusvauriot vaikuttivat myös mikrobidi-versiteettiin siten, että sienisukuja havaittiin enemmän kosteusvaurioituneessa kuin vertailukoulussa.
Kyselylomakkeiden avulla selvitettiin sekä keittiö- että kansliahenkilökunnan oireita kahdeksassa koulussa ja oppilaiden oireita kahdessa koulussa. Kosteusvaurioituneis-sa kouluisKosteusvaurioituneis-sa oireilua oli enemmän.
Kosteusvaurioiden korjausten vaikutusta tutkittiin ilmanäytteiden avulla kahdessa koulussa, joista toisessa tehtiin kosteusvauriokorjauksia. Myös oppilaiden oireprofii-lit selvitettiin kyselyjen avulla. Korjaukset pienensivät mikrobipitoisuuksia. Mikro-bisuvusto normalisoitui vasta perusteellisen siivouksen jälkeen. Korjausten aikana oppilaiden oireprevalensseissa ei ollut eroja tutkittujen koulujen välillä. Korjausten jälkeen hengitystieoireet vähenivät korjatussa koulussa.
Mikrobipitoisuuksien vuosien välistä vaihtelua tutkittiin kahdessa koulussa viitenä peräkkäisenä vuonna otettujen ilmanäytteiden avulla. Toisena tutkittuna vuotena mikrobipitoisuudet olivat muita vuosia korkeammat. Myös talvisaikaan mikrobien kaukokulkeuma on mahdollista, joten ulkoilmanäytteiden ottoa voi tarvita.
Kahdesta koulusta ja 81 asunnosta otettuja huonepölynäytteitä tutkittiin qPCR- ja viljelymenetelmillä. QPCR-pitoisuudet olivat useita kertaluokkia korkeammat kuin viljelyllä saadut pitoisuudet. Koska myös ei-elinkykyiset itiöt ja mikrobifragmentit voivat aiheuttaa terveyshaittoja, qPCR-tekniikan avulla voidaan saada tarkempi ku-va mikrobialtistumisesta kuin perinteisellä viljelymenetelmällä.
Asunnon kosteusvaurioituneisuusasteen kasvaessa useiden kvantitatiivisella polyme-raasiketjureaktiolla (qPCR) mitattujen sieni-itiöiden pitoisuudet huonepölyssä kasvoivat.
CONTENTS
Abbreviations...10
List of original publications...12
1 Introduction ...14
2 Review of the literature ...16
2.1 MICROBES IN INDOOR ENVIRONMENTS...16
2.2 MOISTURE DAMAGE AND MICROBES...17
2.2.1 Microbial growth on building materials ... 18
2.2.2 Microbes in the indoor air of moisture-damaged buildings... 19
2.2.3 Effects of remediation on microbial indoor environment quality.... 20
2.3 SAMPLING OF INDOOR MICROBES...21
2.3.1 Air sampling ... 21
2.3.2 Surface sampling ... 24
2.3.3 Dust sampling... 25
2.3.4 Material sampling ... 28
2.3.5 Sampling for PCR... 28
2.3.6 Sampling aspects regarding the exposure assessment ... 29
2.4 DETECTION METHODS OF INDOOR MICROBES...29
2.4.1 Culture-based methods ... 30
2.4.2 Non-molecular methods detecting total counts of microbes... 31
2.4.3 Molecular methods in detection of indoor microbes ... 32
2.5 STREPTOMYCETES...36
2.5.1 Growth demands of streptomycetes... 36
2.5.2 Media for isolation ... 38
2.5.3 Occurrence of streptomycetes in indoor environments ... 39
2.6 MYCOBACTERIA...40
2.7 FUNGI IN INDOOR AIR...40
2.7.1 Airborne fungal concentrations ... 40
2.7.2 Airborne fungi in school environments ... 41
2.7.3 Fungal flora in the indoor air ... 41
2.7.4 Particle size of airborne fungi... 42
2.7.5 Guidelines for airborne fungal concentrations... 42
2.9 MICROBES ON SURFACES...43
2.10 MICROBES IN THE HOUSE DUST...44
2.10.1 Microbial concentrations in the house dust ... 44
2.10.2 Fungal flora in the house dust... 45
2.11 OTHER ASPECTS OF EXPOSURE TO BIOLOGICAL AGENTS...46
2.11.1 Inflammatory markers in nasal lavage fluid ... 46
2.11.2 Mites... 46
2.12 HEALTH EFFECTS OF MOISTURE DAMAGE AND MICROBES IN THE INDOOR ENVIRONMENT...47
2.13 MECHANISMS OF HEALTH EFFECTS...48
3 Aims of the study ...49
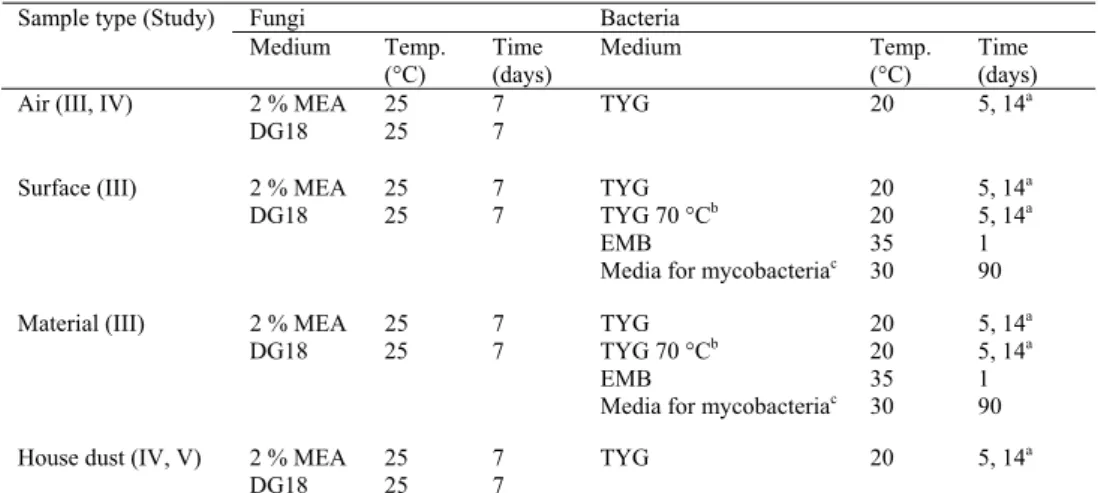
4 Materials and methods ...51
4.1 LABORATORY EXPERIMENTS...51 4.1.1 Streptomyces strains ... 51 4.1.2 Growth media ... 51 4.1.3 Visual assessment ... 52 4.1.4 Error estimations ... 52 4.2 FIELD STUDIES...52
4.2.1 The buildings studied ... 52
4.2.2 Growth media, incubation and fungal identification ... 53
4.2.3 Air samples... 53
4.2.4 Surface samples ... 54
4.2.5 House dust samples ... 54
4.2.6 Other samples ... 55
4.2.7 Study populations, nasal lavage and health questionnaires ... 56
4.2.8 Statistical methods... 56
5 Results...58
5.1 LABORATORY EXPERIMENTS...58
5.1.1 Effects of nutrients and pH on the growth of streptomycetes... 58
5.1.2 Error estimations ... 58
5.2 FIELD STUDIES...59
5.2.1 Concentrations, flora and particle size distributions of airborne viable fungi... 59
5.2.2 Concentrations of airborne bacteria... 60
5.2.4 Microbes in the house dust ... 61
5.2.5 Other samples ... 62
5.2.6 Symptom prevalence in the school environment ... 63
6 Discussion ...64
6.1 LABORATORY EXPERIMENTS...64
6.1.1 Effects of nutrients and pH on the growth of streptomycetes... 64
6.1.2 Error estimations ... 65
6.2 FIELD STUDIES...65
6.2.1 Concentrations, flora and particle size distributions of airborne viable fungi... 65
6.2.2 Concentrations of airborne bacteria... 67
6.2.3 Microbes on school kitchen surfaces ... 67
6.2.4 Microbes in the house dust ... 68
6.2.5 Other samples ... 69
6.2.6 Symptom prevalence in school environment... 70
7 Conclusions...71
8 Acknowledgements ...73
9 References...75 Appendix 1
10
ABBREVIATIONS
AGI all glass impinger
ATCC American Type Culture Collection
aw water activity
cfu colony forming unit
Ct cycle threshold
d50 cut-off size
DG18 dichloran 18% glycerol agar DNA deoxyribonucleic acid
DSMZ German Collection of Microorganisms and Cell Cultures ELISA enzyme-linked immunosorbent assay
EMB eosin methylene blue agar EPS extracellular polysaccharide FSSST fungal spore source strength tester
GM geometric mean
HBSS Hank’s balanced salt solution
HDM house dust mite
HT Hickey-Tresner
IAQ indoor air quality
IFN interferon
Ig immunoglobulin
IL interleukin
I/O indoor/outdoor
LAL Limulus amoebocyte lysate assay
LPS lipopolysaccharide
11
MVOC microbial volatile organic compound
NAL nasal lavage
NO nitric oxide
PAN-PCR particle-associated nucleic acid PCR PCR polymerase chain reaction
P-FLEC particle-field and laboratory emission cell qPCR quantitative PCR
RAPD random amplified polymorphic DNA RAST radio allergo-sorbent test
RCS Reuter centrifugal sampler
rDNA ribosomal DNA
RFLP restriction fragment length polymorphism
RH relative humidity
RODAC replicate organism detection and counting rRNA ribosomal ribonucleic acid
RT-PCR reverse transcription-PCR
SAS surface air system
SBS sick building syndrome
SD standard deviation
Th T helper
TNF tumor necrosis factor
TSA tryptone soy agar
12
LIST OF ORIGINAL PUBLICATIONS
This thesis is based on the following original articles referred to in the text by their Roman numerals:
I Suutari M, Lignell U, Hyvärinen A, Nevalainen A. Media for cultivation of indoor streptomycetes. Journal of Microbiological Methods 2002, 51: 411-416.
II Kontro M, Lignell U, Hirvonen M-R, Nevalainen A. pH effects on 10 Streptomyces spp. growth and sporulation depend on nutrients. Letters in Applied Microbiology 2005, 41(1):32-38.
III Lignell U, Meklin T, Putus T, Vepsäläinen A, Roponen M, Torvinen E, Reeslev M, Pennanen S, Hirvonen M-R, Kalliokoski P, Nevalainen A. Microbial exposure, symptoms and inflammatory mediators in nasal lav-age fluid of kitchen and clerical personnel in schools. International Journal of Occupational Medicine and Environmental Health 2005, 18(2):139-150.
IV Lignell U, Meklin T, Putus T, Rintala H, Vepsäläinen A, Kalliokoski P, Nevalainen A. Effects of moisture damage and renovation on microbial conditions and pupils’ health in two schools – a longitudinal analysis of five years. Journal of Environmental Monitoring 2007, 9(3): 225 – 233. Article was selected to be highlighted in “Chemical Science” 2007, 4(3):C20 and was selected for inclusion in “Chemical Biology” virtual journal.
V Lignell U, Meklin T, Rintala H, Hyvärinen A, Vepsäläinen A, Pekkanen J, Nevalainen A. Evaluation of quantitative PCR method for detection of house dust fungi and streptomycetes in relation to moisture damage of the house and comparison with culture. Submitted.
14
1
INTRODUCTION
Good indoor air quality (IAQ) is important for all of us; most people spend 90 % or more of their time indoors (Schwab et al., 1992). Most of this time consists of the hours spent at home or at work, but for example, school age children spend 20 % of their time in schools (Clench-Aas et al., 1999). Good IAQ consists of many aspects; it is an interaction of a functioning and efficient ventilation and the lowest achiev-able amounts of chemical, inorganic or organic, and microbial compounds which should not evoke symptoms in the occupants (Spengler et al., 2001).
Moisture damage and microbial growth indoors are associated with adverse health effects among the occupants (Bornehag et al., 2001; Bornehag et al., 2004). Damp-ness or moisture damage is a common problem in buildings all over the world. In Finland, 70 % of day care centers have signs of moisture problems (Ruotsalainen et al., 1993), as well as 55 % of homes (Nevalainen et al., 1998) and 53 % of schools (Kurnitski et al., 1996). High moisture load in a building can also be found in re-peatedly damp facilities, such as institutional kitchens. This may lead to microbial growth on surfaces and structures. There are, however, few studies, which have evaluated microbial conditions in these kinds of facilities.
When building or surface materials become wet due to moisture damage, it is only a matter of time before microbes will start to grow. In fact, moisture is often the growth-limiting factor for microbes, since the other critical factors such as nutrients and suitable temperatures are usually fulfilled (Pasanen et al., 1992a). Microbial growth refers to the growth of fungi, bacteria and other microorganisms. Even though most of the studies in literature have focussed on fungi, bacteria should also be considered in indoor environments. Especially, the presence of actinomycetes has been connected to moisture damage (Nevalainen et al., 1991). Actinomycetes have been extensively studied in different environments (Kutzner, 1986), though seldom in indoor environments.
There are many methods available for detecting microbes in the indoor environment. They can be sampled from air, surfaces, materials, and dust and subsequently de-tected by culturing, molecular methods or by using chemical markers. The use of several sampling methods enables a more thorough microbial characterization than can be achieved with one method alone. For instance, surface sampling is recom-mended in addition to air sampling to detect fungi in indoor environments (van Re-enen-Hoekstra et al., 1991).
It is well known that indoor microbial concentrations are not stable over time, but they are affected by many factors, such as outdoor air concentrations, season, and
15
time of day (de Ana et al., 2006; Lin & Li, 1996; Reponen et al., 1992). However, the year-to-year variation in indoor environments is not well understood, although fluctuations in outdoor spore concentrations have been extensively studied (Mullins, 2001). Culturing is the conventional method for microbial characterization, although it underestimates total microbial concentrations (Amann et al., 1995). Molecular methods allow detecting non-culturable and non-viable microbes. This is important since even non-viable microbes may still be able to cause adverse health effects (Hirvonen et al., 1997b).
While the association between moisture and mold damage of the building and ad-verse health effects of its occupants is well documented, the causal phenomena are still unclear. There is a clear gap in our understanding of how the exposure actually evokes the symptoms (IOM, 2004). Therefore, more studies are needed to improve our knowledge on the microbial ecology of buildings and the qualitative and quanti-tative aspects of exposure assessment in the occupants.
16
2
REVIEW OF THE LITERATURE
2.1
Microbes in indoor environments
Environmental microbes, i.e., fungi and bacteria, are ubiquitous being found in both natural and man-made habitats. In indoor environments, the main source for mi-crobes is usually the outdoor air (Shelton et al., 2002; Su et al., 2001). Mimi-crobes are able to travel long distances from their sources. For example, atmospheric transport of fungal and bacterial spores can occur in clouds of desert dust spreading the mi-crobes from Africa and Asia to Europe and the Americas. Spores can also survive for the 5 to 7 days needed for transatlantic transport from Africa to the USA. Usu-ally bacteria have been dominating in such dust events, but about 20 fungal genera have also been identified (Shinn et al., 2003).
Outdoor microbial concentrations vary according to the season and time of day, and these variations are also reflected in indoor air. The highest concentrations are usu-ally detected in summer (Bartlett et al., 2004a; Bartlett et al., 2004b; de Ana et al., 2006; Dharmage et al., 2002; Lee & Jo, 2006; Lin & Li, 1996; Medrela-Kuder, 2003; Ren et al., 1999; Reponen et al., 1992). Climate greatly affects airborne fungal concentrations both outdoors and indoors. In cold climates outdoor and indoor con-centrations are typically low during the wintertime when there is snow cover on the ground (Reponen et al., 1992).
In addition to outdoor sources, microbes indoors can originate from indoor sources. These can be the occupants themselves and their activities, as well as indoor plants (Lehtonen et al., 1993). Other factors influencing the microbial population include building maintenance, cleanliness, indoor temperature and relative humidity (RH), type of furniture, and carpeting (Dharmage et al., 1999; Levetin, 1995; Reynolds et al., 1990; Smedje & Norbäck, 2001). Microbes may also drift indoors on the clothes of the occupants or in the fur of pets (Lehtonen et al., 1993).
The type of ventilation affects microbial concentrations in indoor environments. Mechanical ventilation is more efficient than natural ventilation in filtering particles from the intake air and in removing pollutants. This difference is also reflected in microbial concentrations, which in naturally ventilated buildings can be 2 – 7 times higher than in buildings with mechanical ventilation (Parat et al., 1997; Wålinder et al., 1997). There are also differences between mechanical ventilation systems: with a mechanical exhaust or fan coil unit system, microbial concentrations were reported to be higher than where there was a mechanical supply and exhaust system or an
air-17
handling unit (Reponen et al., 1992; Wu et al., 2005). This is probably due to more effective filtering of the intake air.
Fungi may also originate from contamination in special building strucrures, e.g. the crawl space (Airaksinen et al., 2004). Fungi are distributed in the building due to an under-pressure inside the building caused by mechanical ventilation, which is a normal situation in cold climates.
In general, indoor concentrations of fungi are qualitatively similar and quantitatively lower than those in the ambient air, i.e., indoor/outdoor (I/O) fungal concentration ratios are < 1. This is mainly because of ventilation removing particles including fungal spores from the supply air as well as sedimentation processes. Particle re-moval may take place through filtering in the mechanical ventilation, or through the filtering effect of the building envelope in natural ventilation. However, in cold cli-mates when there is snow cover on the ground and low outdoor concentrations, the indoor concentrations of fungi are often higher than outdoors pointing to the pres-ence of indoor sources (Reponen et al., 1992). The season and climate must be taken into account when interpreting the I/O ratios (Rogers, 2003) or other fungal data. Furthermore, fungi undergo diurnal rhythms to optimize timing of spore release and to ensure spore dispersal (Rogers, 2003). The spore release may be discontinuous and can be affected by the air velocity (Pasanen et al., 1991). There are also differ-ences in the spore release characteristics between different fungi (Kildesø et al., 2003).
In the indoor air, microbes come and go, which is a natural phenomenon. Ventilation and cleaning are the usual removal processes of microbes in indoor environments. However, microbes may also grow indoors in building materials and structures. In such a situation, they may be responsible for different harmful effects. They can damage building structures by discoloring and degrading building materials, as well as causing negative aesthetic effects such as dirty appearance and unpleasant odors (Portnoy et al., 2005). Undoubtedly, the main concern about microbial growth in indoor environments is related to the strong link to the adverse health effects in the occupants (Douwes & Pearce, 2003; Li & Yang, 2004). There is a need to further characterize microbes in different indoor environments and their temporal fluctua-tion to achieve a more accurate exposure assessment of occupants.
2.2
Moisture damage and microbes
Moisture damage in buildings is closely related to the microbial growth, so-called mold growth. The primary factor controlling microbial growth indoors is the
avail-18
ability of water, although the characteristics of materials in question play also a role (Grant et al., 1989).
2.2.1
Microbial growth on building materials
Water can penetrate into materials due to many reasons such as water leakage and condensation. In the presence of water, subsequent microbial growth in the materials will occur almost certainly. Growth rate is, however, dependent on, e.g., temperature and the availability of nutrients. Under optimal conditions, a few days may be suffi-cient for detectable growth (Pasanen et al., 1992a). Especially in cold climates dur-ing wintertime, condensation of water on cold surfaces is a problematic phenomenon and can lead to microbial growth even within the wall structures (Pessi et al., 2002). Subsequently, spores from this kind of hidden microbial growth can gain access to the indoor air through cavities in structures (Morey et al., 2003).
Fungi have species-specific demands for moisture conditions to allow them to ger-minate and grow on materials (Pasanen et al., 2000b). RH of air controls fungal growth only indirectly, for example high humidity, over 85 % RH, can moisten ma-terials and may lead to fungal growth (Burge, 2002; Pasanen et al., 2000a). The moisture content of the material available for microbial growth is expressed as water activity (aw), which is the ratio of the vapor pressure exerted by water in the material
to the vapor pressure of pure water at the same temperature and pressure which cor-responds to the RH on the material under equilibration conditions. The lowest value necessary to initiate microbial growth is aw 0.65 (Górny, 2004). Microbes can be
classified as primary, secondary or tertiary colonizers by the aw values needed for
their growth. Most fungi and bacteria relevant in indoor environments require aw
values of 0.8. Temperature and availability of nutrients influence the ability of microbes to grow at given aw values. Higher aw values are required for growth at
suboptimal temperature and nutrient limitations (Grant et al., 1989).
In moist building materials, a relatively small number of fungal genera grow com-monly. Available water and characteristics of the substrate are two of the main regu-lating factors. In material samples, Penicillium spp., Aspergillus spp., Acremonium
spp., Phoma spp., Cladosporium spp., Chaetomium spp., and Stachybotrys spp. be-long to most frequently found fungal genera (Andersson et al., 1997; Ellringer et al., 2000; Gravesen et al., 1999; Hyvärinen et al., 2002). Bacteria growing on building materials have been studied much less than fungi. A few studies have reported the detection of actinomycetes, mycobacteria, and gram-negative bacteria (Andersson et al., 1997; Hyvärinen et al., 2002; Torvinen et al., 2006).
19
Microbes may produce secondary metabolites when growing on building materials. These metabolites include non-volatile allergens, mycotoxins and microbial volatile organic compounds (MVOCs). Fungal allergens may cause allergic reactions in sen-sitized individuals. For some fungi, such as Alternaria alternata, Cladosporium her-barum, Aspergillus fumigatus, Stachybotrys chartarum, and Penicillium spp., main allergens have been characterized (Achatz et al., 1995; Hemmann et al., 1999; Raunio et al., 2001; Shen et al., 1996). Filamentous fungi are able to produce over 300 mycotoxins (Gutarowska & Piotrowska, 2007). The toxin production is stimu-lated by changes in the environment. Mycotoxins have been detected in air, surface, dust, and material samples from moldy dwellings (Brasel et al., 2005b; Charpin-Kadouch et al., 2006; Engelhart et al., 2002; Tuomi et al., 2000). Toxins can have carcinogenic, immunotoxic, cytotoxic, neurotoxic, mutagenic and teratogenic effects (Gutarowska & Piotrowska, 2007). After becoming airborne, such as when being carried by spores or fungal fragments, toxins can be transported efficiently to tissues via inhalation in the respiratory tract (Gutarowska & Piotrowska, 2007). MVOCs include low molecular weight alcohols, aldehydes, and ketones (Mazur & Kim, 2006). They are associated with fungal as well as streptomycete contamination (Schöller et al., 2002). There are studies supporting (Elke et al., 1999) and refuting (Nilsson et al., 2004) the usefulness of MVOCs as indicators of moisture damage in indoor environments. This is mainly because the specificity of origin of MVOCs to microbes is unclear, as MVOCs may originate from sources other than microbes (Pasanen et al., 1998).
2.2.2
Microbes in the indoor air of moisture-damaged buildings
Microbial growth on moisture-damaged materials may result in the release of mi-crobes into the indoor air (Pasanen et al., 1991). Thus, moisture- or water-damaged, damp buildings may develop microbial indoor air problems. Some of the airborne microbes will eventually become settled on various surfaces with other particles pre-sent in the indoor air. Microbes can be resuspended from this so called settled dust and become airborne again (Hunter et al., 1988).
Fungal composition is different if one compares moldy and reference buildings. This has been demonstrated for homes and schools (Meklin et al., 2005; Pasanen, 1992; Strachan et al., 1990; Vesper et al., 2006b). The species diversity can be higher in damp homes/schools than in controls, and some species or genera can be found at elevated concentrations, such as Aspergillus versicolor, Cladosporium spp., Fusa-rium spp., Ulocladium spp., Bacillus mycoides, Mucor spp., Exophiala spp., Stachy-botrys spp., and Tritirachium spp. (Garrett et al., 1998; Hyvärinen, 2002; Meklin et al., 2002a; Meklin et al., 2003; Meklin et al., 2005; Nilsson et al., 2004). Many
stud-20
ies examining the indoor air and materials have demonstrated that certain microbes are suggested to be indicative of moisture damage. This means that they do not be-long to the mycobiota normally found in buildings, but their presence occurs in as-sociation with dampness or moisture damage. There is consensus about the indicator status for certain fungi including Aspergillus versicolor and Stachybotrys spp.. For many fungi, however, there is much more limited evidence for their possible mois-ture damage indicative status. (Flannigan & Morey, 1996; Hyvärinen, 2002; Lappa-lainen et al., 2001; Mahooti-Brooks et al., 2004; Meklin, 2002; Samson et al., 1994) The effect of moisture damage on total or viable microbial concentrations in the in-door air or on settled dust is still controversial. Fungal concentrations have often been higher in moldy homes than in the reference homes (Hunter et al., 1988; O'Connor et al., 2004; Waegemaekers et al., 1989; Vesper et al., 2006b) at least in winter (Reponen et al., 1994). However, differences are not always detected (Meklin et al., 2004; Müller et al., 2002; Nevalainen et al., 1991; Nilsson et al., 2004). This may be due to variations in the definitions of moisture and mold damage, the type of moisture damage and to the spatial and temporal variation in indoor concentrations. Moisture damage can also affect the particle size distribution of indoor fungi. Dif-ferences between moldy or moisture-damaged and reference buildings have been detected mostly in the size range of 1.1 – 4.7 μm (Hyvärinen et al., 2001a; Meklin et al., 2002b; Reponen et al., 1994).
In water-damaged schools in Scandinavia, concentrations of airborne fungi have generally been low (Dotterud et al., 1995; Lappalainen et al., 2001; Meklin et al., 2003). However, concentrations can be elevated in the vicinity of damaged areas (Lappalainen et al., 2001). Concentrations of airborne (13)--D-glucan, a fungal marker, in a school with mold problems were also higher than in a control school (Rylander et al., 1998). In the indoor air of moisture-damaged schools and day care centers (n=9), viable bacterial concentrations, mainly bacilli and mesophilic actino-mycetes including Streptomyces spp., have been 102-103 colony forming units (cfu) per cubic meter of air (Andersson et al., 1999). In non-problem schools (n=39), geometric mean (GM) bacterial concentration, mainly micrococci, was 102 cfu/m3 (Bartlett et al., 2004b).
2.2.3
Effects of remediation on microbial indoor environment quality
Dampness and water damage in buildings have been shown to be important risk fac-tors for the adverse health outcomes in epidemiological studies (IOM, 2004). Thus, remediation is needed to eliminate the harmful exposures (IOM, 2004). Remediation measures have been shown to affect the diversity of mycobiota in the indoor air. During remediation of moisture-damaged buildings, more fungal types and
slow-21
growing mycobacteria have been detected than before the renovation (Hameed et al., 2004; Rautiala et al., 2004). Furthermore, an increase in the concentrations of As-pergillus spp., or Stachybotrys chartarum (Mahieu et al., 2000; Vesper et al., 2000) and the overall fungal concentration have been observed (Overberger et al., 1995; Rautiala et al., 1996; Rautiala et al., 1998).
The aim of the remediation measures is to reach background microbial concentra-tions after completion of the remediation process. Airborne fungal concentraconcentra-tions have decreased after remediation in homes, offices, schools and hotel (Barnes et al., 2007; Cooley et al., 1998; Ellringer et al., 2000; Reynolds et al., 1990; Vesper et al., 2000). In successfully remediated buildings, fungal concentrations were lower than in non-complaint portions of the buildings or in reference buildings, but the differ-ence was minor or not found if the remediation was unsuccessful or only partially carried out (Kleinheinz et al., 2006; Kokotti et al., 1999; Meklin et al., 2005). After remediation, fungal concentrations were also lower on undamaged surfaces than before remediation (Ellringer et al., 2000). The effect of cleaning on microbial con-centrations has also been shown. Microbial concon-centrations decreased after thorough remediation and cleaning procedures in a moisture-damaged building (Ebbehøj et al., 2002).
2.3
Sampling of indoor microbes
Sampling methods are needed to quantify and describe the microbial populations in indoor environments. Microbes can be sampled from air, surfaces, dust, and materi-als. Since there is no technique that would cover all aspects of environmental sam-pling, the methods need to be selected according to the needs of the investigation.
2.3.1
Air sampling
In general, air is an extreme and oligotrophic environment for microbes, e.g., if compared to soil (Peccia & Hernandez, 2006). This means that special features must be taken into the account in the air sampling. Differences in the aerodynamic diame-ter of particles can affect the collection efficiencies of air samplers. Furthermore, sampling stress can reduce the viability and/or culturability of many microbes (Stewart et al., 1995). Short sampling times are a common problem in air sampling. The representativeness of sampling decreases and variability between side-by-side samples increases with decreasing sampling time (Godish & Godish, 2006; Verhoeff & Burge, 1997). In one study, however, the sampling duration had no effect on fun-gal concentrations but a trend of decreasing concentrations was detected for bacteria as the sampling duration increased (Godish & Godish, 2006). Long sampling
peri-22
ods may lead to low sampling efficiencies due to desiccation effects (Toivola et al., 2004). The limit of detection and the upper limit of range are also important aspects that need to be taken into account by controlling the sampling time (Nevalainen et al., 1992).
Air samplers are based on different physical principles and they can be designed for the detection of culturable or non-culturable microbes. Sampling methods for air-borne particles can be subdivided into passive samplers using natural aerosol con-vection, diffusion or gravity, and active samplers using stationary or personal pumps (An et al., 2004). The stationary sampling is the most widely used method for con-ducting microbial measurements in indoor environments. In addition, personal sam-pling has been used especially to characterize exposures during the remediation (Rautiala et al., 1996) or to analyze total individual exposure to microbes (Toivola et al., 2004). Recently, cyclone personal samplers enabling particle size fractioning have been developed which collect bioaerosols into microcentrifuge tubes (Lindsley et al., 2006). Subsequently, these samples can be readily analyzed by, e.g., poly-merase chain reaction (PCR) and immunoassays. There are several major reviews on bioaerosol samplers (Eduard & Heederik, 1998; Portnoy et al., 2004; Reponen et al., 2001). There is a large variety in their types and suitability for different needs of field sampling, but none of these samplers can be considered as representing a refer-ence method (Reponen et al., 2001). An important characteristic for the physical sampling efficiency is the cut-off size (d50) above which 50 % or more of the
parti-cles are collected. The results obtained with different devices are not easily compa-rable with each other due to differences in sampling times, volumes and principles. Table 1 presents some of the commonly used sampler types and their characteristics from various sampling issues point of view.
Table 1. Type of samplers for airborne fungi.
Principle / Type of sampler Example of device Advantages Limitations
Impaction A
Impaction on agar media / cultur-able spore samplers
- determination of culturable organisms - species determination
- no sample treatment after sampling - large reference data for cultivation results
- negative result inconclusive - not for non-culturable particles - selection of culture medium - short sampling times - time consuming
- slow growing species will be underestimated - clumps of organisms appear as single colonies - counting is difficult in highly contaminated situations - slit samplers Mattson-Garvin
- hole impact onto agar Andersen 1 stage impactor
- multistage hole impact onto agar Andersen 2 or 6 stage impactor, SAS - particle size distribution
Impaction B
slit impact onto coated slide / total spore traps
Allergenco MK-3, Burkard 24 h sam-pler
- total spore enumerations - larger sample volume - easy counting - fast
- no species determination
- no determination of culturable organisms
Impingers
Impaction into liquid
AGI-30, BioSampler - for high concentrations
- culture, total counts, biochemical analyses or im-munoassays
- extended sampling time - no upper detection limit
- fungi may impinge with low efficiency
Centrifugal acceleration / cen-trifugal samplers
RCS, aerojet cyclone - culture, total counts, biochemical analyses or im-munoassays
Filtration / filter cassette perma-nent or disposable
Sartorius MD8 - culture, total counts biochemical analyses, immu-noassays or by PCR after sampling
- for high concentrations
- loss of viability
- desiccation of bacterial cells Button Sampler - stationary and personal sampling
- sampling efficiency 4 l/min like inhalation curve - low sensitivity to wind direction
high 99 % collection efficiency - also for large particles - long term sampling
Natural electrostatics Electrosampler -low velocity maintain biological and physical in-tegrity of microbes
AGI=all glass impinger, RCS=Reuter centrifugal sampler, SAS = surface air system
(An et al., 2004; Blomquist, 1994; Burton et al., 2007; Buttner et al., 1997; Eduard & Heederik, 1998; Engelhart & Exner, 2002; Fabian et al., 2005; Grinshpun et al., 1998; Horner, 2003; Lee et al., 2004b; Moschandreas et al., 1996; Osborne et al., 2006; Pasanen, 2001; Portnoy et al., 2004; Reponen et al., 2001; Stetzenbach et al., 2004; Verhoeff & Burge, 1997; Yao & Mainelis, 2006)
24
For air sampling, it should be noted that a single sample is usually not sufficient to provide a satisfactory conclusion about microbial conditions in a specific indoor environment since there are spatial and temporal variations in microbial concentra-tions. Therefore, several samples should be taken. According to a proposal for resi-dences, a sampling campaign should consist of 11 different sampling days in two rooms if one aims to obtain a long time average concentration of the home (Hy-värinen et al., 2001b). Since the outdoor air is an important source of indoor mi-crobes, outdoor air samples should also be collected for comparison (Mazur & Kim, 2006).
2.3.2
Surface sampling
Microbial concentrations and mycobiota on surfaces may differ from those in the indoor air. Therefore, results obtained from surface sampling cannot directly be as-sociated with the exposure to airborne microbes (Niemeier et al., 2006). Surface sampling is, however, one way to determine whether there is a problem and if so, to locate the source of the biocontamination. In fact, surface sampling is recommended as a supplement to air sampling as a way of detecting fungi in indoor environments (van Reenen-Hoekstra et al., 1991).
A common technique for surface sampling is the tape-lift, where a clear cellophane tape (cellotape) is placed onto the suspected area, stained, and placed on a micro-scope slide (Portnoy et al., 2004; van Reenen-Hoekstra et al., 1991). The presence of spores and mycelia can be estimated semiquantitatively and a few fungal genera, e.g., Stachybotrys or groups of genera, e.g., Aspergillus and Penicillium may be identified by their spore type. The presence of mycelia is an important indication of active growth on the surface. However, the identification is quite limited due to similarities of some spores the uncertainty of collecting characteristic conidiophores or other growth structures that aid in identification.
Surface samples can also be taken from a certain area by a cotton swab or plastic loop into stabilization media with subsequent cultivation on agar media (Beguin & Nolard, 1994; Cooley et al., 1998; Portnoy et al., 2004; van Reenen-Hoekstra et al., 1991). Using this method, concentrations expressed as cfu/cm2 can be determined. To improve the recovery efficiency, sonication has been used in the rayon swab sur-face sampling for the small area sampling (10-25 cm2) with high microbial concen-trations (Brown et al., 2007). Results obtained by the sponge swipe method have been comparable with those obtained using the swab kit method (Buttner et al., 2001), although the swab has also been more efficient than the sponge (Buttner et al., 2007). For large sampling areas (1 m2), a sampling method called the BIsKIT biological sampling kit can be used (Buttner et al., 2004b). Surfaces can also be
25
sampled by a method called “replicating organism detection and counting” (RODAC). It is a direct agar contact plate, which is commonly used in the hospital infection control (Stetzenbach et al., 2004). The adenosine triphosphate biolumines-cence method has been developed to monitor surface cleanliness in, e.g., kitchens (Aycicek et al., 2006; Griffith et al., 2000).
Air turbulence increases the spore release from rough surfaces such as ceiling tiles. As an alternative to the conventional air or surface sampling, the spore release rate can be measured with specifically developed devices (Górny et al., 2001). Portable aerosolization chambers such as the “fungal spore source strength tester” (FSSST) (Sivasubramani et al., 2004) or “particle field and laboratory emission cell” (P-FLEC) (Kildesø et al., 2003) can be used. In these chambers, aerosolized spores from a fungal source are immediately collected into an air sampler. In comparison with the swab method and air sampling, it seemed that FSSST could be a feasible method to detect a mold source (Niemeier et al., 2006).
2.3.3
Dust sampling
House dust is a mixture of many kinds of substances, not simply microorganisms (Macher, 2001b; Portnoy et al., 2004). There are variations in the definitions of dust. In this thesis, house dust refers to the settled dust, not to airborne particles, which can be collected onto filters from the indoor air. It has been hypothesized that mi-crobial measurements of dust reflect the accumulated mimi-crobial load over a period of time longer than can be obtained using air samples (Flannigan, 1997; Portnoy et al., 2004). Thus, the evaluation of long-term exposure is possible, although the stability of microbes in dust over time is a matter of debate (Verhoeff et al., 1994). However, only a part of the resuspended dust particles are of respirable size (Flannigan et al., 1994) and thus, they do not exactly reflect inhalation exposure.
House dust samples are usually collected by vacuuming. Samples can be analyzed by culturing for culturable microbes, by chemical methods or by bioassays for er-gosterol, endotoxin, glucans or allergens, or by quantitative PCR (qPCR) for micro-bial DNA. Table 2 presents different vacuuming methods used for detecting cultur-able microbes in house dust and the obtained microbial concentrations. The litera-ture on this topic is somewhat confusing due to variations in sampling times, areas and sample treatments. Before there can be a valid comparison of results, a har-monization of methods would be needed. In most of the studies, dust samples are collected during site visits by research personnel. A simpler way to obtain samples would be to ask the study participants to take the samples by themselves, e.g., by vacuuming into specifically developed socks using their own vacuum cleaner. The levels of allergens and microbial agents obtained with these two techniques have
Table 2. Summary of studies detecting culturable microbes in vacuumed house dust.
Location No. of samples per study
Vacuuming method and culture media Fungal concentration (cfu/g) Main observation Study
living room floor, carpet
6-767 - onto different kinds of filters or into clean dust collection bag
- 0.70 - 4 m2, for 1 – 10 min, not mentioned
(1 study)
- ALK nozzle, not always - sieving (2 studies)
- Martin’s Rose Bengal Agar, MEA, DG18, cellulose agar, TSA for bacteria
range 1.0×10³-6.6×10⁷
GMs 6×10⁴-3×10⁵
41 different fungi
most frequent genera Penicil-lium, Aspergillus, Cladospo-rium
for mesophilic bacteria over-all mean 7.8-8.3×10⁶
for thermophilic bacteria overall mean 1.3-1.9×10⁴
- highest concentrations in living room
- associations of fungal concentrations with irritation, chest illness, moldy odors
- background levels - seasonal variation
- cultured concentrations 2 to 3 orders of magnitude lower than by qPCR
- highest correlation estimate between culture and qPCR 0.437
- toxic sterigmatocystin occasionally in house dust in moldy dwellings 4,5,7,8,9,10, 11,13,14,16, 18,20*,21,32 bedroom floor, carpet
25-419 - canister vacuum cleaner - onto different kinds of filters - 1 - 4 m2, for 1 - 5 min
- ALK nozzle, not always - dilution, not always - MEA, DG18
range 5×10³-7×10⁷
median or GM 9×10³-7×10⁴
- weak association of dustborne fungi with airborne fungi
- concentration of Aspergillus fumigatus increases after insulated windows and central heating are installed - no association of fungal concentrations with allergic history or respiratory symptoms
- increased risk for lower respiratory illnesses with high prevalence of genera
4,6,9,15,17,2 2,30,31
mattress 25-377 - onto paper or cellulose filters - 1 m2 ,1- 5 min
- dilution, not always - MEA, DG18
median or GM 7×10³-3×10⁴ - peak of fungal concentrations in winter
- concentration of Aspergillus fumigatus increases after insulated windows and central heating are installed - no association of fungal concentrations with allergic history or respiratory symptoms
3,9,15,17,31
furniture 11-356 - cellulose ester filter or polyethylene filter socks
- 0.09- >1 m2, 3-5 min
- homogenizing, not always - dilution, not always - MEA, DG18, cellulose agar
GM 6×10⁴-2×10⁵
Mucor, Wallemia sebi and
Alternaria prevalent
- genera differ from those in air samples 14,24,27
school, floor
9-72 - HVS-3 sampler, microvacuuming - onto cloth or MCE filters - 2 m2 - 1 ft2, 1 - 4 min
- dilution or settled dust on horizontal sur-faces
- DG18
range 2×10²-8×10⁴
for bacteria range 104-106
- correlation between inflammatory potency and fungal concentrations in floor dust
- lowest fungal concentrations in schools
- fungal concentrations two-fold increased in damaged areas
- no difference between damaged and control schools in fungal concentrations
- seasonal variation
1,2,4,19,25, 26
other 12-356 - HVS-3 sampler, microvacuuming - onto different filters, polyethylene filter sock or filterbag (HEPA)
- 98 cm2 – 500 m2, 5 sec – 5 min
- dilution, homogenizing not always - dust from vacuum bags (2 studies) - MEA, DG18, cellulose agar
range 5×10³-7×10⁷
median 15-1×10⁴, 85-2×10⁴
cfu/100 cm2
for bacteria (Micrococci,
Bacillus, gram-neg.) range 3.4×10⁶ -7×10³
for actinomycetes mean 4000
- qualitative properties of dust associated with sick building syndrome
- no association of fungal concentrations between air and dust samples
- increased fungal concentrations when potential for water intrusion increases
4,12,23, 24,28,29
* residential carpets
1(Allermann et al., 2006), 2(Andersson et al., 1999), 3(Beguin, 1995), 4(Beguin & Nolard, 1996), 5(Chew et al., 2001), 6(Chew et al., 2003), 7(Dales et al., 1999), 8(Dales et al., 1997), 9(Douwes et al., 1998), 10(Engelhart et al., 2002), 11(Gehring et al., 2001), 12(Gyntelberg et al., 1994), 13(Heinrich et al., 2003), 14(Hicks et al.,
2005), 15(Hirsch et al., 2000), 16(Horner et al., 2004), 17(Jovanovic et al., 2004), 18(Koch et al., 2000), 19(Lappalainen et al., 2001), 20(Macher, 2001a), 21(Meklin et
al., 2004), 22(Müller et al., 2002), 23(Niemeier et al., 2006), 24(Park et al., 2006), 25(Piecková & Wilkins, 2004), 26(Ramachandran et al., 2005), 27(Ren et al., 1999), 28
(Rintala et al., 2004), 29(Spurgeon, 2003), 30(Stark et al., 2003), 31(Verhoeff et al., 1994), 32(Vesper et al., 2006b)
28
been shown to correlate moderately or well (Schram-Bijkerk et al., 2006). The easi-est way to obtain dust samples is to collect homeowners’ vacuum bags (Vesper et al., 2007). More homogenous subsamples from vacuumed dust can be obtained by discarding coarse material such as hair, small toys, and stones or by sieving the dust sample (Butte & Heinzow, 2002; Vesper et al., 2007). However, analytical results may vary after sieving and are not comparable to dust analysis without sieving. Vor-texing with glass beads can be used in order to increase microbial yields from dust samples (Macher, 2001a). Airborne dust can be collected passively by allowing sedimentation for long periods of time. A device called a dustfall collector has been used for estimations of airborne culturable fungi (Würtz et al., 2005).
House dust samples are often stored until analysis. It was reported that storage of house dust at the room temperature or refrigerator for 25 days had no effect on con-centrations of culturable fungi or bacteria (Macher, 2001a). Furthermore, the storage at -20 °C for 10 months had no effect on the mite allergen, endotoxin, and (13)-glucan levels, but a loss in cat allergen levels was noted (Fahlbusch et al., 2003).
2.3.4
Material sampling
Bulk samples include pieces of material taken usually from surfaces with suspected microbial growth. Often the results have been expressed as concentrations of cultur-able microbes per gram of material (cfu/g) (Ellringer et al., 2000; Hyvärinen et al., 2002). Material samples give a good picture of microbial growth occurring at a spe-cific site in question, but it is not known how well the findings reflect the human exposure in the indoor environment.
2.3.5
Sampling for PCR
According to a review article (Peccia & Hernandez, 2006), the most common sam-pling methods for bioaerosol studies with PCR are the same as for culture methods i.e. the impaction onto non-agar surfaces (20 % of previous studies), impingement (24 %) and filtration (56 %). The best sampling devices for PCR-based measure-ments appear to be high-volume samplers. Penicillium roqueforti has been detected by PCR in samples collected directly to Eppendorf tubes (Williams et al., 2001). The bioaerosol sampler, where air is bubbled through a porous medium submerged in a liquid layer (Agranovski et al., 2002), has been used in conjunction of PCR to iden-tify Influenza virus (Pyankov et al., 2007). The sampler is suitable also for detecting bacteria and fungi (Agranovski et al., 2002).
29
2.3.6
Sampling aspects regarding the exposure assessment
There are no established health-based guidelines for bioaerosols because of the vary-ing nature of the purported exposvary-ing agents. Clearly, there is a need for developvary-ing consistent methods for quantifying indoor exposures. At its best, the sampling pro-cedure is still conducted over a limited period, like snapshot of the potential overall exposure (Mazur & Kim, 2006). All sampling should be based on an assessment strategy and careful monitoring planning, because no sampling method can collect all the potential pollutants existing in indoor environments (Hui et al., 2006). For the exposure assessment in indoor environments, biomonitoring of exposed individuals with serum samples (fungal specific immunoglobulin (Ig)G, IgE, IgA and IgM anti-bodies) may also be utilized (Hyvärinen et al., 1999; Johanning et al., 1996; Johan-ning et al., 1999; Raunio et al., 1999; Vojdani et al., 2003). A comprehensive expo-sure assessment strategy requires the inspection of the building by trained persons familiar with building science and residential construction and this will entail a thor-ough inspection of the building and estimation of the contaminated area (Dillon et al., 1999; Nevalainen et al., 1998). It has been stated that a multidisciplinary ap-proach including technical investigations, microbial measurements and health sur-veys is the best way to approach indoor air problems (Haverinen et al., 1999). Usu-ally, indoor and outdoor exposure assessments are conducted separately. Recently, in a comprehensive study both traffic-derived and biological contaminants in indoor environments were monitored (Miller et al., 2007).
2.4
Detection methods of indoor microbes
Exposure assessment includes a description and quantification of exposing agents. In the case of microbes, this means that microbial communities including various groups of bacteria and fungi should be detected properly. Detection methods are based on culturing, on microscopy after staining, on assessment of total biomass of microbes using chemical markers as well as on molecular methods. It is self evident that different microbes can have different effects on occupants and, therefore, identi-fication of the microbes to the genus or species level is needed.
2.4.1
Culture-based methods
Traditional microbial detection methods are based on culturing. Culturing methods underestimate the total amount of microbes present in the sample. It has been esti-mated that somewhere between 0.001 – 15 % of bacteria in environmental samples are culturable (Amann et al., 1995). For fungi, the proportion of culturability can be higher – a median value of 87 % was reported (Lee et al., 2006). The culture
me-30
dium and incubation conditions (Burge, 1995) are two of the factors that further af-fect the results. There is no single medium that permits the growth of all microbes. Some genera, such as Stachybotrys, grow poorly on most media. In addition, interac-tions between the microbial colonies developing on the agar medium may influence the results. Rapidly growing fungi such as Mucor spp. may obscure slowly growing ones such as Wallemia spp.. In addition, organisms present at high concentrations may inhibit the growth of less abundant species (MacNeil et al., 1995; Portnoy et al., 2004). The indoor temperatures are usually in the mesophilic range of microbes and therefore, incubation is usually performed at (25 ± 3) °C for a duration of at least 5 days (Samson et al., 1994). Commonly used media for indoor fungi and bacteria are presented in Table 3. The advantages of culture include the possibility to identify the microbial genera or species in samples and to isolate the strains for further charac-terization. Morphology based identification is usually performed using microscope, but also direct identification of species by image analysis using accurate digital camera is possible (Dörge et al., 2000). However, culturing is time consuming, labor intensive and therefore, a costly technique.
31
Table 3. Most commonly used or recommended media for different microbial groups in studies of indoor environments.
Microbes Medium Hydrophilic fungi Malt extract agar (MEA)2,4,5,9,10,12,13,14,15,19,23,27
2 % MEA4,7,8,17,18,24,26,29
Media with Rose Bengal3,25,27
Xerophilic fungi Dichloran 18 % glycerol agar (DG18)4,7,8,13,17,18,19,26,28,29
Mesophilic bacteria Tryptone soy agar (TSA)1,4,8,9,13,16,19,22
Tryptone yeast extract glucose agar (TYG)7,17,18,20,21,23,25
R2A4,6,16,19
Gram-negative bacteria Eosin methylene blue agar (EMB)5,16
Thermophilic actinomycetes Nutrient agar11
Half-strength nutrient agar21
TSA11
or sample heating before plating11
1(Andersson et al., 1999), 2(Awad & Farag, 1999), 3(Beguin & Nolard, 1994), 4(Burge, 1995), 5(Górny et al.,
1999), 6(Hyvärinen et al., 1991), 7(Hyvärinen et al., 2002), 8(Jo & Seo, 2005), 9(Kim & Kim, 2007), 10(Kuo &
Li, 1994), 11(Kutzner, 1986), 12(Lee et al., 2004b), 13(Lee & Jo, 2006), 14(Lee et al., 2006), 15(Li & Kuo, 1994), 16(Liu et al., 2000), 17(Meklin et al., 2003), 18(Meklin et al., 2005), 19(Muilenberg, 2003), 20(Nevalainen, 1989), 21(Nevalainen et al., 1991), 22(Obbard & Fang, 2003), 23(Pessi et al., 2002), 24(Ramachandran et al., 2005), 25(Reponen et al., 1992), 26(Samson et al., 1994), 27(Shelton et al., 2002), 28(Stark et al., 2003), 29(van
Reenen-Hoekstra et al., 1991)
2.4.2
Non-molecular methods detecting total counts of microbes
In addition to culturable microbes, non-culturable and non-viable microbes are im-portant as exposing agents because they can also cause adverse health effects by evoking allergic or toxic reactions (Hirvonen et al., 1997b; Levetin, 1995). Methods for detecting these microbes include microscopic techniques, bioassays, immunoas-says, chemical methods, and molecular methods. Microscopic analyses, usually by epifluorescence microscopy with acridine orange staining (Kepner & Pratt, 1994) or impaction on coated slides with lactophenol staining (see Table 1), enable total cell counts or spore counts, respectively, but identification of fungal species is not possi-ble (Pasanen, 2001). Total cell concentrations of bacterial and fungal bioaerosols can be measured by flow cytometry (Day et al., 2002; Lange et al., 1997).
Microbial communities can also be quantified by chemical methods using markers for the structural or constituent components of microbes. One advantage is that these substances can be used for characterizing and quantifying particular microbial groups. The most commonly used chemical markers are listed in Table 4.
32
Table 4. Chemical markers used for microbial characterization and quantification.
Microbial group Constituent Chemical marker Reference Gram-negative bacteria Endotoxin
(lipopolysac-charide=LPS)
3-hydroxy fatty acids (10-14 carbon chains)
1,4,5,7,10,12,13,1 4
Actinobacteria 3-hydroxy fatty acids
(16 or more carbon chains)
11
Total bacteria Peptidoglycan Muramic acid 4,7,10,13
Fungal biomass Ergosterol 3,6,8,10,12,13,14
Fungi (and certain bacteria, some plants, pollen)
(13)--D-glucan 3,9
Aspergillus and Penicillium extracellular polysaccha-rides (EPS)
2
1(Alwis et al., 2006), 2(Douwes et al., 1999), 3(Foto et al., 2005), 4(Fox et al., 2003), 5(Lee et al., 2004a), 6(Miller & Young, 1997), 7(Nilsson et al., 2004), 8(Pasanen et al., 1999), 9(Rylander, 2004), 10(Sebastian &
Larsson, 2003), 11(Sebastian et al., 2005), 12(Szponar & Larsson, 2000), 13(Szponar & Larsson, 2001), 14(Szponar et al., 2003b)
In an experiment where schoolroom conditions were monitored, it was found that the concentrations of muramic acid and 3-hydroxy fatty acids in occupied school-rooms were much higher than in unoccupied school-rooms, reflecting the fact that children were the main source of the indoor bacteria (Fox et al., 2003). The plant sterol, er-gosterol, has been found to be a suitable marker to estimate fungal biomass in sam-ples from damp building material (Hippelein & Rügamer, 2004). Airborne levels of ergosterol and glucan have correlated with the visible mold damage in a house (Foto et al., 2005).
The Limulus amoebocyte lysate assay (LAL) is the most commonly used bioassay for endotoxin measurements (Eduard, 1996). Immunoassays for specific antigens and allergens include enzyme-linked immunosorbent assay (ELISA) and the radio allergo-sorbent test (RAST) (Eduard, 1996).
2.4.3
Molecular methods in detection of indoor microbes
The identification of specific bacterial or fungal species has developed greatly as the techniques based on DNA analyses have become available. These methods allow the specific detection of target organisms. With respect to environmental samples, a va-riety of these techniques has been successfully applied, including the qPCR, restric-tion fragment length polymorphism (RFLP) analysis, random amplified polymor-phic DNA (RAPD) analysis, and multiplex reverse transcription-PCR (RT-PCR)
33
(Degola et al., 2007; Isik et al., 2003; Vesper et al., 2000; Vesper et al., 1999). These techniques serve different purposes, qPCR is used for quantitative detection, RFLP, RAPD and RT-PCR are used for, e.g., differentiation of species or strains from each other.
The PCR method can be applied to any biological organism containing DNA. In PCR, a sequence of DNA, usually a specific gene or portion of a gene is selected and multiple copies are produced by an enzymatic PCR reaction. The gene sequence selected can also be from a microbial functional gene. The sequence chosen should be specific for the microorganism or a group of microorganisms (Peccia & Hernan-dez, 2006). These template DNA sequences can be targeted, amplified and quanti-fied by designed DNA primers. The DNA primers used to detect bacteria or fungi are commonly sequences from the 16S or 18S rRNA gene, respectively (Cruz-Perez et al., 2001a).
Extraction of DNA and PCR procedure: Before DNA can be analyzed, it must be extracted from cells. The nucleic acid extraction consists of cell lysis and nucleic acid purification. Enzymatic, chemical or physical methods or their combinations are used to disrupt cell or spore walls which protect the genomic DNA, (Cruz-Perez et al., 2001a). For most environmental bacteria and fungi, an additional step such as bead beating/milling using high energy agitation with micron-sized beads or rapid freeze-thaw cycling is needed for complete cell wall disruption since this will in-crease the DNA yield (Haugland et al., 2002; Haugland et al., 1999a; Peccia & Her-nandez, 2006; Saad et al., 2004).
DNA purification techniques are used for the removal of PCR inhibitory compounds produced by fungal cell lysates, the dust or particulate matter. The purification can be done in many ways, by phenol: chloroform extraction (Dean et al., 2004; Wil-liams et al., 2001) or using microcentrifuge spin columns with cleanup and elution (Haugland et al., 2002). The purification of the DNA extracts is an important step, but depending on the purification method and the type of sample, it may result in a high loss of DNA with recoveries 10 % (Brinkman et al., 2003). This step can, therefore, cause a major limitation particularly in environmental samples with low levels of microbial contamination (Keswani et al., 2005).
The main steps of the PCR procedure are shown in Table 5. Usually, the actual PCR is carried out in three steps, often preceded with one temperature hold at the begin-ning and one at the end. A typical number of cycles is 20 to 35. Sensitivity of the method can be increased by increasing the number of cycles (Dean et al., 2004).
34
Table 5. Usual PCR procedure.
Step Temperature (° C)
Duration Main action
Initialization 94-96 1-15 min Ensuring denaturation Denaturation 94-98 20-30 sec Cycling begins
Annealing 50-64 20-40 sec Primers attach to the single-stranded DNA template Extension/elongation 72 1 min DNA polymerase synthesizes new DNA strands
complementary to the DNA template strands Final elongation 72 5-15 min Ensuring full extension
Storage 4-15 Short time storage of the reaction
After the PCR amplicon is obtained, there are several options for the post PCR analysis. Microbial population studies include the DNA fingerprinting, clone library analysis, and DNA microarray hybridization.
Quantitative PCR analysis in indoor studies: QPCR is a faster method than conven-tional PCR (Zeng et al., 2004). To measure the amplicon concentration, dual-labeled fluorophore-containing DNA probes, such as TaqMan (Heid et al., 1996) or fluores-cent dyes, such as Sybr Green are used. Estimations of Cladosporium spp. concen-trations resulted in similar values with both of these dyes (Zeng et al., 2006). The labeled probe fluoresces when it becomes bound to the target DNA amplicon and if this fluorescence data is reported for each cycle, then the term real-time PCR may also be used. The increase in the amplicon concentration is seen as an increase in the fluorescence intensity, which is monitored with a sequence detector (Stetzenbach et al., 2004). Cycle threshold (Ct) is the cycle number where a statistically relevant increase in the fluorescent signal from the background is first observed. The quanti-fication of the target organism can be based on the co-ampliquanti-fication of an internal control which might be another fungus (e.g., Geotrichum candidum) (Haugland et al., 1999b) or on direct comparison with standards of the target organism, a tech-nique also called absolute quantification (Cruz-Perez et al., 2001b; Peccia & Her-nandez, 2006).
Most of the techniques used include primers and probes assigned to identify specific fungi or groups of fungi, although universal PCR assay for fungi has also been de-veloped (Zhou et al., 2000). The identification of many fungal species in a single PCR reaction is also possible, for instance by particle-associated nucleic acid PCR (PAN-PCR) (Dean et al., 2006). In indoor studies, qPCR has been most commonly used in analyzing microbes in house dust samples (Meklin et al., 2004; Vesper et al., 2000; Vesper et al., 2007; Vesper et al., 2006a; Vesper et al., 2006b; Vesper et al., 2004; Vesper et al., 2005). In some studies, air samples have been taken for qPCR