www.impactjournals.com/oncotarget
www.impactjournals.com/oncotarget/
Oncotarget, 2018, Vol. 9, (No. 9), pp: 8675-8680
Associations between apparent diffusion coefficient (ADC) and
KI 67 in different tumors: a meta-analysis. Part 2: ADC
minAlexey Surov
1,*, Hans Jonas Meyer
1,*and Andreas Wienke
2,*1Department of Diagnostic and Interventional Radiology, University of Leipzig, Leipzig, Germany
2Institute of Medical Epidemiology, Biostatistics, and Informatics, Martin-Luther-University Halle-Wittenberg, Halle (Saale), Germany *These authors contributed equally to this work
Correspondence to: Alexey Surov, email: [email protected] Keywords: diffusion weighted imaging; ADC; KI 67
Received: July 06, 2017 Accepted: November 13, 2017 Published: January 04, 2018
Copyright: Surov et al. This is an open-access article distributed under the terms of the Creative Commons Attribution License 3.0 (CC BY
3.0), which permits unrestricted use, distribution, and reproduction in any medium, provided the original author and source are credited.
ABSTRACT
The purpose of this part of the meta-analysis was to summarize data regarding associations between minimum apparent diffusion coefficient (ADCmin) and KI 67 in different tumors.
MEDLINE library was screened for associations between ADCmin and KI 67 in different tumors up to April 2017. Overall, 23 studies with 944 patients were identified. Associations between ADC and KI 67 were analyzed by Spearman's correlation coefficient.
The pooled correlation coefficient between ADCmin and KI 67 for all included tumors was ρ = -0.47. In detail, the correlation coefficients for separate tumors were as follows: cerebral lymphoma: ρ = –0.61 (95% CI = [–0.82; –0.41]); cervical cancer:
ρ = –0.56 (95% CI = [–0.68;–0.43]); pituitary adenoma: ρ = –0.55 (95% CI = [–1.31;
0.22]); glioma: ρ = –0.40 (95% CI = [–0.55; –0.24]); breast cancer: ρ = –0.37 (95% CI = [–0.74; –0.01]); meningioma, ρ = –0.15 (95% CI = [–0.38; 0.07]).
INTRODUCTION
Apparent diffusion coefficient (ADC) is a
quantitative parameter of water diffusion in tissues [1].
Previously, numerous studies investigated associations
between ADC and several histopathological features
in different tumors [2–5]. Some reports indicated that
ADC can predict proliferation activity and, therefore,
behavior of several malignancies [2, 3, 5]. As already
mentioned, ADC can be divided into three
sub-parameters: ADC minimum or ADC
min, mean ADC or
ADC
meanand ADC maximum or ADC
max[5]. As shown
in the part 1 of this meta-analysis, several tumors
showed different inverse correlations between ADC
meanand KI 67 [6]. Overall, the calculated correlation
coefficients ranged from –0.22 in breast cancer to –0.62
in ovarian cancer [6].
There were studies, which showed that ADC
minhad stronger correlations with KI 67, and can better
reflect proliferation potential of malignant lesions [7, 8].
However, the reported data were based on small number
of investigated tumors/patients.
The purpose of this part of the meta-analysis was
to provide evident data regarding associations between
minimum ADC (ADC
min), and KI 67 in different tumors.
RESULTS
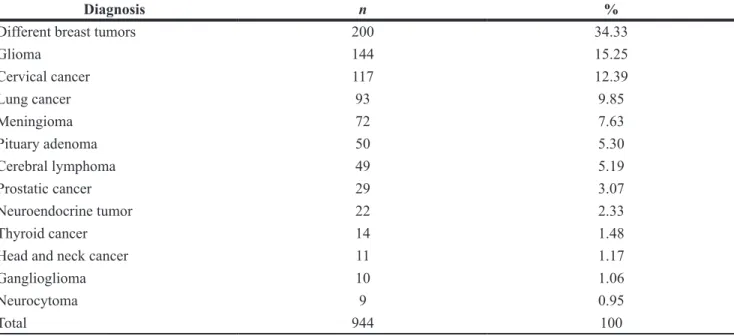
Overall, the identified 22 studies [7–28] contained
data about associations between ADC
minand KI 67 for 944
patients (Table 1).
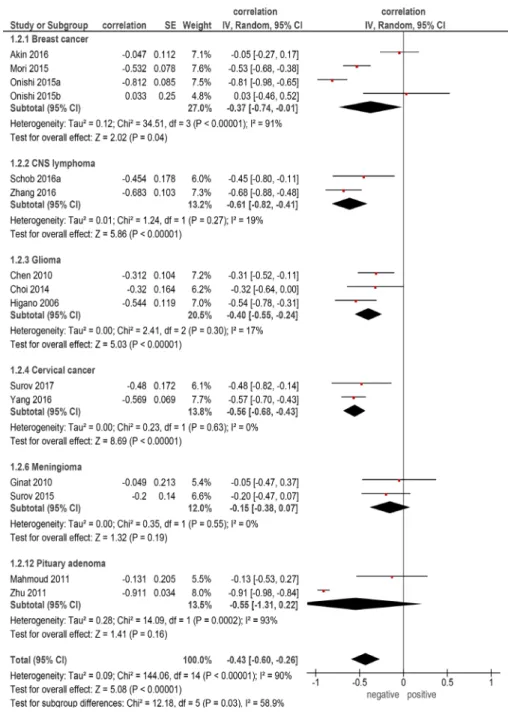
The pooled correlation coefficient for all patients
(Figure 1) was –0.47 (95 % CI = [–0.58; –0.35]),
heterogeneity Tau
2= 0.06, Chi
2= 193.62, df = 22
(P < 0.00001), I
2= 89 %, and test for overall effect Z =
7.76 (P < 0.00001).
On the next step correlation analysis for every
identified entity was performed. Thereby, only primary
tumors with more than two reports were included into the
analysis. There were 6 entities with 632 patients (Table
2). The calculated correlation coefficients were as follows
(Figure 2): -cerebral lymphoma: ρ = –0.61 (95% CI =
[–0.82; –0.41]); -cervical cancer: ρ = –0.56 (95% CI =
[–0.68;–0.43]); -pituitary adenoma:ρ = –0.55 (95% CI
Meta-Analysis
= [–1.31; 0.22]); -glioma: ρ = –0.40 (95% CI = [–0.55;
–0.24]); - breast cancer: ρ = –0.37 (95% CI = [–0.74;
–0.01]); -meningioma, ρ = –0.15 (95% CI = [–0.38; 0.07]).
DISCUSSION
The present meta-analysis summarizes data
about associations between ADC
minand KI 67 in
different tumors
Previously, some investigations focused on
relationships between ADC and histopathology, such as
cell count and/or proliferation potential, in several tumors
[2, 5]. However, the reported data were inconsistent:
while some authors mentioned that ADC fractions can
be associated with cellularity and KI 67, others did not
confirm this finding [5, 7, 8]. Our previous meta-analysis
regarding correlation between ADC
meanand tumor
cellularity showed that several tumors have different
associations between the investigated parameters [29].
In detail, the calculated correlation coefficients ranged
significantly and were as follows: ρ = –0.25 in lymphoma,
ρ = –0.45 in meningioma, ρ = –0.48 in breast cancer, ρ
= –0.53 in renal cell carcinoma, ρ = –0.53 in head and
neck squamous cell carcinoma, ρ = –0.56 in prostatic
cancer, ρ = –0.57 in uterine cervical cancer, ρ = –0.63 in
lung cancer, ρ = –0.64 in ovarian cancer, and ρ = –0.66 in
glioma [29]. Almost similar results were also identified
for associations between ADC
meanand KI 67 in the part 1
of the present work [6]. Because of these findings it can
be postulated that ADC
meandoes not reflect cellularity and
proliferation potential in all tumors and tumor-like lesions
as assumed previously.
According to some authors, another ADC parameter,
namely ADC
minhas been reported to be more sensitive in
prediction of cell count and proliferation activity than
ADC
mean[2, 7, 8]. However, a recent meta-analysis showed
that ADC
mindid not better correlate with tumor cellularity
than ADC
mean[30].
There were also inconsistent data about
correlation between ADC
minand proliferation
activity
As seen, in the present analysis, ADC
mincorrelated
moderately with KI 67 expression in overall sample.
Table 1: Tumor types involved into the meta-analysis
Diagnosis
n
%
Different breast tumors
200
34.33
Glioma
144
15.25
Cervical cancer
117
12.39
Lung cancer
93
9.85
Meningioma
72
7.63
Pituary adenoma
50
5.30
Cerebral lymphoma
49
5.19
Prostatic cancer
29
3.07
Neuroendocrine tumor
22
2.33
Thyroid cancer
14
1.48
Head and neck cancer
11
1.17
Ganglioglioma
10
1.06
Neurocytoma
9
0.95
Total
944
100
Table 2: Tumor entities included into the subgroup analysis
Diagnosis
n
Breast cancer
200
Glioma
144
Cervical carcinoma
117
Meningioma
72
Pituary adenoma
50
Cerebral lymphoma
49
www.impactjournals.com/oncotarget
The calculated correlation coefficient (ρ = –0.47) was
almost similar to those reported for ADC
mean(ρ = –0.44).
However, for the identified tumor entities, it was different
in comparison with the coefficients for ADC
mean. So, in
breast cancer, ADC
mincorrelated stronger with KI 67
(ρ = –0.37) than ADC
mean(ρ = –0.22) [6], although the
identified associations were slightly. Also in pituitary
adenoma, and cerebral lymphoma, ADC
mintended to be
better in comparison to ADC
mean: ρ = –0.56 vs ρ = –0.44
[6], and ρ = –0.61 vs ρ = –0.55, respectively [6]. On the
other hand, in glioma and meningioma, ADC
mindid not
better correlate with KI 67 expression than ADC
mean: ρ =
–0.40 vs ρ = –0.51 [6], and ρ = –0.15 vs ρ = –0.43 [6],
respectively.
The exact cause of our findings is unclear. They
supported previous suggestions that different ADC fractions
reflect different histopathological features [2]. Obviously,
there is no general rule regarding ADC parameters and
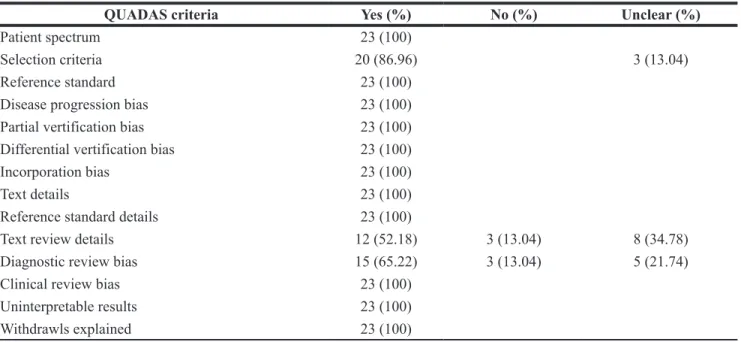
Table 3: Methodological quality of the involved 23 studies according to the QUADAS criteria
QUADAS criteria
Yes (%)
No (%)
Unclear (%)
Patient spectrum
23 (100)
Selection criteria
20 (86.96)
3 (13.04)
Reference standard
23 (100)
Disease progression bias
23 (100)
Partial vertification bias
23 (100)
Differential vertification bias
23 (100)
Incorporation bias
23 (100)
Text details
23 (100)
Reference standard details
23 (100)
Text review details
12 (52.18)
3 (13.04)
8 (34.78)
Diagnostic review bias
15 (65.22)
3 (13.04)
5 (21.74)
Clinical review bias
23 (100)
Uninterpretable results
23 (100)
Withdrawls explained
23 (100)
tumor proliferation, i.e. for some tumors ADC
minand for
other ADC
meanpredicts better proliferation potential.
Also for this part of the meta-analysis, already
the mentioned limitations [6] do apply: only 6 named
above tumor entities were involved into the work. For
other malignancies and tumor-like lesions no data could
be provided. In addition, the number of patients in the
groups of pituitary adenoma, cerebral lymphoma, and
meningioma was very small that questions the validity of
the estimated correlation coefficients.
In conclusion, there are different inverse
correlations between ADC
minand KI 67 in several tumors.
In comparison with ADC
mean, ADC
minseems to correlate
better with proliferation activity in breast cancer, cerebral
lymphoma, and pituitary adenoma.
In meningioma and glioma, however, ADC
meanreflects better tumor proliferation than ADC
min.
MATERIALS AND METHODS
Data acquisition and proving
The search strategy and data acquisition are
described precisely in the part 1 of the meta-analysis [6].
For this part, only data regarding associations between
ADC
minderived from diffusion weighted imaging (DWI)
and expression of KI 67 in different tumors and
tumor-like lesions were collected. The Preferred Reporting Items
for Systematic Reviews and Meta-Analyses statement
(PRISMA) was used for the research [31].
www.impactjournals.com/oncotarget
Overall, 22 studies were included into the present
analysis [7–28]. The following data were extracted from
the literature: authors, year of publication, number of
patients, tumor type, and correlation coefficients.
Meta-analysis
The methodological quality of the 23 studies was
independently checked by two observers (A.S. and
H.J.M.) using the Quality Assessment of Diagnostic
Studies (QUADAS) instrument according to previous
descriptions [32, 33]. The results of QUADAS proving is
given in Table 3.
Associations between ADC
minand KI 67 were
analyzed by Spearman’s correlation coefficient. The
reported Pearson correlation coefficients in some studies
were converted into Spearman correlation coefficients as
described previously [34].
The meta-analysis was undertaken by using RevMan
5.3 (Computer program, version 5.3. Copenhagen: The
Nordic Cochrane Centre, The Cochrane Collaboration,
2014). Heterogeneity was calculated by means of the
inconsistency index I² [35, 36]. In a subgroup analysis,
studies were stratified by tumor type. Furthermore,
DerSimonian and Laird random-effects models with
inverse-variance weights were used without any further
correction [37].
CONFLICTS OF INTEREST
There are no conflicts of interest.
FUNDING
None.
REFERENCES
1. Fornasa F. Diffusion-weighted Magnetic Resonance Imaging: What Makes Water Run Fast or Slow? J Clin Imaging Sci. 2011; 1:27.
2. Bollineni VR, Kramer G, Liu Y, Melidis C, deSouza NM. A literature review of the association between diffusion-weighted MRI derived apparent diffusion coefficient and tumour aggressiveness in pelvic cancer. Cancer Treat Rev. 2015; 41:496–502.
3. Surov A, Meyer HJ, Höhn AK, Behrmann C, Wienke A, Spielmann RP, Garnov N. Correlations between intravoxel incoherent motion (IVIM) parameters and histological findings in rectal cancer: preliminary results. Oncotarget. 2017; 8:21974–21983. https://doi.org/10.18632/oncotarget.15753. 4. Sinkus R, Van Beers BE, Vilgrain V, DeSouza N, Waterton
JC. Apparent diffusion coefficient from magnetic resonance imaging as a biomarker in oncology drug development. Eur J Cancer. 2012; 48:425–31.
5. Surov A, Caysa H, Wienke A, Spielmann RP, Fiedler E. Correlation between different ADC fractions, cell count, Ki-67, total nucleic areas and average nucleic areas in meningothelial meningiomas. Anticancer Res. 2015; 35:6841–6.
6. Surov A, Meyer HJ, Wienke A. Associations between apparent diffusion coefficient (ADC) and KI 67 in different tumors: A Meta-Analysis. Part 1: ADCmean. Oncotarget. 2017; 8:75434–
75444. https://doi.org/10.18632/oncotarget.20406.
7. Surov A, Meyer HJ, Schob S, Höhn AK, Bremicker K, Exner M, Stumpp P, Purz S. Parameters of simultaneous 18F-FDG-PET/MRI predict tumor stage and several histopathological features in uterine cervical cancer. Oncotarget. 2017; 8:28285–28296. https://doi.org/10.18632/oncotarget.16043. 8. Zhang Y, Zhang Q, Wang XX, Deng XF, Zhu YZ. Value of
pretherapeutic DWI in evaluating prognosis and therapeutic effect in immunocompetent patients with primary central nervous system lymphoma given high-dose methotrexate-based chemotherapy: ADC-methotrexate-based assessment. Clin Radiol. 2016; 71:1018–1029.
9. Akın Y, Uğurlu MÜ, Kaya H, Arıbal E. Diagnostic value of diffusion-weighted Imaging and apparent diffusion coefficient values in the differentiation of breast lesions, histpathologic subgroups and correlatıon with prognostıc factors using 3.0 Tesla MR. J Breast Health. 2016; 12:123–132.
10. Bae H, Yoshida S, Matsuoka Y, Nakajima H, Ito E, Tanaka H, Oya M, Nakayama T, Takeshita H, Kijima T, Ishioka J, Numao N, Koga F, et al. Apparent diffusion coefficient value as a biomarker reflecting morphological and biological features of prostate cancer. Int Urol Nephrol. 2014; 46:555–561.
11. Besa C, Ward S, Cui Y, Jajamovich G, Kim M, Taouli B. Neuroendocrine liver metastases: Value of apparent diffusion coefficient and enhancement ratios for characterization of histopathologic grade. J Magn Reson Imaging. 2016; 44:1432–1441.
12. Chen Z, Ma L, Lou X, Zhou Z. Diagnostic value of minimum apparent diffusion coefficient values in prediction of neuroepithelial tumor grading. J Magn Reson Imaging. 2010; 31:1331–1338.
13. Choi H, Paeng JC, Cheon GJ, Park CK, Choi SH, Min HS, Kang KW, Chung JK, Kim EE, Lee DS. Correlation of 11C-methionine PET and diffusion-weighted MRI: is there a complementary diagnostic role for gliomas? Nucl Med Commun. 2014; 35:720–726.
14. Ginat DT, Mangla R, Yeaney G, Wang HZ. Correlation of diffusion and perfusion MRI with Ki-67 in high-grade meningiomas. AJR Am J Roentgenol. 2010; 195:1391– 1395.
15. Higano S, Yun X, Kumabe T, Watanabe M, Mugikura S, Umetsu A, Sato A, Yamada T, Takahashi S. Malignant astrocytic tumors: clinical importance of apparent diffusion coefficient in prediction of grade and prognosis. Radiology. 2006; 241:839–846.
16. Karaman A, Durur-Subasi I, Alper F, Araz O, Subasi M, Demirci E, Albayrak M, Polat G, Akgun M, Karabulut N. Correlation of diffusion MRI with the Ki-67 index in non-small cell lung cancer. Radiol Oncol. 2015; 49:250–255. 17. Kikuchi T, Kumabe T, Higano S, Watanabe M, Tominaga T.
Minimum apparent diffusion coefficient for the differential diagnosis of ganglioglioma. Neurol Res. 2009; 31:1102– 1107.
18. Li L, Wang K, Sun X, Wang K, Sun Y, Zhang G, Shen B. Parameters of dynamic contrast-enhanced MRI as imaging markers for angiogenesis and proliferation in human breast cancer. Med Sci Monit. 2015; 21:376–382.
19. Mahmoud OM, Tominaga A, Amatya VJ, Ohtaki M, Sugiyama K, Sakoguchi T, Kinoshita Y, Takeshima Y, Abe N, Akiyama Y, El-Ghoriany AI, Abd Alla AK, El-Sharkawy MA, et al. Role of PROPELLER diffusion-weighted imaging and apparent diffusion coefficient in the evaluation of pituitary adenomas. Eur J Radiol. 2011; 80:412–417. 20. Mori N, Ota H, Mugikura S, Takasawa C, Ishida T,
Watanabe G, Tada H, Watanabe M, Takase K, Takahashi S. Luminal-type breast cancer: correlation of apparent diffusion coefficients with the Ki-67 labeling index. Radiology. 2015; 274:66–73.
21. Onishi N, Kanao S, Kataoka M, Iima M, Sakaguchi R, Kawai M, Kataoka TR, Mikami Y, Toi M, Togashi K. Apparent diffusion coefficient as a potential surrogate markerfor Ki-67 index in mucinous breastcarcinoma. J Magn Reson Imaging. 2015; 41:610–615.
22. Sakamoto R, Okada T, Kanagaki M, Yamamoto A, Fushimi Y, Kakigi T, Arakawa Y, Takahashi JC, Mikami Y, Togashi K. Estimation of proliferative potentiality of central neurocytoma: correlation alanalysis of minimum ADC and maximum SUV with MIB-1 labeling index. Acta Radiol. 2015; 56:114–120.
23. Schob S, Meyer J, Gawlitza M, Frydrychowicz C, Müller W, Preuss M, Bure L, Quäschling U, Hoffmann KT, Surov A. Diffusion-Weighted MRI reflects proliferative activity in primary CNS lymphoma. PLoS One. 2016; 11:e0161386. 24. Schob S, Voigt P, Bure L, Meyer HJ, Wickenhauser C,
Behrmann C, Höhn A, Kachel P, Dralle H, Hoffmann KT, Surov A. Diffusion-Weighted imaging using a readout-segmented, multishot EPI sequence at 3 T distinguishes between morphologically differentiated and undifferentiated subtypes of thyroid carcinoma- a preliminary study. Transl Oncol. 2016; 9:403–410.
25. Surov A, Stumpp P, Meyer HJ, Gawlitza M, Höhn AK, Boehm A, Sabri O, Kahn T, Purz S. Simultaneous (18) F-FDG-PET/MRI: Associations between diffusion, glucose metabolism and histopathological parameters in patients
with head and neck squamous cell carcinoma. Oral Oncol. 2016; 58:14–20.
26. Surov A, Gottschling S, Mawrin C, Prell J, Spielmann RP, Wienke A, Fiedler E. Diffusion-weighted imaging in meningioma: Prediction of tumor grade and association with histopathological parameters. Transl Oncol. 2015; 8:517–523.
27. Yang W, Qiang JW, Tian HP, Chen B, Wang AJ, Zhao JG. Minimum apparent diffusion coefficient for predicting lymphovascular invasion in invasive cervical cancer. J Magn Reson Imaging. 2017; 45:1771–1779.
28. Zhu L, Ren G, Li K, Liang ZH, Tang WJ, Ji YM, Li YX, Cheng HX, Geng DY. Pineal parenchymal tumours: minimum apparent diffusion coefficient in prediction of tumour grading. J Int Med Res. 2011; 39:1456–1463. 29. Surov A, Meyer HJ, Wienke A. Correlation between apparent
diffusion coefficient (ADC) and cellularity is different in several tumors: A Meta-Analysis. Oncotarget. 2017; 8:59492–59499. https://doi.org/10.18632/oncotarget.17752. 30. Surov A, Meyer HJ, Wienke A. Correlation between
minimum apparent diffusion coefficient (ADCmin) and
tumor cellularity: A meta-analysis. Anticancer Res. 2017; 37:3807–3810.
31. Moher D, Liberati A, Tetzlaff J, Altman DG. Preferred reporting items for systematic reviews and meta-analyses: the PRISMA statement. PLoS Med. 2009; 6:e1000097. 32. Whiting P, Rutjes AW, Reitsma JB, Bossuyt PM, Kleijnen
J. The development of QUADAS: a tool for the quality assessment of studies of diagnostic accuracy included in systematic reviews. BMC Med Res Methodol. 2003; 3:25. 33. Whiting PF, Weswood ME, Rutjes AW, Reitsma JB,
Bossuyt PN, Kleijnen J. Evaluation of QUADAS, a tool for the quality assessment of diagnostic accuracy studies.BMC Med Res Methodol. 2006; 6:9.
34. Chalkidou A, Landau DB, Odell EW, Cornelius VR, O’Doherty MJ, Marsden PK. Correlation between Ki-67 immunohistochemistry and 18F-fluorothymidine uptake in patients with cancer: A systematic review and meta-analysis. Eur J Cancer. 2012; 48:3499–513.
35. Leeflang MM, Deeks JJ, Gatsonis C, Bossuyt PM. Systematic reviews of diagnostic test accuracy. Ann Intern Med. 2008; 149:889–97.
36. Zamora J, Abraira V, Muriel A, Khan K, Coomarasamy A. Meta-DiSc: A software for meta-analysis of test accuracy data. BMC Medical Research Methodology. 2006; 6:31. 37. DerSimonian R, Laird N. Meta-analysis in clinical trials.