Advancements in Data Analytics using Big Data and
Cloud Computing
Rayan Dasoriya
Department of Computer Engineering SVKMs NMIMS Mukesh Patel School of Technology Management and Engineering
Mumbai, India
Krishna Samdani
Department of Computer Engineering SVKMs NMIMS Mukesh Patel School of Technology Management and Engineering
Mumbai, India
ABSTRACT
With the increase in the amount of data present over the cloud, there is a need for an efficient management of data to research and industry. Big Data is used by different organizations to extract valuable information which can be analyzed computationally to reveal trends, patterns, and associations exposing the human interaction and behavior for making various industrial decisions. Due to the enormous volume of data, the traditional systems are becoming incapable of storing and computing such voluminous data. To resolve this issue, the data is stored in the cloud, and all the analysis is done over Big Data using the cloud. But to make any practical decision, the data must be optimized, secured and visualized. Analysing large volume of data is not beneficial always unless it is adequately investigated. A perfect knowledge base should be selected. The techniques which are available right now are insufficient to analyze the Big Data and identify the frequent services accessed by the cloud users. Various functions can be integrated to provide a better environment to work in. Using these services, people become widely vulnerable to exposure. That is, it becomes possible to collect more data than it is required which may lead to leakage of the data and hence security concerns are at stake. Results can be analyzed in a better way by visuals like graphs, charts, etc. and thus, helps in faster and efficient decision-making and predictive modeling which can further extend this domain to Artificial Intelligence. MapReduce Algorithm assists in maintaining a log of user’s activities in the cloud and show the frequently used services. This paper shows the advancements done in the field of Data Analytics with Cloud Computing and Big Data, and also proposes a scheme for making Big Data Analytics more accurate, efficient and beneficial to the Cloud environment.
Keywords
Big Data Analytics; Integration; Cloud Computing; Privacy; Artificial Intelligence
1.
INTRODUCTION
The quality of Big Data analytics work can be evaluated by its productivity and performance. The tools that are available right now are wither too domain-specific or program-specific. Hence, a productive platform should be developed for the integration of various tools and packages. Many IT companies had already launched platforms like Microsoft Azure, HP HAVEn, IBM Big Data Analytics. But the issue is that they have an expensive license, and most of them are difficult to customize and interact with other existing platforms. Open source platforms like Cloudera, MapR are also available for small businesses.
Big Data [1] refers to the extensive data sets which are analyzed computationally and Data Analytics [2] applies to the science of examining raw data from the information to draw out conclusions. Cloud Computing is a model which enables the access to a shared pool of resources via a network. It has abundant resources which the user can access on demand.
Cloud Computing comprises of three parts: Software as a Service, Infrastructure as a Service and, Platform as a Service. It is available at low cost. It has easy maintenance, excellent performance, and productivity. Due to a small storage capacity of traditional PC, we use Cloud Computing environments like Amazon AWS and Google Cloud. This is one of the incentive why we migrate to these available platforms. Any good big data has characteristics of any storage that has a large volume, high velocity, varied and, valid content such as history, social networks, and personal information. The availability of all this information makes the work easier for extracting useful knowledge. We can look out for the real-time trend analysis and then take any further decision. Big Data tends to change rapidly and disturb its nature, thus making it challenging to handle. Various tools are required by the enterprises for understanding and analyzing data quickly and efficiently.
Big Data Analytics is the use of advanced tool designed for analytics to process enormous and diverse data which contains varied content. Security of these data are of utmost priority. Hence robust protection mechanisms must be implemented so that the data is secured and no one can get access to any of the clusters and nodes.
2.
RELATED WORK
2.1
Software Present and their issues
Different software [3] are used for various functions of Big Data analytics. Some related software is:
2.1.1
Big Data Storage
Storing significant amount of data over the cloud is more convenient rather than storing them on the disk. Hadoop Distributed File System which is available by Apache Hadoop provides high throughput access to data. Databases such as HBase, MongoDB, Cassandra (developed by Facebook) are examples some of the NoSQL databases are scalable in dealing with big semistructured data.
2.1.2
Computation Model
Other programming bundles which are fused into Hadoop distributed system are HBase, Hive, Pig and so forth. Apache Start and Flink expanded the execution by reserving information in memory.
2.1.3
Virtualization
Oracle VirtualBox, KVM, VMware, Microsoft Xen are some of the examples, but they are heavyweight. As a result, they require some time to start. Docker, which is available for Linux, is a lightweight software. It has high efficiency for host interaction.
User Interface for Big Data Analytics: Since the vast majority of the information examiners are not a PC researcher, UI assumes a fundamental part. DataBricks, which is based on Spark, gives a distributed computing stage.
2.2
Big Data
Distinctive substance, for example, history, trends, interpersonal data and individual data which are assembled separate valuable information even continuously. Organizations can accomplish their goals by concentrating on these patterns. Be that as it may since the info is heterogeneous; it is troublesome for teams to separate data since it requires vast parallel handling. Henceforth Big Data Analytics comes into the place. It utilizes progressed examination and systems to think about various records of various content. But it depicts a massive challenge for security [4] concerns. There are 3Vs which define the criteria for useful Big Data. They are:
2.2.1
Volume
Collection and storing of data in many distributed stores. Up to Exabytes of data is available for processing to extract valuable knowledge.
2.2.2
Variety
Different types of content can be stored. This array allows processors to extract as interesting as varied information about a specific topic.
2.2.3
Veracity
It refers to the accuracy and the validity of the data. Analysis of data is useful if the content is valid and accurate. Preferably, a significant amount of data that may not be valid will lead to false interpretation.
2.3
Need for Visualization
Any data sets which are difficult to handle by conventional RDBMS can be a Big Data. To make the Big Data an efficient application, we have to get precise results of various tests on data. A right analytics tool leads to a dynamic data extraction. A new business model known as SMAC (Social, Mobility, Analytics, and Cloud) has emerged in which the social behavior is used to analyze the trend of the user.
We can judge the thinking of a user by analyzing their social movements. This movement can be explained by geospatial reasoning and various other tools which can give us the final report. A practical result can be shown using a graphical approach to Graphs, Charts, 3-D Visuals, etc. Data visualization plays an important role here. Since the data is live and current status is tracked, a visual approach is considered to be a better solution to the problem. It creates an enormous impact. Computer graphics are used to show patterns and trends. Computer Graphics, when linked to Big Data, yields better result.
3.
EXISTING WORK AND
CHALLENGES
3.1
Challenges for Security and Privacy
To explore and analyse the market’s behaviour, many industries are adopting Big Data as a technology. There are many security challenges [4] that are faced and should be taken into consideration when we are analyzing the data over the cloud. Some of them are:
3.1.1
Random Distribution
Since the storage of is distributed is dispersed among a vast geographical region, it is difficult to determine the location of the processing and the storage. This may lead to various security issues and regulation breaches. Multiple clusters are distributed over different servers. So the primary challenge will be to spread processing and storage to data sensibility and regulations.
3.1.2
Privacy
We have to assign particular attention to the sensitive data. In the present, Big Data analytics consider all the data as of equal importance. If a hacker gains access to a node, the cluster can be easily accessed and exploited. Hence, particular actions like encryption or techniques related to blind processing are required to secure this type of data.
3.1.3
Computation
Computations should be protected and secured to avoid any change in the extracted results. We should also check any attempt of spy on the performed calculations. The server should not modify the existing values.
3.1.4
Integrity
Before seeking any insights and advancing to any further conclusions, the trust level and validity of the information should be ensured. An enormous volume of data could also create a trouble as it may contain some false data which may lead to misinterpretation. Many times, the chunk of data on which we are processing might include some malicious data which may affect our search results. So, there is a need to narrow down our knowledge base to get accurate results.
3.1.5
Communication
The storage of Big Data takes place in various nodes and clusters around the different countries of the world. The connections between them are made through general networks. A hacker could modify the internode communication and can steal the information while establishing an interface between a node and a cluster. Therefore, there is a need to build a secure connection which can ensure the privacy and security of the data. Secure connections like SSL should be used to provide the non-breaching of the communication standards.
3.1.6
Access Control
A reliable access control system should be established to deny any unauthorized access to our data. Only the node with satisfactory administrative powers can access the data and can make changes according to this requirement. Any modification should be observed by an authentication tool to protect our system from unauthorized or ill-disposed nodes.
3.2
Challenges in Healthcare
minimized by keeping an account of all the errors that occurred in clinical decision support and evidence-based medicine. Information should be checked at every level to ensure the variedness of data. Reduction of cost of medical insurance can help the patient economically. Predictive decisions can be made using Big Data computation. But on such heterogamous data, it becomes difficult. The role of technicians in the healthcare field is to maintain a proper balance between business and technology, which makes a path for Big Data in healthcare. The best way to digitize a patient’s data is still a problem. In EHR Systems, previous clinical solutions that were not added are concentrated. A stable solution needs to be developed. Now, evidence-based healthcare is going on overtaking the subjective decision. So incentives must be provided to use this technology. Use of social communications regarding digital forms are increasing, and collection of genome information has become cheaper.
3.3
Visualization
Various tools like gephi, polymax, and node box are already available, but they are too specific or work in a particular domain. Facebook also has a visual analytics tool known as Facebook Insights in which we can keep track of our Facebook page statistics by looking at various performance metrics and user interaction and involvement with our page once we get a minimum of 30 likes. SAS provides an excellent platform for deriving visuals, but it is paid and costly to implement.
Still, there is no proper integration with Big Data analytics. There is a requirement for further development in this field. It can be used in the various area like:
3.3.1
Social Site
Social Site involvement trend is increasing day by day. User’s data can be analyzed to get the trend. All the activities are getting tracked by the social media platform. This is not only limited to social media. It is further expanded to all the search engines as well. By knowing the activities of a person and keeping a track on social site, we can merely get the trend. Marketing can also be done on social site. All the advertisements that we get on the internet are linked to something we have searched, and this is how the marketing of a product takes place. When you search for something on Flipkart and then when you go on a social site, say Facebook, you will automatically get an advertisement showing some of their products because all the time, your activity was tracked.
3.3.2
Renewal Energy
Establishment of any new energy generation projects and estimating the energy consumption, climatic conditions over that region must be taken care of. Due to the large and unstructured data of the climatic parameters over the previous years, Big Data storage mechanism is required to store the data for further processing.
3.3.3
Topic Modelling
It is used in deciding the page relevance to the topic and is also used for page ranking process of search engines in machine learning.
3.3.4
Patient Disease Analysis
Symptoms and trends of most of the diseases can be detected at early stage. If all these can be analyzed in a specific manner, then severe disease can be cured or prevented at the early stages of development. This can save money, life and
time as the hospital charges are one of the most costly expense for a person.
4.
POSSIBLE SOLUTIONS TO THE
EXISTING PROBLEMS
4.1
Integration of tools
Various tools can be integrated to get a platform which is more efficient to work on. This will redefine the workflow. We can also visualize the data and make our system light-weight. They are described as follows:
4.1.1
New Data Analytics Flow
SPARK Notebook provides a combination of Scala code, JavaScript, SQL and Markup collaboratively. Verifying algorithms is good. However, it has its limitations for code sharing and reusing. The three essential components are Notebook, Workflows, and Widgets. Various steps are:
• Verify the new idea with Notebook which may include several iterations.
• Integrate the code with the help of a widget component in a web IDE into a reusable widget. The template will define all the input and output need.
• Different widgets can be combined to form compound applications.
4.1.2
Lightweight and scalable virtualization
For each application which is running on a single node, a container which includes the overall runtime will be created. For building virtual clusters, we will use Docker Swarn. In Cloud Computing, Docker was used. We encapsulate legacy codes into widgets with only small changes of input and output. Since the running environment is different, we set up several execution environments with Docker. With the lightweight container and environment independent, on which programming and testing are identical, the overall performance and reusability of the system are significantly developed.4.1.3
Visualization of Big Data
In comparison with traditional desktop applications, display on web applications still has its limitations. D3 is used as a Data Analytics platform for data visualization library. The D3 renders a problem. All the available data needs to be interpreted by the client side JavaScript engine which is not possible with the use of Big Data. Hence, we would do server-side JavaScript interpretation to resolve the visualization problems of Big Data on a web interface.
4.2
Possible Security Techniques
There are some reasonable security and privacy techniques that can be applied to ensure that our storage, computation, and communication over the cloud is secured. [4]
4.2.1
Rules and Legality
Some significant financial or sensitive personal information may also be present which should not be processed. Furthermore, storage and processing location should be taken care of around the servers as every country has its set of rules and regulations.
4.2.2
Encryption
4.2.2.1
Computation
As it is difficult to identify the location of calculation, some control techniques must be adopted either to deny or to check its creditability. Blind processing techniques based on homographic encryption is a suitable solution which allows a processor to execute instructions without knowing the nature.
4.2.2.2
Storage
All the data should be encrypted and stored so that any extraction of knowledge by any malicious or unauthorized node from it becomes difficult without the knowledge of decryption keys.
4.2.2.3
Communication
The communication should be preserved to ensure the security of different exchanges. The network should be encrypted by employing SSL, TLS protocol which cannot be read without the knowledge of keys.
4.2.3
Authentication
Access should be controlled by the authentication mechanism. Architecture should be developed in such a way that both, joining clusters and critical storage accesses are controlled together.
4.2.4
Metadata and Tagged Data
All records should not be treated same. There should be some mechanism to differentiate between ordinary data and private data. Critical data should be labeled so that a high-level security can be applied to it.
4.2.5
Unstructured Distribution
Interrelated data should be stored in different clusters so that it will become difficult for the hackers to steal the information even if he gains access to one or some nodes.
4.2.6
Tracking Activity
A log file should be created to check out all the modification activity of insertion or deletion carried out by a node and the responsibility for these actions. These logs can be tracked later on to detect any malicious effect on the data.
4.3
Improvements in Healthcare
We can apply segmentation and predictive modeling to the profile of individual patients who just went through some precautionary care. Doctors can speed up the decisions by the results of Big Data Analytics. The standards of healthcare can be improved by predicting and identifying the early stage symptoms of the disease and preventing it. Analysing and treatment of that disease can be done in efficient ways.
Data of various patients can be joined and can be sent to third parties. Digitizing the data helps the patient a lot. Using mobile apps, data can be synchronized and used later on. Treatment methods are changing based on the data. Using Big Data, over usage of drugs can be avoided, and the patient can interact with others via a network. This minimizes the expense and allows them to access world-class information quickly. Monitoring the hospitals and hygiene also decrease the rate of spreading diseases. Cloudera, AWS and MapReduce, HBase and Cassandra being Open-source are widely used.
4.4
Visualization: A Better Way
We will show the results of Big Data analytics in a better way which will help in improving the decision-making system. Results are usually generated in the form of csv or excel sheets. A tool can be made which can take csv and text files as
an input as most of the reports are generated in this form and will convert it to graphs or charts and its format can be changed according to the need of the user.
Different types of a graph can be used for analysis of different kind of data. Bar Graphs are used most of the times due to its similar nature, but it cannot always be used. Line Graph can be used to see the changes over a period.
Our tool must have a live analysis capability so that it can be used in real time also. This all gives valid results to the decision-making team about the trend so that they can utilize their resources.
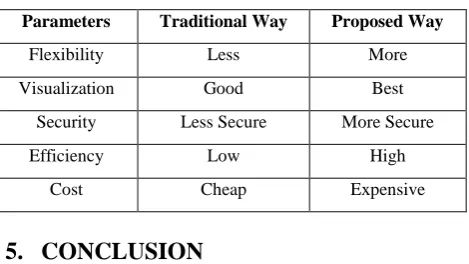
Table 1. Performance Metrics
Parameters Traditional Way Proposed Way
Flexibility Less More
Visualization Good Best
Security Less Secure More Secure
Efficiency Low High
Cost Cheap Expensive
5.
CONCLUSION
Integration of various services over the cloud provides better elasticity than the stand-alone platforms. Functions of multiple tools can be combined to get a more efficient system. Big Data is used in multiple industries to keep track of user's activities. Hence it is necessary to maintain specific security measures so that our data is secured. Predictive Analysis in Healthcare provides a better and fast analysis of patient's record. Visualization of the data for those who are not data scientist proves to be of utmost importance as it becomes easier to understand by visuals than by raw data.
6.
FUTURE SCOPE
With the exponential increase in the volume of data, the need for analyzing the data is also becoming important. This can be helpful in making future decisions. Security of the data should be ensured so that the industries can rely on them. Better tools will increase the number of users. Visualization plays a vital part to study the data. Implementation all these features may lead to increase in cost factor which needs to be resolved.
7.
REFERENCES
[1] Big Data, https://en.wikipedia.org/wiki/Big data, [Retrieved: Oct 2017].
[2] Data Analytics,
searchdatamanagement.techtarget.com/definition/dataana lytics, [Retrieved: Oct 2017].
[3] Yan, Y., Chen, C. and Huang, L., 2015, November. A Productive Cloud Computing Platform Research for Big Data Analytics. In Cloud Computing Technology and Science (CloudCom), 2015 IEEE 7th International Conference on (pp. 499-502). IEEE..
[5] Reddy, A.R. and Kumar, P.S., 2016, February. Predictive Big Data Analytics in Healthcare. In Computational Intelligence & Communication Technology (CICT), 2016 Second International Conference on (pp. 623-626). IEEE.