Original Research Article
A rapid appraisal of causes of child death in community
settings in district Bhopal
Devendra Gour, Manju Toppo*, Veena Melwani, Amreen Khan,
Pradeep Dohare, Dileep Dandotiya
INTRODUCTION
Child mortality is considered as a core indicator for child health and well-being. India prevented the deaths of about 1 million under five children in 2005-15, driven by significant reductions in the mortality rates of pneumonia, diarrhoea, tetanus and measles.1 The study stressed that India would need to maintain the rapid decline in mortality of children in the under 5 group annually to achieve UN global goals of reducing child mortality to at least 25 per 1,000 live births by 2030 as a part of SDG.2 More than two-thirds of infants die in the very first month. Ninety per cent of these deaths are due to easily
preventable causes like pneumonia and diarrhoea.3 Per 1,000 live births, the mortality rates of under 5 mortality rate fell from 45.2 to 19.6. Pneumonia and diarrhea mortality rates for the under 5 group declined substantially in 2010-15, at an average of 8-10 per cent annual decline nationally. Mortality rates from vaccine-preventable diseases such as tetanus and measles fell by about 90 per cent. Children are at greater risk of dying before age 5 if they are born in rural areas, poor households, or to a mother denied basic education.2
SRS (December 2016) has shown that maximum IMR is in Madhya Pradesh which is 50 per 1000 live births and
ABSTRACT
Background: Child mortality is considered as a core indicator for child health and well-being. SRS (December 2016) has shown that maximum IMR is in Madhya Pradesh which is 50 per 1000 live births and U5MR is 77 per 1000 live birth (2011). The study was carried out with the objectives to list out and categorize medical as well as socio-economic factors associated with these deaths and to evaluate the current status of child deaths in terms of the provision of health services and gaps in planning and execution of these services.
Methods: This cross sectional study was conducted on 42 deaths which occurred in Home settings in Bhopal District. A team visited the identified household and conducted in depth interview regarding the entire event related to antenatal care, place of delivery, intranatal and postnatal care, accessibility of the health services and quality of care rendered that contributed to poor child health that resulted in the death of the child.
Results: Out of 42 child deaths covered, 23 took place in the neonatal period, of which 21 were home deaths. 47.61% were attended by trained birth attendant. Breastfeeding was started immediately in 94.11% neonates whereas 5.88% were breastfed second day or later. 19 deaths took place in the post neonatal period, of which 17 were home deaths. (68.75%) were breast fed immediately within one hour of birth.
Conclusions: A majority of home based child deaths are occurring in families with high illiteracy rates and those belonging to BPL families.
Keywords: Child death review, Community based, Berasia, Phanda, Bhopal
Department of Community Medicine, Gandhi Medical College, Bhopal, Madhya Pradesh, India
Received: 28 July 2018 Accepted: 30 August 2018
*Correspondence: Dr. Manju Toppo,
E-mail: [email protected]
Copyright: © the author(s), publisher and licensee Medip Academy. This is an open-access article distributed under the terms of the Creative Commons Attribution Non-Commercial License, which permits unrestricted non-commercial use, distribution, and reproduction in any medium, provided the original work is properly cited.
U5MR is 77 per 1000 live birth (2011).4.5 Till date the studies done on child death review mainly focuses on facility based deaths in under5 group of children and no study has been done to review the community based child deaths in Bhopal. Our study is therefore an attempt to cover all the listed home based child deaths and conduct community-based verbal autopsies in all the Blocks of Bhopal district which will further help in finding out the lacunae in overall service delivery system. This study was therefore planned in collaboration with National Health Mission, MP.
Objectives
To identify and locate the reported home child deaths occurred from April to September 2017 in Bhopal district.
To list out and categorize medical as well as socio-economic factors associated with these deaths.
To evaluate the current status of child deaths in terms of the provision of health services and gaps in planning and execution of these services.
To identify the practices related gaps in the performance of service providers.
To suggest recommendations to avert home deaths.
METHODS
This was a cross sectional study conducted on all the blocks of district Bhopal. The study was conducted for a period of 2 months (1st January 2018- 28th February 2018). The study was conducted on under 5 children home deaths which occurred in Berasia and Phanda block of Bhopal district. Inclusion criteria were all the under 5 children deaths which occurred at home from a period of 1st January 2017 to 31st December in Berasia and Phanda block of Bhopal District. Exclusion criteria were deaths which occurred in above specified period, but were registered in Anganwadis other than those of Berasia and Phanda block. The list of reported child deaths which occurred from April to September 2017 in home settings in district Bhopal was provided from NHM which includes 42 deaths.
A community block mobilizer along with ASHA traced, identified and located each and every death for a period of 15 days. Verbal autopsy was conducted for 42 home deaths for a period of 6 weeks. In depth interview regarding the entire event was carried out related to antenatal care, mode and place of delivery, intranatal and postnatal care, availability and accessibility of the health services and quality of care rendered that contributed to poor child health that resulted in the death of the child
In addition, the investigators also assessed the child health facilities available at various health systems. The data obtained was compiled and tabulated using MS excel and analyzed using Epi-info 7 software.
RESULTS
Observations of neonatal deaths
Out of 42 child deaths, 23 took place in the neonatal period, out of which 19 were home child deaths; 2 died on the way to the facility and 2 were hospital deaths and hence were excluded.
Table 1 shows that most of the neonatal deaths i.e. 14 (66.67%) comprises of male deaths and nearly one-third i.e. 07 (33.33%) are female deaths. Late neonatal death (from day 8th to 28th day) were 11 (52.38%) followed by 10 (47.6%) deaths in the early neonatal period. Majority of the deceased neonates i.e. 18 (85.71%) belonged to Hindu religion whereas only 03 (14.29%) belonged to Muslim religion. Majority of the neonates who died i.e. 13 (61.90%) belonged to OBC caste whereas 06 (28.57%) belonged to SC/ST followed by 02 (09.52%) of the total 21 deceased neonates belonged to UR category.
Table 1: Distribution of neonatal deaths according to socio-demographic status (n=21).
Frequency N
Percentage (%)
Gender
Male 14 66.67
Female 07 33.33
Age in completed days
Less than 1 day 05 23.8
1-7 days 05 23.8
8-28 days 11 52.38
Religion
Hindu 18 85.71
Muslim 03 14.29
Caste
OBC 13 61.90
SC/ST 06 28.57
UR 02 09.52
Education of the respondent Illiterate and literate with
no formal education 09 42.86
Literate, primary or
below 04 19.05
Literate, middle 06 28.57
Literate, matric (class X) 02 09.52 Availability of BPL card
Yes 18 85.71
No 3 14.29
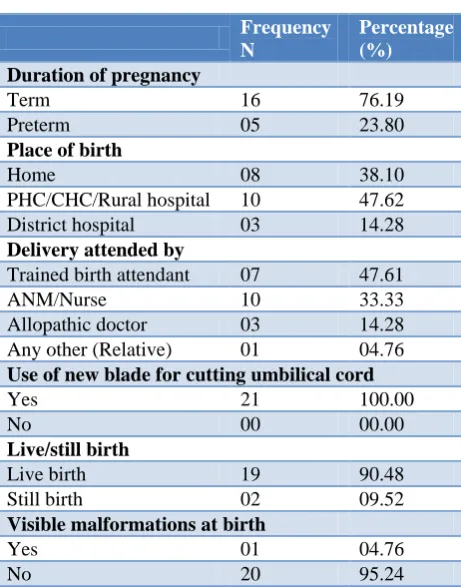
Most of the neonates who died were of term gestation i.e. around 16 (76.19%). Most of the neonates who died i.e. 13 (61.9%) were born in the hospital. Rest 08 (38.10%) were born at home. Most of the births i.e. in 10 (47.61%) were attended by ANM/Nurse followed by 07 (33.33%) births were attended by trained birth attendant. Only 03 (14.29%) births were attended by allopathic doctor. New knife or blade was used to cut the umbilical cord during delivery in all the neonatal deaths. 19 (90.48%) off the deceased neonates were live births and only 02 (09.52%) out of the total of 21 deceased neonates were still born. Majority of the neonates i.e. 20 (95.24%) did not have any visible malformations (Table 2).
Table 2: Distribution of neonates according to pregnancy and related outcome (n=21).
Frequency N
Percentage (%)
Duration of pregnancy
Term 16 76.19
Preterm 05 23.80
Place of birth
Home 08 38.10
PHC/CHC/Rural hospital 10 47.62
District hospital 03 14.28
Delivery attended by
Trained birth attendant 07 47.61
ANM/Nurse 10 33.33
Allopathic doctor 03 14.28
Any other (Relative) 01 04.76 Use of new blade for cutting umbilical cord
Yes 21 100.00
No 00 00.00
Live/still birth
Live birth 19 90.48
Still birth 02 09.52
Visible malformations at birth
Yes 01 04.76
No 20 95.24
Table 3 segregates the deceased neonates on the basis of their birth weight. 07 (36.84%) were low birth weight babies with weight less than 2.5 kg. Whereas nearly 08 (42.1%) of deceased neonates were of normal weight. 02 (10.52%) neonatal deaths with unknown birth weight were home deliveries, according to their perception, 01 (5.26%) was smaller than average and 01 (5.26%) was average in size.
Majority of the deceased neonates i.e. 16 (94.11%) were breastfed immediately or within one hour of birth whereas 01 (5.88%) were breastfed on second day or later since the child was shifted to NICU. Majority of neonates i.e. 15 (88.23%) were able to suck normally according to the respondents. Around 13 (76.47%) neonates were not given drinks other than breast milk to feed. In cases where the answer was affirmative, 02 (11.76%) neonates
were given cow milk and the other 02 (11.76%) were given nutmeg (jaiphal) because of family’s cultural belief (Table 4).
Table 3: Distribution of neonatal deaths on the basis of birth weight.
Birth weight Number Percentage
(%)
Low birth weight
(≥1.5 - <2.5) 07 36.84
Normal (2.5 – 3) 08 42.1
Overweight (>3) 02 10.52
DNK 02 10.52
Total 19 100.00
Table 4: Distribution of neonatal deaths according to breastfeeding practices (n=17).
Frequency N
Percentage (%)
Neonate first breastfed Immediately/within one
hour of birth 16 94.11
Second day or later 01 5.88 Able to suck normally on day 1 of life
Yes 15 88.23
No 02 11.76
Ever given anything other than breast milk within first 6 months
Yes 04 23.52
No 13 76.47
Majority of the deceased neonates i.e. 11 (57.90%) did not go to any health facility due to underestimation of signs and symptoms or unawareness on the part of family/parents. Fever was the most common reason among the neonates who did go to the facility i.e. among 04 (21.05%) out of the total of 19 deceased neonates.
Figure 1: Distribution of participants according to their reasons for going to the first health facility.
mother had suffered prolonged labour, in the other one, there was excessive bleeding during delivery, similarly in another, and the female had premature rupture of membrane (PROM) one or more days before contraction started. All these 03 cases were home deliveries.
In majority of cases i.e. 13 (61.90%) ASHA/AWW/VHN/ ANM did advise the family to take hospital treatment. 8 (38.1%) families did not seek any health care reason mainly due child was stillborn (12.5%), child died while sleeping (37.5%) or parents did not seek any advice (50%) (Figure 1).
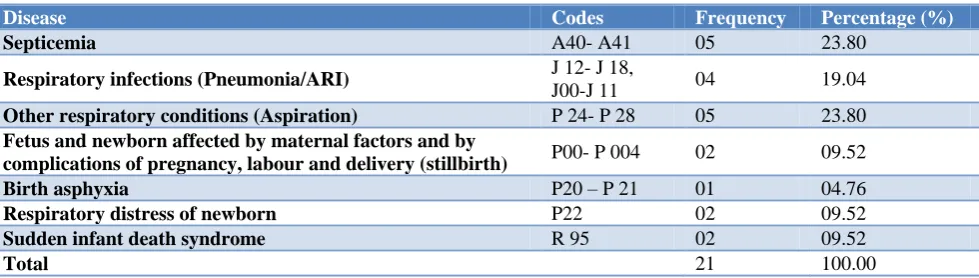
Table 5: Distribution of the assigned causes of neonatal death as per verbal autopsy.
Disease Codes Frequency Percentage (%)
Septicemia A40- A41 05 23.80
Respiratory infections (Pneumonia/ARI) J 12- J 18,
J00-J 11 04 19.04
Other respiratory conditions (Aspiration) P 24- P 28 05 23.80
Fetus and newborn affected by maternal factors and by
complications of pregnancy, labour and delivery (stillbirth) P00- P 004 02 09.52
Birth asphyxia P20 – P 21 01 04.76
Respiratory distress of newborn P22 02 09.52
Sudden infant death syndrome R 95 02 09.52
Total 21 100.00
Table 5 shows that around 05 (23.80%) Neonatal deaths resulted due to Septicemia and other respiratory conditions (Aspiration) each, followed by 04 (19.04%) due to respiratory infections followed by RDS, SIDS and stillbirths which constituted 02 (9.52%) of the total deaths respectively followed by birth asphyxia in 01 case (4.76%).
Table 6: Distribution according to socio-demographic information of post neonatal deaths (n=17).
Frequency N
Percentage (%)
Age
29 days-1 year 09 52.94
>1-5 years 08 47.06
Gender
Male 07 41.17
Female 10 58.83
Religion of the head of household
Hindu 14 82.36
Muslim 03 17.64
Caste
OBC 12 70.58
SC / ST 04 23.52
UR 01 5.89
Education of the respondent Illiterate and literate with
no formal education 08 47.05
Literate, primary or
below 03 17.65
Literate, middle 05 29.41
Graduate and above 01 5.89
BPL card availability
Yes 13 76.47
No 04 23.53
Observations of post neonatal deaths
Out of 42 child deaths, 19 took place in the post neonatal period, out of which 15 died at home, while 2 died during the transit.
Table 6 shows the distribution of deceased children and family according to the socio-demographic characteristics. Out of 17 post neonatal deaths, 9(52.94%) belonged to the age group of 29 days to 1 year and the rest 8 (47.05%) belonged to the age group of 1 to 5 years. Out of 17 deaths, 7 (41.17%) were of males and the rest 10(58.82%) were females. 14 (82.36%) were from the Hindu religion and the rest 3 (17.64%) belonged to Muslim religion. Out of 17 households of deceased, 12 (70.58%) belonged to OBC and 2 (11.76%) each belonged to SC and ST, while the remaining 01 (5.89%) belonged to UR category. Out of 17 respondents, 8 (47.05%) were either illiterate or literate with no formal education. 5 (29.41%) of the respondents were literate and educated up to middle, 3 (17.65%) were literate with education level primary or below and rest 1 (5.89%) respondent was educated up to graduation. Out of 17 households of deceased, 13 (76.47%) were having BPL cards while 4 (23.53%) were not possessing the card.94% of child deaths occur in the family where respondents literacy level up to middle class.
Out of 17 deceased, 7 (41.18%) families were having MCP card, out of which 04 (57.14%) had MCTS number written on MCP card whereas 03 (42.86%) did not have MCTS number on the card. Rest 10 (58.82%) families were not having the card with them and it was either destroyed or lost (Figure 2).
Figure 2: Distribution of post neonatal deaths according to MCP card.
Table 7 shows the distribution of children according to the history related to breast feeding. Out of 17 children, 12 (70.5%) were breast fed immediately within one hour of birth. 3 (17.6%) of them, were breastfed on the same day of birth showing good knowledge and practice regarding breast feeding. Out of 17 children, 11 (64.7%) were exclusively breastfed, while the rest 6 (35.3%) were given other feeds during first 6 months of life. Although initiation of breast feeding is very good (about 85%), more than 1/3rd does not practice exclusive breast feeding for 6 months.
Table 7: Distribution of post neonatal deaths according to breast feeding practices (n=17).
Frequency N
Percentage (%)
Time of initiation of breast feeding Immediately/within one
hour of birth 12 70.5
Same day child was born 03 17.6 Second day or later. 01 5.9
Never breastfed 01 5.9
Exclusive breast feeding in 0-6 months of life
Yes 11 64.7
No 06 35.3
Table 8: Immunization status of the deceased child.
Immunized as per age Yes (%) No (%)
BCG (n=17) 17 (100) 0
DPT (n=10) 09 (90) 01 (10)
OPV (n=10) 09 (90) 01 (10)
Measles (n=07) 06 (85.72) 01 (14.28)
Out of 17 deceased children, all 17 (100%) were vaccinated with BCG. Out of 10 eligible children for DPT and OPV among the deceased, 9 (90%) were immunized with both and 1 (10%) was not immunized. Out of 7 eligible children for measles vaccine, 6 (85.7%) were vaccinated and the rest 1 (14.28%) was not immunized with measles. Inspite of poor health seeking behavior, the immunization status of the children was
found to be adequate which reflects the appropriate services rendered by ASHA/ANM/AWW (Table 8).
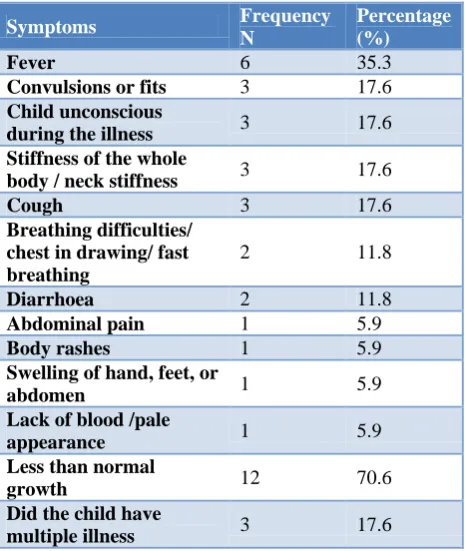
Out of 17 deceased children, 6 (35.3%) were having fever. 3(17.6%) children had episode of convulsions and . 3(17.6%) were unconscious during the sickness that led to death. Out of 16 children, 3 (17.6%) developed neck stiffness/ stiffness of whole body during the illness, 03 (17.6%) developed cough during the sickness, 02 (11.8%) children had complaints of difficulty in breathing/fast breathing/chest in-drawing, wheezing was present in 01 (5.9%) child, 02 (11.8%) had complaints of diarrhea and 01 (5.9%) had complaints of abdominal pain (Table 9).
Table 9: Details of symptoms preceding death (n=17).
Symptoms Frequency
N
Percentage (%)
Fever 6 35.3
Convulsions or fits 3 17.6
Child unconscious
during the illness 3 17.6
Stiffness of the whole
body / neck stiffness 3 17.6
Cough 3 17.6
Breathing difficulties/ chest in drawing/ fast breathing
2 11.8
Diarrhoea 2 11.8
Abdominal pain 1 5.9
Body rashes 1 5.9
Swelling of hand, feet, or
abdomen 1 5.9
Lack of blood /pale
appearance 1 5.9
Less than normal
growth 12 70.6
Did the child have
multiple illness 3 17.6
Table 10: Condition of the child at the time when it was decided for medical consultation (n=17).
Condition of the infant Frequency N
Percentage (%)
Alert/Active/Feeding 6 35.29 Conscious but
drowsy/inactive/unable to feed
3 17.65
Unconscious 1 5.88
N/A (Sudden death at
home) 7 41.18
Body rashes and swelling of hand/foot was found in 1 (5.9%) child, and another 1 (5.9%) child had pale appearance, 12 (70.6%) children were found to have a slower pace of growth than its counter parts. 03 (17.6%) child had history of multiple illnesses. It is a well-known fact that morbidity and mortality are manifold higher in children suffering from malnutrition. In the present study 10
(58.82%)
4 (57.14)%) 3 (42.86)% 7 (41.18%)
MCTS number present MCTS number absent
also, 70.6% children were probably suffering from malnutrition. This indicates towards the need of special care and attention towards children suffering from malnutrition.
7 (41.18%) were sudden home death and did not seek any medical attention, 6 (35.29%) were alert/ active/feeding, 3 (17.65%) were conscious but drowsy/ inactive/ unable to feed, and the remaining 1 (5.88%) was unconscious (Table 10).
Regarding the social history of deceased children’s family, out of 17 families, 4 (23.52%) families had the history of alcoholism, 6 (35.29%) families had the history of smoking and 4 (23.53%) families had history of domestic violence. Out of 4 families that showed history of domestic violence, majority i.e. 3 (75%) belonged to families with deceased female child. Out of 4 households reported to have domestic violence, 3 (75%) had history of alcoholism too.
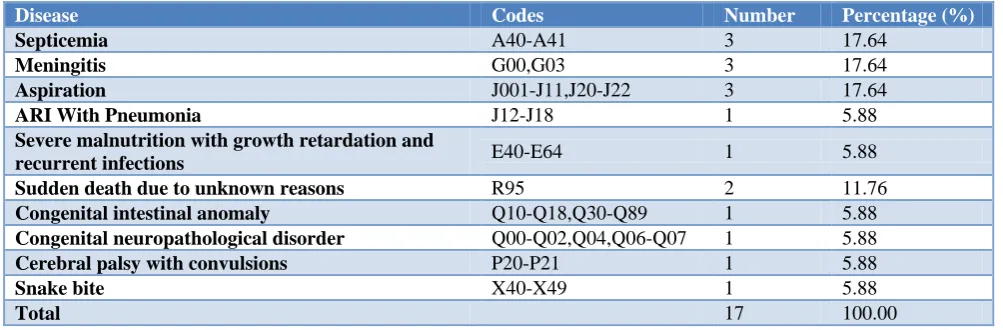
Table 11: Distribution of assigned causes of post neonatal deaths after verbal autopsy.
Disease Codes Number Percentage (%)
Septicemia A40-A41 3 17.64
Meningitis G00,G03 3 17.64
Aspiration J001-J11,J20-J22 3 17.64
ARI With Pneumonia J12-J18 1 5.88
Severe malnutrition with growth retardation and
recurrent infections E40-E64 1 5.88
Sudden death due to unknown reasons R95 2 11.76
Congenital intestinal anomaly Q10-Q18,Q30-Q89 1 5.88
Congenital neuropathological disorder Q00-Q02,Q04,Q06-Q07 1 5.88
Cerebral palsy with convulsions P20-P21 1 5.88
Snake bite X40-X49 1 5.88
Total 17 100.00
Out of 17 deaths, 3 (17.64%) each died due to Septicemia, Aspiration and Meningitis. 2 (11.76%) deaths were sudden due to unknown reasons, while the rest were due to ARI and pneumonia, congenital intestinal anomaly, congenital neuropathological anomaly, cerebral palsy with convulsions, snake bite and severe malnutrition with growth retardation and recurrent infections. Out of 17 deaths covered in the present study, 11 (64.70%) were preventable. Out of 9 deaths belonging to age group 29 days-1 year, 8 (89%) was found to be preventable. 3 (33.33%) cases each of Septicemia and Aspiration, 1 (11.11%) each of Meningitis and ARI with Pneumonia. While in the 8 deaths belonging to the age group of 1-5 years, 3 (37.5%) were found to be preventable 2 (25%) cases of meningitis and 1 (12.50%) case of severe malnutrition (Table 11).
DISCUSSION
In our study, 66.67% were male neonatal deaths highlighting the well-established fact that male gender is biologically more vulnerable than a female gender during neonatal period. MCTS Number is an important no. which denotes that the child is enrolled in the system which helps to back track the child if there is any gap in service delivery. Only 11 (52.38%) families in our study had the MCTS number with them whereas 10 (47.61%) families did not have any record of the MCTS number. Reasons being, in 20% cases the MCP card was destroyed after the death of the neonate, in 20% cases the family had lost the card, in another 20% cases new cards were not available at the time of birth of the neonate and
hence the MCTS no. was not allotted to them, in 20% cases the MCTS number was not entered on the MCP card, in 10% cases, the MCP card was with the ASHA and in the remaining 10% cases, ASHA was on leave at the time of delivery of the neonate and hence MCP card was not made for the child.
In our study, only 03 (14.29%) cases had complications during delivery like prolonged labour (33.3%), excessive bleeding during delivery (33.3%), premature rupture of membrane (33.3%). Our study finding is in accordance to the study done by Samiya et al where the complications during pregnancy were found to be 10-30%.6
In our study, history of feeding was collected from 16 deceased children’s family, of them, 11 (68.75%) were breast fed immediately within one hour of birth. 3 (18.75%) of them, were breastfed on the same day of birth showing good knowledge and practice regarding breast feeding. 62.50% were exclusively breastfed, more than 1/3rd does not practice exclusive breast feeding for 6 months. Our study findings are similar to a study done by Patel et al.7 More than half of mothers (57.5%) started feeding within an hour of birth, and 55.9% gave exclusive breastfeeding for six months.
CONCLUSION
could not recognize symptoms to be severe, early identification of illness and their timely treatment will help in reducing child death.
ACKNOWLEDGEMENTS
I would like to acknowledge my Sincere thanks to NHM, MP for granting us the study and all the ANM/ASHA, who helped us in identifying the household to conduct verbal autopsy.
Funding: NHM, Madhya Pradesh Conflict of interest: None declared
Ethical approval: The study was approved by the Institutional Ethics Committee
REFERENCES
1. Verbal autopsies' show India has averted a million child deaths since 2005. Available at: https://www. reuters.com/article/us-india-health-children/verbal- autopsies-show-india-has-averted-a-million-child-deaths-since-2005-idUSKCN1BU2Y1. Accessed on 25 February 2018.
2. Fadel SA, Rasaily R, Awasthi S, Begum R, Black RE, Gelband H, et al. Changes in cause-specific neonatal and 1–59-month child mortality in India
from 2000 to 2015: a nationally representative survey. The Lancet. 2017;390(10106):1972-80. 3. Child mortality in India, Save the children.
Available at https://www.savethechildren.in/ news/child-mortality-in-india. Accessed on 25 February 2018.
4. Registrar General I. Sample Registration Service Bulletin. SRS Bulletin. 2016: 47.
5. Chandramouli C, General R. Census of India 2011. Provisional Population Totals. New Delhi: Government of India. 2011.
6. Samiya M, Samina M. Identification of High Risk Pregnancy by a Scoring System and its Correlation with Perinatal Outcome. Indian J Pract Dr. 2008;5(1).
7. Patel DV, Bansal SC, Nimbalkar AS, Phatak AG, Nimbalkar SM, Desai RG. Breastfeeding practices, demographic variables, and their association with morbidities in children. Adv Prevent Med. 2015;2015.
Cite this article as: Gour D, Toppo M, Melwani V, Khan A, Dohare P, Dandotiya D. A rapid appraisal of causes of child death in community settings in district Bhopal. Int J Community Med Public Health