Performance Evaluation of Adaptive Rate Control
(ARC) for Burst Traffic over ATM Network
V.Ramesh
Research scholar, Sathyabama University,Chennai & Assoc.Prof, CMRCET, Hyderabad, AP, India.
E-Mail: [email protected]
Dr.P.Subbaiah
Principal, Veerabrahmendra Institute of Technology & Sciences,Badvel,Kadapa-Dt, AP, India. E-Mail: [email protected]
K. Sangeetha Supriya
Asst.Professor, Dept of IT, BVRIT, Narsapur, AP, India. E-Mail: [email protected]
---ABSTRACT--- Many research works have already been done for congestion control and resource management in ATM networks using static and dynamic algorithms. However, no comprehensive scheme has been suggested, which can claim optimized the resource allocations fulfilling the requirements of quality of services (QoS) for existing and incoming sources. The
paper suggests a new approach, which would make the dynamic allocation of resources by controlling the input rate (λ),
output/server rate (µ) and buffer size (χ) individually or in conjunction. The newly proposed approach with dynamical
allocation of resources is much more comprehensive in nature and claims a shorter convergence time than the other previously suggested schemes based on similar dynamic allocation principle. In this paper we describe an Adaptive Rate Control (ARC) implemented to improve the performance of high-speed network to handle burst traffic by guaranteeing the cell loss ratio (CLR) for all cell streams. First, the cases in which a Tahoe, Reno, New Reno, SACK and Plain schemes are applicable in peak-cell-rate (PCR) are discussed. The ARC improves the performance by regulating the increment (up) and the decrease (down) of window size (flow control). Incoming traffic rate, number of cell drop, preset size of the window and estimated delay time are taken into account for this regulation. Simulations are used to investigate how Tahoe, Reno, New Reno, SACK and Plain can conduct, as congestion existed. Then we compare these results from four schemes to the “Plain” scheme (no flow control application) and to the proposed ARC. By altering windows size for the mentioned six schemes, we can obtain the supportive results.
Key words--ARC, Tahoe, Reno, New Reno, SACK, Sliding Windows, ATM network, Quality of Services (QoS), and Comprehensive Dynamic Control Algorithm.
---
Date of Submission: December 07, 2009 Date Accepted: February 17, 2010
---1. Introduction
nly the high-speed network can service traffic. The interface to Asynchronous Transfer Mode (ATM) or the architecture of ATM network would provide a multilevel of services. In Networks as such, the burst information will be segmented into cell and the tremendous number of cells is traversed from sender to the destination via multiple hops transmission in the network. Not all traffic control methods can be applicable to the high-speed networks such as ATM [1] [2].There are many previous studies involving flow control algorithms [3] and a source descriptor [2], however the behavior of each flow control scheme [12] with regulating window sizes is not found. In this paper, we proposed an ARC flow control that improves the performance of high-speed network such as ATM network by altering an appropriate size of the flow control window. Our proposed ARC against four existing flow control schemes that are Tahoe, Reno, New Reno, and SACK [4], [15] plus one “Plain” scheme are discussed. Finally the performance evaluation, especially in term of
throughput, number of cells loss, mean time in queue length and utilization of ATM link, between these six schemes will be compared.
2. The Model of Four Schemes
The principle of ATM traffic flow control is that at connection setup, the user specifies both QoS requirements and using the anticipated traffic characteristic of the connection. Network resources for the connection are assigned on the basis of the source traffic descriptor values and the QoS requirements. If there are not enough network resources, the connection is cancelled. If the connection is accepted, actual amount of the traffic is examined to specify a connection set-up. If the amount of traffic is too large then the connection set-up for the whole is not accepted. But a portion that fits the connection set-up will be accepted then a penalty is imposed on the connection, e.g. some cells from the connection may be discarded.
traffic descriptors are required to be observable and easily adjustable through some mechanisms. The existing congestion avoidance algorithms are discussed. Tahoe algorithm includes slow start, Congestion Avoidance, and Fast Retransmit. The Reno is the enhancement to Tahoe by softening the Fast retransmit process with inclusive Fast Recovery. Selective Acknowledgments (SACK) has been presented to recover multiple segment losses by transmitting a duplicated Acknowledgment. The information contains the out-of-sequence bytes SACK, RFC 2018, [5] has received. SACK also allows the transmitter to reconstruct the information about the non -received bytes at the destination. Farther details can be found in [6][7]. Partial ACK takes Reno out of frame, deflates window size. Sender may have to wait for timeout before proceeding. In new Reno, partial ACK indicates lost packet per round trip time until all lost packets from that window are retransmitted. New Reno also eliminates timeout (RFC 2583) [6]. Consider the Tahoe, Reno and New Reno, and SACK when the burst traffic occurred either in short or long time duration. They start window with an advertised size ranging from 1 to maximum size. It is increase by 1 (slow-start technique) for each successful transmission. When the window is topped up to the maximum size, most of input traffic would be discarded or taped with the reason of capacity exceeding. When this situation occurred, most of window size will start with congestion window (cwnd) size (recovery technique). Cwnd always set to 1 for Tahoe, half of maximum windows size for Reno, New Reno and up to a multiple losses for SACK.
- 2 2 5 -
3. Adaptive Rate Control Scheme
In the proposed ARC, we alleviate the number of cells by shrinking or expanding the window size automatically based upon source rate, cell drop, and cells delay. With ARC algorithm [16], it works, like a control gate for all arriving cells. When cells arrive at gate and if no cell drop presents, the cell will be transmitted immediately (at no delay). If cell drop is present, the dropped cell will be firstly blocked in a cell queue (Qc) and waiting for a chance of
retransmission as ARC finishes regulating the new windows size in order to conquer the cells drop. At the same time to maintain quality of service (QoS), the maximum cell delay time has been defined as CDVT. It means the cells have been waiting in the cell queue longer than CDVT will be discarded finally. Figure-1 illustrates the ARC flow control model for our analysis regarding the cell arriving process, conforming and non-conforming cells, window size adjustment and two states of problem for ARC. In case that the arrival traffic (average arrival cell rate or traffic (λa) is less than the cell drop rate (λp) and cell
drop is not yet present. ARC will initially set window size to be one (the maximum size).
Figure-1 Flow control
On the other hand, if (λa) is larger than (λp), ARC will
regulate the window size with reference to cell drop rate (λp) and arrival traffic rate (λa), ARC will regulate the
window size between one and three (there is the maximum size based on analytical model shown in figure-3). ARC algorithm is shown below.
/********** ARC Algorithm *************/
PROCEDURE
/****** Window Size Calculation *********/ Current allocation rate (Ai);
Current with_size (Wi);
Bandwidth (BW);
Do While Transmission is Ongoning {
IF Cell-Drop λp = AiTHEN {
Calculate new allocation rate (An);
Calculate new win_size (Wn);
Ai = An ; Wi = Wn ;
ELSE {
Ai = ABW; Wi = Wn ; }
} END_DO;
/***Calculate new allocation rate (An) ***/
An = BW * cell_size/(λp)½ ;
/***Calculate current win_size (Wn) ***/
IF Cell-Drop exists THEN {
Wn = Wn++; IF Wn > Win_max THEN Wn = Win_max;
}
ELSE{ Wn = Wn--; IF Wn = 0 THEN Wn = 1; }
/***Calculate available BW (ABW) ***/ ABW = Max_BM – Used_BW;
4. The Model of Plain Scheme
Unlike the proposed ARC, we are neither alleviating the number of cells by shrinking or expanding the window size automatically based upon source rate, cell drop, and cells delay nor applying any four schemes (Tahoe, Reno, New Reno and SACK) in the “Plain” scheme. We want to use this scheme for comparing the performance as well as to study what if all four (control) schemes and ARC are transparent to the system. This will give the idea how much these flow control schemes will help ease the congestion.
Figure-3 Simulation model
5. Simulation
Figure-3 demonstrates a simulation model.
5.1. Input Traffic
The traffic can be basically classified into five categories: Data, Voice, Video, Image and Graphics [14]. This research confines the discussion to mainly data, voice and video. Data sources are generally bursty in nature whereas voice and video sources can be continuous or bursty, depending on the compression and coding techniques used. Continuous sources are said to generate constant bit rate (CBR) traffic and bursty sources are said to generate variable bit rate (VBR) [9] traffic. Hence, only VBR traffic will be considered as an input for the study.
5.2. Characteristics of a Queuing Network Model
There are three components with certain characteristics that must be examined before the simulation models are developed.
5.2.1. Arrival Characteristics
The pattern of arrivals input traffic mostly is characterized to be Poisson arrival processes [11]. Like many random events, Poisson arrivals occur such that for each increment of time (T), no matter how large or small, the probability of arrival is independent of any previous history. These events may be individual cells, a burst of cells, cell or packet service completions, or other arbitrary events.The probability of the inter-arrival time between event t, is
defined by the inter-arrival time probability density
function (pdf). The following formula gives the resulting
probability density function (pdf), which the inter-arrival time t is larger than some value x when the average arrival rate is λ events per second:
e-λt, for t = 0 fx(t) =
0 , for t < 0
p(t = x) = Fx(x) = e-λt dx = 1 - λe-λt
p(t > x) = 1 – Fx(x) = λe-λt
Queuing theorists call Poisson arrivals a memoryless
process, because the probability that the inter-arrival time
will be X seconds is independent of the memory of how much time has already expired. The formula of memoryless process is shown accordingly:
P(x > s + t | X >t) = P(X > s) = e-λt, for s, t >0
This fact greatly simplifies the analysis of random processes since no past history, or memory, affects the processes commonly known as Markov processes. The probability that n independent arrivals occurs in T seconds is given by the formula Poisson distribution:
P(n, T) = (λT)n (e-λt)/n! Where
P(X) = probability of X arrivals,
n = number of arrival per unit of time,
λ = average arrival rate,
E{n/T} = λT = expected value of n for a given interval T, and e = 2.7183
The combination of these two thought in a commonly used model is called the Markov modulated Poisson Process (MMPP) or ON/OFF bursty model. In this paper, the burstiness is varied by altering the TON and TOFF.
5.2.2. Service Facility Characteristics
In this paper, service times are randomly distributed by the
exponential probability distribution. This is a
mathematically convenient assumption if arrival rates are Poisson distributed. In order to examine the traffic congestion at output of ATM like (155.52 Mbps), the service time in the simulation model is specified by the speed of output like, giving that a service time is 2.726 µs per cell.
5.2.3. Source Traffic Descriptor
parameters referring to the ATM forum [10] used in the simulation model is defined below.
• PCR = λa = 1/T in units of cells/second, where T is
the minimum inter cell spacing in seconds (i.e., the time interval from the first bit of one cell to the first bit of the next cell). This research focuses on four cases as follows:
(i) PCR = λa = 423.94 Mbps (999,739
cells/s)
Hence, T=1.0 µs (1/999,739 s).
(ii) PCR = λa = 212 Mbps (499,933 cells/s).
Hence, T=2.0 µs (1/499,933 s).
(iii) PCR = λa = 141.31 Mbps (333,288
cells/s).
Hence, T=3.0 µs (1/333,288 s).
(iv) PCR = λa = 105.9 Mbps (249,966 cells/s)
Hence, T=4.0 µs (1/249,966 s).
• CDVT= t in seconds. This traffic parameter normally cannot be specified by users, but is set instead by the minimum CDVT at a public UNI. For LB mechanism, a single bucket depth of CDVT cells and a normal cell inter arrival spacing T, note that approximately CDVT/T cells can arrive back-to-back.
6. Results
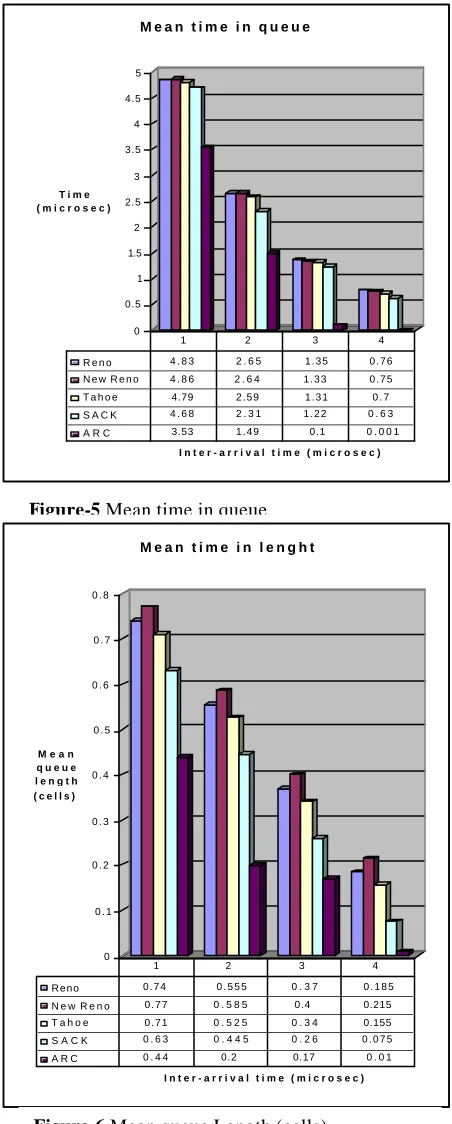
The comparison between four schemes namely Tahoe, Reno, New Reno, SACK, the proposed ARC and the “Plain” scheme is illustrated in graphs. The experiment has been set the maximum window size to be 3 for total six schemes. With the burst/silence ratio 100:0, the average inter-arrival cell rate defines as 1, 2, 3, and 4 µs. Figure-4 illustrates the throughput against inter-arrival cell rate. Figure-5 illustrates mean time in queue length against inter-arrival cell rate. Figure-6 illustrates mean queue length against inter-arrival cell rate. Figure -7 illustrates utilization of link against inter-arrival cell rate and Figure-8 illustrates cell drop against inter-arrival cell rate.
From figure-4, ARC offers the best performance, followed by SACK at any input data rates. Figure-5 describes mean time cells have to reside in the waiting room. Plain scheme gives the longest delay time in queue while ARC contributes the shortest time, followed by four schemes equally. ARC is a disarmingly short network residual time with a higher number of throughputs compared to other four schemes is the poorest as there are huge numbers of
cell waiting in the queue. This would possibly gear to the future bottleneck problem.
Figure-4 Throughput
One of the most successful schemes is ARC by which most of the queue length is trivial, followed by SACK. As a result, the ARC provides a faster traverse time for variation of data rater over the high-speed network. To some extent, the performance ARC provides may be redundant, but from perspective of burst traffics it is clear that many users actually prefer working at a faster speed in transmission. Figure-7 illustrate all schemes keep the high-speed link (155.52 Mbps) busy most of the simulation time duration, especially when the congestion (inter-arrival time = 1 microsecond) nearly approaches.
However, as the input rate drops the ARC seems to perform more efficient then other five schemes. In figure 8, ARC will not have any problems with the dropped cells (cell loss). Plain scheme will and that could be a potential annoyance out of the way. With ARC, there might be an alternative solution to the burst traffics although it may raise some cell loss (but fewer) at the point of congestion.
7. Simulation & Future Work
0 1 2 3 4 5 6 7 8 9 1 0
N u m b e r o f C e l l s ( x 1 0 0 0 0 0 )
I n t e r - a r r i v a l t i m e ( m i c r o s e c )
T h r o u g h p u t
R e n o 6 . 4 4 9 0 2 3 . 2 2 4 5 1 2 . 5 9 7 5 3 1 . 6 1 2 5 5
N e w R e n o 6 . 4 4 9 0 2 3 . 2 2 4 5 1 2 . 5 9 7 5 3 1 . 6 1 2 5 5
T a h o e 5 . 9 3 7 5 5 2 . 9 6 8 7 7 2 . 3 9 1 5 1 1 . 4 8 4 3 8
S A C K 6 . 7 9 0 3 8 3 . 3 9 5 1 9 2 . 7 3 5 2 1 . 6 9 4 5 9
A R C 9 . 3 2 5 2 5 . 5 2 0 0 5 3 . 6 7 1 8 7 2 . 7 5 7 8 1
0 0 . 1 0 . 2 0 . 3 0 . 4 0 . 5 0 . 6 0 . 7 0 . 8 0 . 9 1
M e a n q u e u e l e n g t h ( c e l l s )
R e n o 0 . 8 8 0 . 8 8 0 . 8 8 0 . 8 8
N e w R e n o 0 . 8 8 0 . 8 8 0 . 8 8 0 . 8 8
T a h o e 0.8 0.8 0.8 0.8
S A C K 0 . 9 2 0 . 9 2 0 . 9 2 0 . 9 2
A R C 0 . 9 0 3 0 . 6 4 0.6 0.3
1 2 3 4
0 0.5 1 1.5 2 2.5 3 3.5 4 4.5 5
T i m e ( m i c r o s e c )
I n t e r - a r r i v a l t i m e ( m i c r o s e c )
M e a n t i m e i n q u e u e
R e n o 4 . 8 3 2 . 6 5 1 . 3 5 0 . 7 6 N e w R e n o 4 . 8 6 2 . 6 4 1 . 3 3 0 . 7 5
T a h o e 4.79 2 . 5 9 1 . 3 1 0 . 7
S A C K 4 . 6 8 2 . 3 1 1 . 2 2 0 . 6 3
A R C 3.53 1 . 4 9 0.1 0 . 0 0 1
1 2 3 4
0 0 . 1 0 . 2 0 . 3 0 . 4 0 . 5 0 . 6 0 . 7 0 . 8
M e a n q u e u e l e n g t h ( c e l l s )
I n t e r - a r r i v a l t i m e ( m i c r o s e c )
M e a n t i m e i n l e n g h t
R e n o 0 . 7 4 0 . 5 5 5 0 . 3 7 0 . 1 8 5 N e w R e n o 0 . 7 7 0 . 5 8 5 0.4 0.215 T a h o e 0 . 7 1 0 . 5 2 5 0 . 3 4 0.155 S A C K 0 . 6 3 0 . 4 4 5 0 . 2 6 0 . 0 7 5
A R C 0 . 4 4 0.2 0.17 0 . 0 1
1 2 3 4
Figure-6 Mean queue Length (cells)
Figure 7 Utilization of Link
Figure-5 Mean time in queue
0 1 2 3 4 5 6
N u m b e r o f c e l l s d r o p ( x 1 0 0 0 0 0 )
I n t e r - a r r i v a l e t i m e ( m i c r o s e c )
R e n o 4 . 5 9 1 1 2 . 2 9 5 1 . 0 7 4 0 . 9 1
N e w R e n o 4 . 5 9 1 1 2 . 2 9 5 1 . 0 7 4 0 . 9 1
T a h o e 5 . 1 0 2 6 2 . 5 5 1 1 . 2 8 0 . 9 3
S A C K 4 . 2 4 9 7 2 . 1 2 4 0 . 9 3 6 0 . 8 3
A R C 1 . 7 1 4 9 0 0 0
1 2 3 4
Figure-8 Number of Cells drop
ARC will offer the highest performance in case of congestion (as the input arrival rate of burst traffic is higher than the ATM link capacity). Simulations demonstrate ARC outperforms compared to “Plain” and other four schemes. It does not have to be either costly or complicated but simply allows dropped cells to retransmit by regulating the window
size directly to the arrival rate (?a) and number of dropped
cells.
References
[2] Shigo Shioda and Hiroshi Satio, “Connection Admission Control Guaranteeing Negotiated Cell-Loss Ratio of cell Streams Passing through Usage Parameter Control”, IEICE Trans. Commu, vol E80-B, no. 3, page 399-411, 1997.
[3] Pitiporn P. et. Al, “Performance Comparison of ATM Policy Mechanisms with Telecommunication Traffic” Proceeding of The 6th World Multi-conference on Systematics, Cybernetics and Informatics, pp. 373-378, 2002.
[4] Ghanthiya L. et. Al, “Performance Evaluation for TCP/IP over Satellite Coomunication with Sliding Window Algorithms”, Proceedings of the 4th International Conference on Intelligent Technologies (In Tech’03), pp. 17-24, 2003.
[5] M.Mathis, J. Mahdavi, S. Floyd and A. Romanow, “TPC Selective Acknowledgement Options”, Internetdraft, RFC 2018, 1996.
[6] K. Fall and S. Floyd, “Simulation-based comparisons of Tahoe, Reno and SACK TCP” Computer Communication Review, vol 26, pp. 5-21, RFC 2583, 1996.
[7] Dannis Yang, “TCP Performance and flow control”, Candle computer report, vol 22. no 2, 2000.
[8] Steven Low, “Equilibrium & Dynamic of TCP/AQM”, Sigeomm, 2001.
[9] D. D. , Kovatsos, “Performance Modelling and Evaluation of ATM Networks,” vol. 1. Chapman & Hall, 1995.
[10] ATM Forum, “User-netwrok interface (UNI) Specification version 3.1,” The ATM Forum Technical Committee, Prentice Hall, 1995.
[11] B. Khoshnevis, “Discrete System Simulations,” McGraw-Hill, 1994.
[12] E. P. Rathgeb, “Modelling and Performance comparis on of policing mechanisms for ATM networks,” IEEE Journal on selected area in communication, vol. 9, No 3, pp. 325-334, 1991.
[13] M.Aida and H. Saito, “Traffic contract parameters and CAC guaranteeing cell-loss ratio in ATM networks,” IEICE Trans. Commu., vol. E78-B, no.1, 1995.
[14] S.S. Al-Wakeel; N-E. Rikli; and A.A. Al-Wehaibi, “Evaluation of Faimess Strategies for ATM Congestion Control Policing Mechanisms,” IACTED Proceeding of International Conference on Applied Modeling & Simulation (AMP’99), 1999.
[15] Ghanthiya L. et. Al, “Evaluation of Over Satellite Network with the Proposed Sliding Window Algorithms,” Proceedings of the 6th IEEE International Conference on Advanced Communication Technology (ICACT’04), pp. 917-922, 2004.
[16] S. Prahmkaew et. Al, “A Study of Adaptive Rate Algorithm in ATM Network Flow Control,” Proceedings of the International Conference on Parallel and Distributed Proceeding Techniques and Applications (PDPTA’04), pp. 668-673, 2004.
[17] S. Prahmkaew et. Al, “BTSent: Model and Usage of Regular Traffic Patterns in Bangkok for Mobile Ad Hoc Netwroks and Inter-Vehicular Communications,” Proceedings of the International Mobility Conference (MobiCon’04), Sl-4, pp. 1-9, 2004.
Author’s Biography:
Mr.V. Ramesh received his B.Tech from
N.B.K.R.I.S.T, Vidyanagar, AP in Computer Science & Engineering and M.Tech in IT from Sathyabama University, Chennai. Presently he is working as Associate Professor at CMRCET, Hyderabad, AP. He has published several papers in various International & National Conferences and Journals. Presently he is pursuing his Ph. D in the field of Ad-hoc networks at Sathyabama University. His research interests include Operating Systems, Computer Networks and Data Mining.
Dr P. Subbaiah received M.Tech(D.S.C) from
JNTU and Ph. D from S.K University, Ananthapur in the area of fault tolerant systems. He has published several papers in international, national conferences and journals. He guided 6 research scholars. Presently he is working as Principal at Veerabrahmendra Institute of Technology & Science,Kadapa,AP, India. His research interests include Mobile ad-hoc networks, Digital image processing and VLSI design.
Mrs K. Sangeetha Supriya, working as