Original Research Article
Nutritional status of 1-5 years children in the urban slum area of
Jagdalpur city, Bastar region, Chhattisgarh
Q. H. Khan*, Garima Arora, Susheel Kumar Nalli
INTRODUCTION
Children constitute the most vulnerable segment of any community. Their nutritional status is a sensitive indicator of child health. Growth during childhood is widely used to assess adequate health, nutrition and development of children.
Malnutrition is one of the major global public health problem.1 Malnutrition has both short and long term consequences associated with ill health and mortality.2 In the long term it leads to impaired organic developments, poorer educational achievements and economic productivity.3 Chronic under-nutrition is associated with
serious health impairment in the later phases of life which ultimately reduces the quality of life of the individual. India has the highest no. of undernourished children in the world. As of year 2011, 40% of the under-fives are in India are underweight compared to 15.7% in the world.4 Even Indian infants begin life with a disadvantage due to intrauterine growth; at birth 1/3rd of the Indian infants are underweight and 20% are stunted.5 Another important consideration in interstate variation in the prevalence of under nutrition, as per NFHS-III state like Kerala have half the prevalence underweight as compare to the state like Chhattisgarh where it is up to 47%.6
ABSTRACT
Background: Nutritional status is the best indicator of the child health. Malnutrition has both short and long term adverse ramifications. As per NFHS III 47% children are stunted in the state of Chhattisgarh. However still many communities in the tribal dominated and naxal affected state may remain affected, hence the study was planned to identify the nutritional status of children and find out its determinant.
Methods: Present cross-sectional study was conducted among 12-59 months children in the urban slum of Jagdalpur city, Bastar region of Chhattisgarh. Predesigned and pretested questionnaire was administered to the caregiver of the child, information on socio-demographic characteristics was obtained and anthropometric measurements were taken. Statistical Analysis: all frequencies were derived for completeness of data. WHO Anthro Software version 3.1.0 was used to classify the malnutrition status. Chi-square test was applied to find association between dependent variables.
Results: Out of 225 children 53.3% were boys and 46.7% were girls. The overall prevalence of underweight stunting and wasting was 28.4%, 41.3%, and 19.1% respectively.
Conclusions: Prevalence of underweight has reduced in the district over a period of years. However high level of stunting, a sign of chronic hunger points towards the pivotal role of socio-demographic and behavioral practices prevalent in the district. Interaction with health system in the form of ANC, institutional delivery and safeguarding effective 100% immunization coverage has shown preventive effect.
Keywords: Nutrition, Underfive, Urban-slum, Tribal
Department of Community Medicine, LtBRKM Government Medical College, Jagdalpur, Chhattisgarh, India
Received: 15 January 2018
Accepted: 10 February 2018
*Correspondence:
Dr. Q. H. Khan,
E-mail: [email protected]
Copyright: © the author(s), publisher and licensee Medip Academy. This is an open-access article distributed under the terms of the Creative Commons Attribution Non-Commercial License, which permits unrestricted non-commercial use, distribution, and reproduction in any medium, provided the original work is properly cited.
Slums are characterized by overcrowding; filth, inadequate water supply, poor dwelling and poverty; leading to poor health for the urban dwellers.6 According to Gould et al the effects of the unhealthy living conditions in slums include diarrhea outbreaks for long periods of time which leads to instances of malnutrition, poor health and death among young children.7 Chhattisgarh carved out state has 37% of the tribal population8. Rao et al documented under nutrition among under-fives as high as 60% in the tribal part of the Madhya Pradesh. However, there are still many communities left untouched each of them having their own unique socio-cultural milieu. Hence the current study was planned to identify the nutritional status and its determinants among the under-five children.
METHODS
A survey based cross sectional study was conducted in the field practice area of Department of community medicine from November-2013 to February-2015 in an urban slum of Jagdalpur city of Bastar district in Chhattisgarh with population of 115479. Children in the age group of 12 - 59 months were included in the study. Study area is the resettlement for migrants from adjacent states of Andhra Pradesh and Odisha along with native primitive tribal groups like Madiya, Goand and Halbi.
Sample size
Using the formula, 2
4pq n
l
Where p = 47% under nutrition, q= Alternate probability of prevalence, l = probable error.
n= 225 under five children. (proportion of stunting in less than 3 years of age as per NFHS III factsheet for the state) with 15% permissible error and 95% confidence interval total sample size (n) required was 203 we added 10% non-response hence final sample size came to 225. The required numbers of subjects were obtained from all notified and non-notified slums of jagdalpur city by probability proportionate to sample size method. Only those respondents who were residing in the area for the last six months or more were included in the study. After taking informed consent from parent or caregiver pre-tested structured questionnaire was used to elicit the information. Information on various socio-demographic factors was collected. Institutional ethical committee approval was obtained before initiating the study. Anthropometric measurements were recorded using standard techniques. Weight was measured without any footwear and with minimal clothing nearest to 0.1kg using standard portable weighing machine (smart care electronic scale – Model No SCG 2006A6-1). Height: the length for children aged 1-2 years was measured using an
infantometer. The child was placed on the board with head positioned firmly against the fixed head board, knees extended by firm pressure and feet fixed at right angles to the lower leg board. Then the upright foot piece was moved to obtain firm contact with the heels and the length was measured to the nearest 0.5 cm. for children between 2-5 years, standing height was measured without any footwear to the nearest 0.5 cm using a standard calibrated bar. The children were made to stand straight with heels, buttocks, shoulders and back of head touching the rod. Head was held comfortably erect with the lower border of orbit of eye in the same horizontal plane as external canal of the ear and the arms hanging loosely by sides with palms facing the thigh. The head piece was then lowered gently making contact with the top of head. Prevalence of malnutrition (stunting, wasting and underweight) by age and sex classification was based on WHO reference curves.
Variables and measurements
The analysis focuses on the effect of mother‟s education on child stunting. The dependent variable is stunting; measured by height for age z-scores (HAZ). The HAZ were generated using the WHO 2006 growth standards with WHO Anthro 2005 program, beta version (WHO 2006). The variable was coded as “1” (stunted) if HAZ was <-2, and “0” (not stunted) if HAZ was ≥-2. Similarly we identified underweight by weight for age Z scores and wasting by weight for height Z scores.
Statistical analysis
Data was entered and analyzed by SPSS version 18.0. Data sheet, analyzed and interpreted in terms of Mean, Standard deviation and percentages where appropriate. Chi-square test was used to find out the association between dependent variables with outcome and p<0.5 was used as definition of statistical significance. WHO Anthro software version 3.1.0 was used to classify the malnutrition status. The height and weight of each child was compared with the WHO child growth standards, 2006 reference data for that particular age and sex to get weight for age, height for age and weight for height indices. Children below two standard deviation of the reference median on any of these indices was considered as malnourished and termed as underweight, stunted and wasted respectively.9
RESULTS
Out of the total 225 children in the study population, there were 53.3% boys and 46.7% girls. Further the results reveal that overall prevalence of underweight, stunting and wasting were 28.4%, 41.3% and 19.1% respectively.
wasting and underweight was more among boys, children from joint families, below poverty level, scheduled cast and scheduled tribes. Whereas proportion of wasting was more among girls compared to boys. Factors like children from scheduled cast and tribes and BPL families were
found to be statistically significant (p<0.05). We also found that children from families having sanitary toilet facilities has lesser proportions of stunting, wasting and underweight and was found to be statistically significant with poor nutritional outcomes (p<0.05).
Table 1: Socio-demographic and behavioural factors associated with nutritional status.
Variables Stunting (%) Wasting (%) Underweight (%)
Sex Male 55 (45.8) 21 (17.5) 33 (27.5)
Female 38 (36.2) 22 (21.0) 31 (29.5)
Type of family Joint 53 (40.8) 22 (16.9) 28 (21.5)
Nuclear 40 (42.1) 21 (22.1) 36 (37.9)
Ration card Antodayee/BPL 29 (45.3) 16 (25.0) 26 (40.6)
APL 64 (60.2) 27 (16.7) 38 (23.6)*
Caste*
Open 34 (37.0) 17 (18.5) 28 (30.4)
OBC 22 (34.4) 12 (18.8) 15 (23.4)
SC 18 (66.7) 5 (18.5) 9 (33.3)
ST 14 (53.8) 6 (23.1) 8 (30.8)
Other 5 (31.3) 3 (18.8) 4 (25.0)
Sanitary toilet facility
Present 69 (38.1) 30 (16.6) 47 (26.0) Absent 24 (54.4)* 13 (29.5)* 17 (38.6)*
Washing hand with soap
Present 66 (37.7) 30 (17.1) 50 (28.6) Absent 27 (54.0)* 13 (26.0) 14 (28.0)
Note: 1. Wherever the expected value of a cell was <5, Fisher Exact test was used; 2. Figures in the parenthesis indicate percentage & * shows p<0.05.
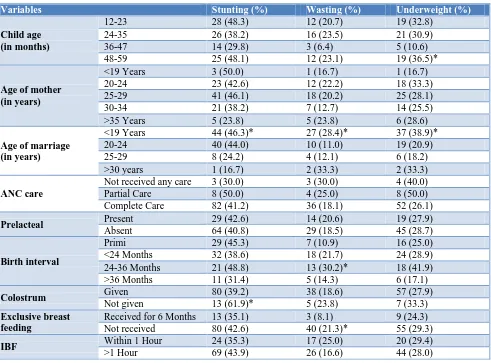
Table 2: Maternal and child factors associated with nutritional status.
Variables Stunting (%) Wasting (%) Underweight (%)
Child age (in months)
12-23 28 (48.3) 12 (20.7) 19 (32.8) 24-35 26 (38.2) 16 (23.5) 21 (30.9)
36-47 14 (29.8) 3 (6.4) 5 (10.6)
48-59 25 (48.1) 12 (23.1) 19 (36.5)*
Age of mother (in years)
<19 Years 3 (50.0) 1 (16.7) 1 (16.7) 20-24 23 (42.6) 12 (22.2) 18 (33.3) 25-29 41 (46.1) 18 (20.2) 25 (28.1)
30-34 21 (38.2) 7 (12.7) 14 (25.5)
>35 Years 5 (23.8) 5 (23.8) 6 (28.6)
Age of marriage (in years)
<19 Years 44 (46.3)* 27 (28.4)* 37 (38.9)* 20-24 40 (44.0) 10 (11.0) 19 (20.9)
25-29 8 (24.2) 4 (12.1) 6 (18.2)
>30 years 1 (16.7) 2 (33.3) 2 (33.3)
ANC care
Not received any care 3 (30.0) 3 (30.0) 4 (40.0) Partial Care 8 (50.0) 4 (25.0) 8 (50.0) Complete Care 82 (41.2) 36 (18.1) 52 (26.1)
Prelacteal Present 29 (42.6) 14 (20.6) 19 (27.9)
Absent 64 (40.8) 29 (18.5) 45 (28.7)
Birth interval
Primi 29 (45.3) 7 (10.9) 16 (25.0)
<24 Months 32 (38.6) 18 (21.7) 24 (28.9) 24-36 Months 21 (48.8) 13 (30.2)* 18 (41.9) >36 Months 11 (31.4) 5 (14.3) 6 (17.1)
Colostrum Given 80 (39.2) 38 (18.6) 57 (27.9)
Not given 13 (61.9)* 5 (23.8) 7 (33.3)
Exclusive breast feeding
Received for 6 Months 13 (35.1) 3 (8.1) 9 (24.3) Not received 80 (42.6) 40 (21.3)* 55 (29.3)
IBF Within 1 Hour 24 (35.3) 17 (25.0) 20 (29.4)
Variables Stunting (%) Wasting (%) Underweight (%)
Immunization
Unimmunized 15 (46.9) 07 (21.9) 11 (34.4) Full Immunization 44 (35.5) 19 (15.3) 26 (21.0) Partial Immunization 34 (49.3) 17 (24.6) 27 (39.1)
Measles Vaccinated 73 (38.4) 35 (18.4) 49 (25.8)
Unvaccinated 20(57.1)* 8(22.9) 15(42.9)*
Note: 1. Wherever the expected value of a cell was <5, Fisher Exact test was used; 2. Figures in the parenthesis indicate percentage & * shows p<0.05.
It was observed that proportion of wasting, stunting and underweight was more among children of mothers having marriage age less than 19 years, lack of ante natal care, birth interval less than 36 months, child deprived of colostrum, absence of exclusive breast feeding for less than 6 months and not vaccinated against measles. Out of which, except lack of ANC other factors were found to be statistically significant (p<0.05) (Table 2).
DISCUSSION
Malnutrition is the central dogma of all the childhood illnesses. 27% of Indian children are low birth weight. Though malnutrition is cellular imbalance between the supplies of nutrients and body‟s demand for them to ensure growth, maintenance and specific functions but its origin lies in factors like faulty cultural practices like deprivation of child from colostrums, absence of exclusive breast feeding practices, wrong feeding practices and lack of health care seeking behavior aggravates the condition. We initiated the study among under-five children from urban slum area. Slums are disadvantaged with filth, lack of drinking water facilities, overcrowding and absence of health care facilities. Present study shows prevalence of underweight, stunting and wasting were 28.4%, 41.3% and 19.1% respectively. Renuka et al identified the prevalence of underweight, stunting and wasting of 38.6%, 36.8% and 18.6% respectively.10 Raoetal found underweight, stunting and 33.9%, 21.5% and 6.4% among children of leoramandi tribes.11 NFHS III findings showed underweight of 48%, stunting of 53% and wasting of 24% among 0-59 months of children.6 Though we found that the overall prevalence of stunting and wasting was less among the study population it was still comparable with the studies across the country. Whereas the less prevalence of underweight among the study participants can be attributed to factors such as lacunas in implementation of government nutrition schemes, deficiencies in the public distribution system, peri-urban area and rise in literacy level.
The cultural practices always favor male child. But we could not find any association between sex of the child and nutritional status. Similar finding was shared by Bhavsar et al, Child feeding practices has a large impact on their nutritional status.12 It was observed that children who were deprived of colostrum were 61.9% stunted, 23.8% wasted, and 33.3% underweight. Out of which, stunting was found to be significantly associated
(p<0.05). Goel et al observed the same findings where children were breastfed after 6 months and deprived of colostrum are prone for malnutrition.13 Exclusive breastfeeding was advocated universally but NFHS III documented only half of the children are breastfed.6 In our study we identified significant association of wasting with non-exclusive breastfeeding of infant for 6 months (p<0.05). Chakraborty et al showed similar results while finding influence of infant feeding practices over nutritional status of children in shabar tribal community in Odisha.14
Vaccination provides protection against morbidity and this in long run improves nutrition status as repeated illness leads to deterioration of health. In our study we found proportion of stunting 57.1% and underweight 42.9% more among children who were not vaccinated for measles as compared to children who were vaccinated. Zafar et al obtained similar findings while observing effect of vaccination on nutritional status of pre-school children in rural and urban Lucknow.15
The economic status of a household is also one of the most important determinants of child nutritional status (UNICEF 1990). In our study the proportion underweight was 40.3% among the children of BPL families whereas it was half among APL counterparts. Comparative studies on child nutrition among more than 15 countries (Sommerfelt et al) showed that the higher the level of economic status of the household, lower the level of child stunting.16
CONCLUSION
ACKNOWLEDGEMENTS
The author‟s whole heartedly acknowledges the respondents for taking part in the interview and sharing their experiences. Our special thanks to students of 2012 batch who participated enthusiastically and worked hard.
Funding: No funding sources Conflict of interest: None declared
Ethical approval: The study was approved by the Institutional Ethics Committee
REFERENCES
1. Medhin G, Hanlon C, Dewey M, Alem A, Tesfaye F, Worku B, et al. Prevalence and predictors of undernutrition among infants aged six and twelve months in Butajira, Ethiopia: The P-MaMiE Birth Cohort. BMC Public Health. 2010;10:27.
2. WHO: World Health Report 2002; Reducing Risks Promoting Healthy Life Geneva;UN: 2004.
3. Victora CG, Adair L, Fall C, Hallal PC, Martorell R, Richter V, et al. Maternal and child undernutrition: consequences for adult health and human capital The Lancet. 2008;371(9609):340–57.
4. World Bank 2012. Malnutrition Prevalence, (Weight for Age) of Underfive children. https://data.worldbank.org/indicator/SH.STA.MAL N.ZS. Accessed on 10 may 2015.
5. Ramachandran P. Nutrition transition in India 1947-2007. http://nutritionfoundationofindia.res.in/ Nutri-tionTransition.asp. Accessed on May 2015.
6. Kimani-Murage EW, Ngindu AM. Quality of water the slumdwellers use; the case of Kenyan slum. J Urban Health. 2007;84:829.
7. Gould WT. African mortality and the new „urban penalty‟. Health and Place. 1998,4(2):171-81. 8. National family health survey, 2005-2006
(NFHS-3).
9. WHO 2006, WHO child growth standards, length/height-for-age, age, weight-for-length, weight-for-height and body mass index-for-age Methods and development.
10. Renuka M, Rakesh A, Babu NM, Santosh KA. Nutritional status of Jenukuruba preschool children in Mysore district, Karnataka. IJRRMS. 2011:1(1):12-7.
11. Rao VG, Yadav R, Bhondeley MK, Das S, Agrawal MC, Tiwary RS. Worm infestation and anaemia: a public health problem among tribal pre-school children of Madhya Pradesh. J Commun Dis. 2002;34(2)100-5.
12. Bhavsar S, Mahajan H, Kulkarni R. Maternal and Environmental factors affecting nutritional status of children in Mumbai Slum. IJSRP. 2012;2(11):1-9. 13. Kumar D, Goel NK, Mittal P. Influence of infant
feeding practices in nutritional status of underfive children. Indian J of Pediatr. 2006;73(5):417-21. 14. Chakraborty S, Ghosh R, Bharti P. Breastfeeding
practices and nutritional status of preschool children among shabar tibal community in Orissa, India. Proceedings of National Symposium in Tribal Health; 2006: 227-234.
15. Abedi AA, Shrivastav JP. The effect of vaccination on nutritional status of preschool children in rural and urban Lucknow. J Acad Indus Res. 2012;1(4):173-5.
16. UNICEF 1990, Strategies of improving nutrition of children and women in developing countries. New York: UNICEF.
Cite this article as: Khan QH, Arora G, Nalli SK. Nutritional status of 1-5 years children in the urban slum area of Jagdalpur city, Bastar region,