Themed Section : Science and Technology DOI : https://doi.org/10.32628/IJSRSET11841111
Development of Validated Stability Indicating HPTLC Method for
Assay of Ozagrel and its Pharmaceutical Formulations
Vishal N Kushare1, Sachin S Kushare2
1N.D.M.V.P Institute of Pharmaceutical Science, Adgaon Nashik, Maharashtra, India
2Department of chemistry, Research Center, HPT arts RYK Science College, Nashik, Maharashtra, India
ABSTRACT
The present paper describes stability indicating high-performance thin-layer chromatography (HPTLC) assay method for Ozagrel in bulk drugs. The method employed TLC aluminium plates precoated with silica gel 60F-254 as the stationary phase. The solvent system consisted of toluene: methanol: triethylamine (6.5: 4.0: 0.1 v/v/v). The system was found to give compact spot for Ozagrel (Rf value of 0.40 0.010). Densitometric analysis
of Ozagrel was carried out in the absorbance mode at 280 nm. The linear regression analysis data for the calibration plots showed good linear relationship with r2 = 0.999 with respect to peak area in the concentration range 30 - 120 ng/spot. The developed HPTLC method was validated with respect to accuracy, precision, recovery and robustness. Also to determine related substance and assay determination of Ozagrel that can be used to evaluate the quality of regular production samples. The developed method can also be conveniently used for the assay determination of Ozagrel in pharmaceutical formulations. The limits of detection and quantitation were 4.069 and 12.332 ng/spot, respectively by height. Ozagrel was subjected to acid and alkali hydrolysis, oxidation, photochemical and thermal degradation. The drug undergoes degradation under acidic, basic, oxidation and heat conditions. This indicates that the drug is susceptible to acid, base hydrolysis, oxidation and heat. Statistical analysis proves that the method is repeatable, selective and accurate for the estimation of said drug. The proposed developed HPTLC method can be applied for identification and quantitative determination of Ozagrel in bulk drug and tablet formulation.
Keywords : Ozagrel, validation, HPTLC
I.
INTRODUCTIONHigh Performance Thin Layer Chromatography (HPTLC) is the most powerful advanced form of Thin Layer Chromatography (TLC) and consists of chromatographic layers of utmost separation efficiency and the application of sophisticated instrumentation for all steps in the procedure include accurate sample application, standardized reproducible chromatogram development and software controlled evaluation. HPTLC is a concept that includes a widely standardized methodology
based on scientific facts as well as the use of validated methods for qualitative and quantitative analysis .
HPTLC meets all quality requirements for today’s
analytical labs, to increase the resolution and to allow more accurate quantitative measurements.
higher detection sensitivity, and improved in situ quantification and are used for industrial pharmaceutical densitometric quantitative analysis. Normal phase adsorption TLC on silica gel with a less polar mobile phase, such as chloroform– methanol, has been used for more than 90% of reported analysis of pharmaceuticals and drugs.
The selection of mobile phase is based on adsorbent material used as stationary phase and physical and chemical properties of analyte. The mobile-phase systems are used based on their diverse selectivity properties are diethyl ether, methylene chloride, and chloroform combined individually or together with hexane as the strengthadjusting solvent for normal-phase TLC and methanol, acetonitrile, and tetrahydrofuran mixed with water for strength adjustment in reversed-phase TLC. Separations by ion pairing on C-18 layers are done with a mobile phase such as methanol–0.1 M acetate buffer (pH 3.5) containing 25 mM sodium pentanesulfonate (15.5:4.5).
II.
EXPERIMENTAL WORK❖ Standard Solutions
• Solution A (Stock Standard Solution)
Accurately weighed quantity of Ozagrel (10.0 mg) was dissolved in methanol to make 10.0 ml solution. (conc.: 1.0 mg/ml).
• Solution B (Working Standard Solution)
Accurately measured 1.0 ml of solution A was diluted to 100.0 ml with methanol (conc.: 10.0 g/ml).
❖ Optimization of chromatographic conditions
• Optimization of mobile phase
Aliquot portions of working standard solution (5 μl)
were applied on TLC plates. Various pure solvents with varying polarity and their mixtures were tried for optimum movement of drug with sharp symmetrical peak. After trying several permutations and combinations, the mobile phase containing toluene: methanol: triethylamine (6.5: 4.0: 0.1 v/v/v) was found to be most satisfactory as it gave sharp
symmetrical peaks for the drug with RF values 0.40
0.010.
• Optimization of wavelength for densitometric evaluation
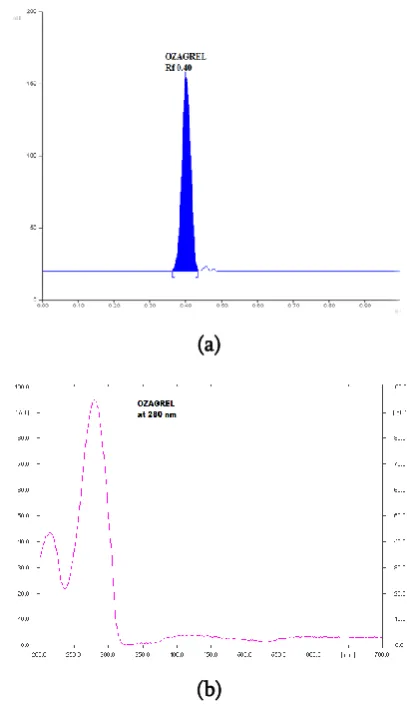
Aliquot portion of working standard solution B (5 μl) was applied on TLC plate. The plate was developed using optimized mobile phase. After development, the plate was removed and dried with the help of hair dryer. The migrated band was scanned over the wavelength range 200- 400 nm in an absorbance/reflectance mode and an in situ UV-absorption spectrum of drug was obtained.
A 280.0 nm was selected as scanning wavelength as it gave maximum absorption for the drug.
(a)
(b)
Figure 1 : (a) HPTLC chromatogram and (b) In situ
UV Spectrum of Ozagrel
• Chamber saturation time
time with vapours of mobile phase in twin trough chamber and then developing them using optimized mobile phase. The optimum saturation time was found to be 15 min, which resulted in to dense and compact spot.
On the basis of exhaustive experimentation the chromatographic conditions optimised are as follows:
Stationary Phase
Pre-coated Silica Gel 60 F254 TLC Plate (10 x10 cm)
Thickness 200 mm
Mobile Phase Toluene Methanol Mode of Application Band
Band Width 5mm Sample Volume 5 ml Separation Technique Ascending
Development Chamber
Twin trough glass chamber , 10 x 10 cm Chamber Saturation
Time 15 min Migration Distance 90 mm
Detection
UV Densitometric Scanning
Scanning Mode Absorbance/ Reflectance Scanning Wavelength 280.0 nm
Scanning Speed 20 mm/s Slit Dimension 4.0 x 0.45 mm Temperature 25 ± 3 °C
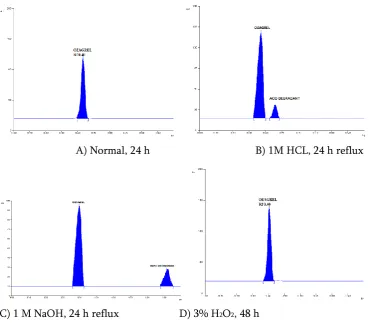
The samples of stress studies were spotted (5 l bands) on TLC plates and developed and scanned under optimized conditions. The study has shown adequate resolution of parent drug and its degradation products from one another under optimized chromatographic conditions by normal phase mode. Hence these chromatographic conditions were finalized for further experimentation.
A) Acid (1M HCL, 24 h reflux) and Spectra of degradant
C) Neutral stress, 24h reflux
D) Oxidative stress (3% H2O2,48 h at R.T.)
E) Photolytic Stress, (15 days, 4 lac lux h) F) Thermal Stress (dry heat, 15 days at 700c Figure 2 : HPTLC chromatograms of forced degraded
samples (A-F).
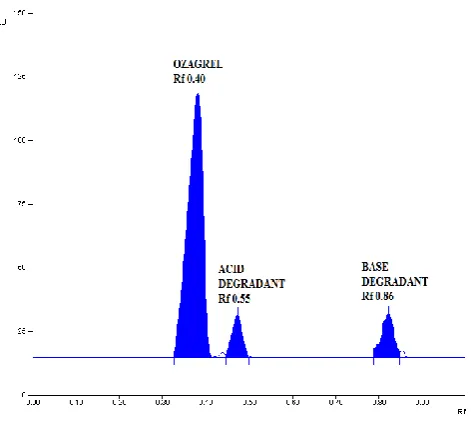
Figure 3 : Chromatogram of mixed degradation sample
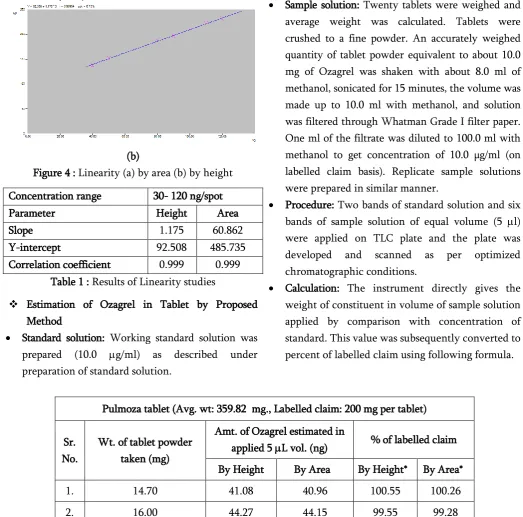
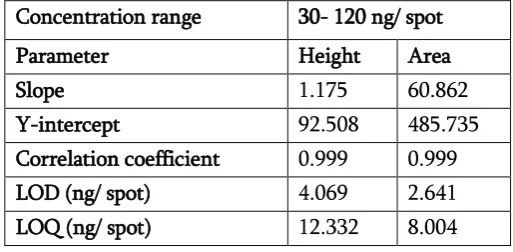
❖ Study of Linearity of response
Aliquots portions of standard solution B (3-12 l) were applied on TLC plate and chromatograms were developed under optimized chromatographic conditions. The linear regression curves are depicted along with correlation coefficient, slope and y-intercept. The curves were found to be linear between concentration ranges 30-120 ng/spot.
(b)
Figure 4 : Linearity (a) by area (b) by height
Concentration range 30- 120 ng/spot Parameter Height Area Slope 1.175 60.862 Y-intercept 92.508 485.735 Correlation coefficient 0.999 0.999
Table 1 : Results of Linearity studies
❖ Estimation of Ozagrel in Tablet by Proposed Method
• Standard solution: Working standard solution was prepared (10.0 g/ml) as described under preparation of standard solution.
• Sample solution: Twenty tablets were weighed and average weight was calculated. Tablets were crushed to a fine powder. An accurately weighed quantity of tablet powder equivalent to about 10.0 mg of Ozagrel was shaken with about 8.0 ml of methanol, sonicated for 15 minutes, the volume was made up to 10.0 ml with methanol, and solution was filtered through Whatman Grade I filter paper. One ml of the filtrate was diluted to 100.0 ml with methanol to get concentration of 10.0 µg/ml (on labelled claim basis). Replicate sample solutions were prepared in similar manner.
• Procedure: Two bands of standard solution and six bands of sample solution of equal volume (5 l) were applied on TLC plate and the plate was developed and scanned as per optimized chromatographic conditions.
• Calculation: The instrument directly gives the weight of constituent in volume of sample solution applied by comparison with concentration of standard. This value was subsequently converted to percent of labelled claim using following formula.
Pulmoza tablet (Avg. wt: 359.82 mg., Labelled claim: 200 mg per tablet)
Sr. No.
Wt. of tablet powder taken (mg)
Amt. of Ozagrel estimated in
applied 5 L vol. (ng) % of labelled claim By Height By Area By Height* By Area* 1. 14.70 41.08 40.96 100.55 100.26 2. 16.00 44.27 44.15 99.55 99.28 3. 18.30 50.82 50.94 99.92 100.15 4. 21.20 58.87 59.14 99.91 100.37 5. 22.70 62.99 62.75 99.84 99.46
* Each value is mean of five observations
Mean 99.95 99.90 ±S.D. 0.365 0.497 % RSD 0.365 0.498
VALIDATION
❖ Validation of the proposed method
Validation of proposed method was ascertained on the basis of accuracy, precision, linearity & range, limit of detection, limit of quantitation, specificity, ruggedness and robustness.
❖ Accuracy: Accuracy of the proposed method was ascertained on the basis of recovery studies performed by standard addition method.
• Standard solution: Working standard solution was prepared (10.0 g/ml) as described under preparation of standard solution.
• Sample solution: Accurately weighed quantities of pre-analyzed tablet powder equivalent to about 7.0 mg of Ozagrel were transferred to five different 10.0 ml volumetric flasks and 1.5 mg, 3.0 mg, 4.5 mg and 6.0 mg of standard Ozagrel were added to 2nd, 3rd, 4th & 5th flask respectively (representing 70- 130% of labelled
claim). This was followed by addition of methanol to make volume to about 8.0 ml in each flask, and the contents were shaken and sonicated for 15 minutes. Sufficient methanol was added to each flask to adjust the volume to 10.0 ml mark and filtered. One ml of each of the filtrate was diluted to 100.0 ml with methanol.
• Procedure: Same as described under estimation of Ozagrel in tablet. (p.no: 59)
• Calculation: Amount of Ozagrel (ng/5µl) obtained from instrument was converted to total drug estimated by using following formula:
Vs
1000
T
=
Ew
The percent recovery was then calculated using the formula:
100
C
B
-T
Recovery
%
=
where,
T = total drug estimated (mg)
EW = Wt. (µg) of drug calculated by instrument in Vs
Vs = Volume (µl)of sample solution applied
B = amount of drug contributed by pre-analyzed tablet powder (mg) C = weight of pure drug added (mg)
Pulmoza tablet (Avg. Wt: 359.82 mg., Labelled claim: 200 mg per tablet)
Flask No.
Wt. of tablet powder taken (mg) + Amt of pure drug added (mg)
(% of labelled claim)
Amt. of Ozagrel estimated in
applied 5L vol. (ng) % Recovery
* Each value is mean of five observations
Mean 100.00 100.08 ±S.D. 0.634 0.872 %RSD 0.634 0.872 Table 3 : Results of recovery studies of Ozagrel in tablet
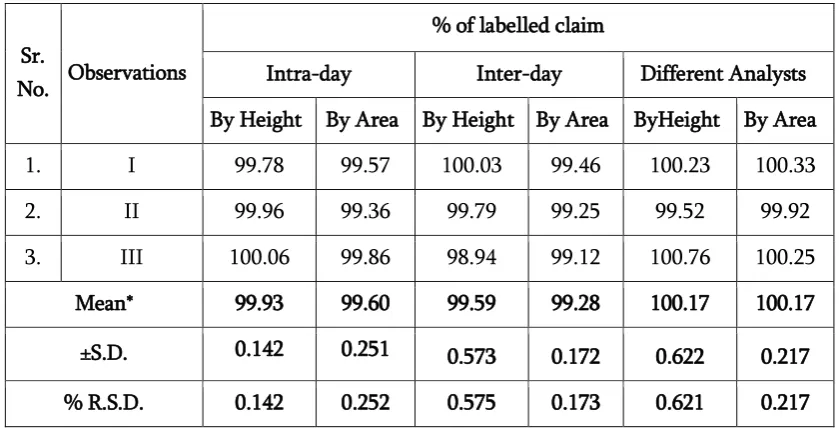
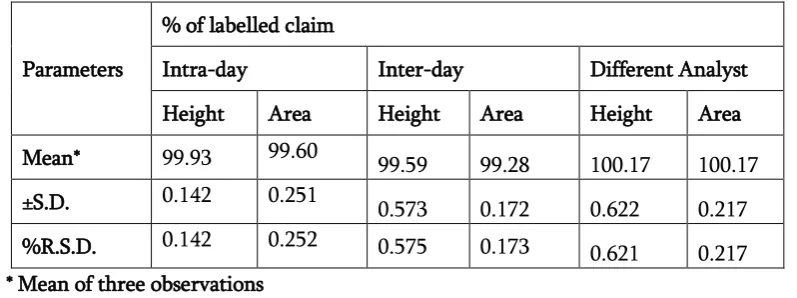
❖ Precision
• Repeatability
Precision of proposed method was ascertained by replicate analysis of homogeneous samples of tablet powder.
• Intermediate precision
The samples were analysed by proposed method on different days (intra-day & inter-day), and by different analysts.
Sr.
No. Observations
% of labelled claim
Intra-day Inter-day Different Analysts
By Height By Area By Height By Area ByHeight By Area
1. I 99.78 99.57 100.03 99.46 100.23 100.33
2. II 99.96 99.36 99.79 99.25 99.52 99.92
3. ІІІ 100.06 99.86 98.94 99.12 100.76 100.25
Mean* 99.93 99.60 99.59 99.28 100.17 100.17
±S.D. 0.142 0.251 0.573 0.172 0.622 0.217
% R.S.D. 0.142 0.252 0.575 0.173 0.621 0.217
* Each value is mean of three observations
Table 4 : Result of precision studies
❖ Linearity and Range
• Linearity of response
Chromatographic response (peak height / peak area) as a function of concentration was studied.
• Range of the method
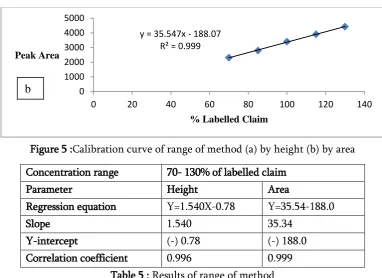
Sample weights of pre- analysed tablet powder were fortified by addition of standard drugs to have the range 70- 130 % of labelled claim and the samples were processed as discussed under accuracy studies. The graph plotted as percent labelled claim vs. peak height or peak area.
y = 1.5402x - 0.78 R² = 0.9962
0 50 100 150 200 250
0 20 40 60 80 100 120 140
Peak height
% Labelled Claim
Figure 5 :Calibration curve of range of method (a) by height (b) by area
Concentration range 70- 130% of labelled claim Parameter Height Area
Regression equation Y=1.540X-0.78 Y=35.54-188.0
Slope 1.540 35.34
Y-intercept (-) 0.78 (-) 188.0 Correlation coefficient 0.996 0.999
Table 5 : Results of range of method
❖ Limit of Detection (LOD) and Limit of Quantitation (LOQ)
LOD and LOQ were determined by the method based on standard deviation of the response and the slope of calibration curve as per ICH guidelines and are as follows:
S
3.3σ
LOD
=
andS
10σ
LOQ
=
Signal to noise ratio (k) = 3.3 and 10 for LOD and LOQ respectively
= Standard deviation of response (Estimated by measuring the response in term of peak height or peak area of standard solution of conc. 30.0 ng/spot for five times and was calculated) = 1.455201, 48.71276 by height and area resp.
S = Slope of calibration curve (obtained from calibration curve) = 1.18, 60.86 by height and area resp. S. No Parameters By Height By Area
1. LOD (ng/spot) 4.069 2.641 2. LOQ (ng/spot) 12.332 8.004 Table 6 : Results of LOD and LOQ studies
❖ Solution State Stability and stability on plate
The chromatograms of the same standard were obtained periodically over a period of 24 h. Time (h) Solution state stability Stability on plate
Peak height* Peak area* Peak height* Peak area* 1 151.96 3498.52 151.85 3498.63 3 152.14 3498.96 151.90 3498.22 7 152.36 3491.25 151.93 3495.55 24 151.99 3496.39 152.25 3495.96 Mean 152.11 3496.82 151.98 3497.09 ± SD 0.183 3.536 0.181 1.560 % RSD 0.120 0.101 0.119 0.045
y = 35.547x - 188.07 R² = 0.999
0 1000 2000 3000 4000 5000
0 20 40 60 80 100 120 140
Peak Area
% Labelled Claim
*mean of three observations
Table 7 : Results of Solution State Stability and stability on plate
❖ Specificity
• Standard solution: Working standard solution was prepared (10.0 g/ml) as described under preparation of standard solution.
• Sample solution: Accurately weighed quantities of tablet powdered equivalent to about 10.0 mg of Ozagrel were transferred to six different 10.0 ml volumetric flasks. The samples were then exposed to stress conditions as follows:
1) Normal (control) for 24 h
2) Reflux for 24 h after addition of 1M HCL up to 10.0 ml mark. 3) Reflux for 24 h after addition of 1M NaOH up to 10.0 ml mark.
4) At room temperature in dark after addition of 3 % H2O2 up to 10.0 ml mark for 48 h.
5) At 800 C (dry heat) for 24 h (after 24 h; methanol was added to make volume to 10.0 ml mark).
6) Sunlight for 24 h (after 24 h; methanol was added to make volume to 10.0 ml mark).
After stipulated time of each stress conditions flasks were sonicated for 15 minutes and filtered. One ml each of filtrates was further diluted to 100.0 ml with methanol and analyzed in similar manner as described under estimation of Ozagrel in tablets.
A) Normal, 24 h B) 1M HCL, 24 h reflux
E) Thermal, 24 h F) Sunlight, 24 h
Figure 6 : HPTLC chromatogram of specificity studies Sr. No. Sample % of labelled Claim* ± S.D.
By Height By Area 1 Normal 99.21 ± 1.837 99.84 ± 1.276 2 Acid 88.04 ± 1.905 87.10 ± 0.560 3 Alkali 87.27 ± 0.445 87.80 ± 1.286 4 Oxide 99.80 ± 0.571 99.30 ± 0.582 5 Heat 99.40 ± 1.877 99.03 ± 1.212 6 Sunlight 99.10 ± 0.456 99.62 ± 1.934 *mean of three observations
Table 8 : Results of specificity studies
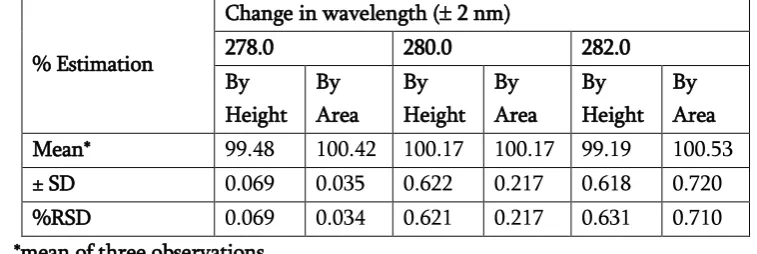
❖ Robustness (Change in Scanning Wavelength)
The tablet sample of Ozagrel was analyzed using proposed method after a deliberate change in detection wavelength for estimation by ±2 nm.
% Estimation
Change in wavelength ( 2 nm)
278.0 280.0 282.0 By
Height By Area
By Height
By Area
By Height
By Area Mean* 99.48 100.42 100.17 100.17 99.19 100.53 ± SD 0.069 0.035 0.622 0.217 0.618 0.720 %RSD 0.069 0.034 0.621 0.217 0.631 0.710 *mean of three observations
Table 9 : Results of robustness studies
III.
DISCUSSION AND SUMMARY
❖ HPTLC Method Development
The standard solution of Ozagrel (10.0 µg/ml) was prepared in methanol. The stationary phase used was pre-coated silica gel 60 F254 TLC plates. Several mobile phase combinations of varying polarity were tried for resolution
of degradation products from the parent drug. The mobile phase having composition toluene: methanol: triethylamine (6.5: 4: 0.1 v/v/v) was found to be satisfactory for the resolution of degradation products from the intact drug. The intact drug and its degradation products were adequately resolved on TLC plates under optimized chromatographic conditions. The RF value of intact drug was 0.40 ± 0.010 with sharp symmetrical peak. The λmax of Ozagrel, 280 nm from its in situ UV spectrum was found to be sensitive enough for
densitometric evaluation of the degradation products also. The optimized chromatographic conditions for proposed HPTLC method are as follows:
Stationary Phase Silica Gel 60 F254 TLC Plate 5 x 10 cm and 10 x 10 cm
Mobile Phase Toluene: Methanol: Triethylamine 6.5: 4.0: 0.1 v/v/v
Saturation Time 15 min.
Detection wavelength 280 nm in absorption/reflectance mode
Sample volume applied 5 l in band of 5 mm width
Slit Dimension 4.0 x 0.45 mm
Temperature 25 3 ºC
Table 10 : Summary of optimized chromatographic conditions
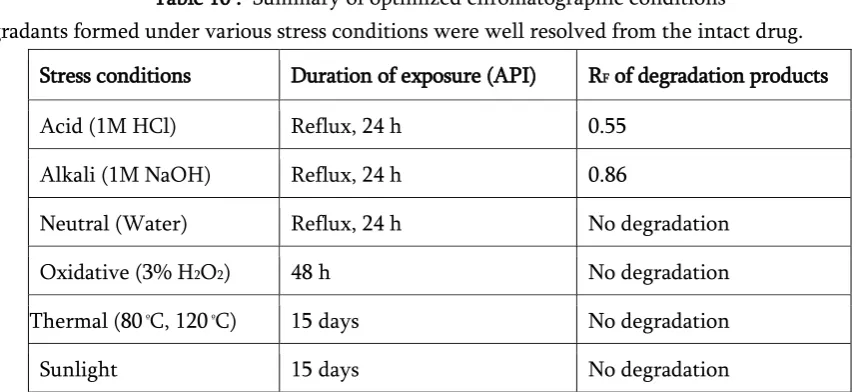
The degradants formed under various stress conditions were well resolved from the intact drug. Stress conditions Duration of exposure (API) RF of degradation products
Acid (1M HCl) Reflux, 24 h 0.55
Alkali (1M NaOH) Reflux, 24 h 0.86
Neutral (Water) Reflux, 24 h No degradation
Oxidative (3% H2O2) 48 h No degradation
Thermal (80 ºC, 120 ºC) 15 days No degradation
Sunlight 15 days No degradation Table 11 : Summary of forced degradation studies by HPTLC
sample solution applied was displayed directly by the instrument by comparison with concentration of standard.
Statistical parameters % of labelled claim Area Height Mean* 99.95 99.90 ±S.D. 0.365 0.497 % RSD 0.365 0.498 *mean of five observations
Table 12 : Summary of result of estimation of Ozagrel in tablet
❖ Validation of proposed HPTLC Method
The proposed HPTLC method was validated for accuracy, precision, linearity & range, limit of detection, limit of quantitation, specificity and robustness.
1. Accuracy: The accuracy of the method was ascertained on the basis of recovery studies performed by standard addition method and the recovery was found to be very close to 100% by area and height over the range of 70-130% of labelled claim representing the accuracy of the method and non interference of the sample matrix.
Statistical parameters % Recovery Area Height Mean* 100.08 100.00 ±SD 0.634 0.872 % RSD 0.634 0.872 *mean of five observations
Table 13 : Summary of result of accuracy studies
2. Precision: The precision was ascertained by replicate estimations of the drugs in tablet formulation by proposed method. A small value of R.S.D. well below 2.0 is indicative of repeatability of the proposed method.
Parameters
% of labelled claim
Intra-day Inter-day Different Analyst Height Area Height Area Height Area Mean* 99.93 99.60 99.59 99.28 100.17 100.17
±S.D. 0.142 0.251 0.573 0.172 0.622 0.217 %R.S.D. 0.142 0.252 0.575 0.173 0.621 0.217 * Mean of three observations
Table 14 : Summary of results of precision studies
3. Linearity and Range, LOD and LOQ
Concentration range 30- 120 ng/ spot Parameter Height Area Slope 1.175 60.862 Y-intercept 92.508 485.735 Correlation coefficient 0.999 0.999 LOD (ng/ spot) 4.069 2.641 LOQ (ng/ spot) 12.332 8.004
Table 15 : Summary of results of Linearity, Range, LOD and LOQ
4. Solution State Stability and stability on plate
The chromatograms of the same standard were obtained periodically over a period of 24 h.
Results indicate that the Ozagrel in methanolic solution and on silica gel TLC plate is quite stable over a long period of about 24 h.
5. Specificity: The chromatograms of control and sample solutions showed no interfering peak at the retention time of the drug, so the concentration of Ozagrel can be accurately measured, indicating specificity of the developed method. Moreover, the peaks for degradation products are also well resolved which may enable their estimation if they are identified and their standards are generated.
6. Robustness: A deliberate change in the chromatographic parameters i.e. changes in wavelength by ± 2 nm of max did not have any effect
on result indicate the robustness of method with respect to detection parameters.
The results of the assay of Ozagrel tablet obtained by proposed HPTLC methods are quite concurrent and reproducible. The recovery of the drug from the tablet matrix was about 100% indicating accuracy and reliability of method and non interference of excipients. At the same time the method is simple, precise, accurate, rapid, reasonably specific, selective and rugged. Hence, it may be adopted for routine assay of Ozagrel free of interferences from its
proposed HPTLC method in true sense can be said to be Stability Indicating Assay Method for Ozagrel due to its capacity to estimate the intact drug content unequivocally free of interference from its degradation products. It may also be possible to determine degradation products if they are identified and their standards are generated.
IV.
REFERENCES
[1]. Sethi, P. D., In HPTLC- Quantitative Analysis of Pharmaceutical Formulations, CBS Publisher
and Distributor, New Delhi, ІInd ed., 1996, p. 1 -19.
[2]. D.H. Shewiyoa,b,c, E. Kaaleb, P.G. Rishab, B. Dejaegherc, J. Smeyers-Verbekec, Y. Vander Heyden. HPTLC methods to assay active ingredients in pharmaceutical formulations: A review of the method development and validation steps. Journal of Pharmaceutical and Biomedical Analysis, 2012, 66, p. 11– 23.
[3]. Nadig, D. E., "Preparation of drug sample for Analysis", Handbook of Pharmaceutical Analysis; Ohannesian, L., New Jersey, 2002; p. 1-3.