RESEARCH ARTICLE
CONCENTRATIONS OF SELECTED METALS IN COFFEE (
COFFEA ARABICA
) BEANS, LEAVES AND
SUPPORTIVE SOIL OF GEDEO ZONE, ETHIOPIA
1
Wondimeneh Dubale,
2Ahmed Hussen,
3, *Vegi Maheswara Rao
1
Department of Chemistry, School of Graduate Studies, Dilla University, Dilla, Ethiopia
2Center for Environmental Sciences, College of Natural Science, Addis Ababa University, Ethiopia
3, *Department of Chemistry, School of Physical Sciences, College of Natural and Mathematical Sciences,
The University of Dodoma, P.O. Box: 259, Dodoma, Tanzania
ARTICLE INFO
ABSTRACT
The concentration levels of some selected common (Mg, K, Ca), heavy (Cr, Mn, Co, Ni, Cu, Zn) and toxic metals (Cd and Pb) were determined in coffee (Coffea arabica) beans, leaves and supportive soil of Gedeo zone, Ethiopia using Flame Atomic Absorption Spectrometer after microwave digestion of the samples. In coffee beans, among the common metals, concentration of K was determined to be the highest followed by that of Mg and Ca. Out of heavy metals, Cu is present in highest concentration followed by Mn, Zn, Co, Ni and Cr. Similar to coffee beans, in coffee leaves also common metal of highest concentration is K, but followed by Ca and Mg. In soil samples, out of common metals Mg is found to have highest concentration followed by Ca and K. Toxic metals were not detected in all the samples except Cd in soil. This study indicates the presence of all the nutrients under study, with considerable amounts in the coffee beans. In addition, coffee leaves are found to be competitive with the coffee beans in terms of nutrient content. Therefore, this study suggests that coffee leaves may be used for preparing coffee beverage similar to tea. The levels of studied metals in coffee beans and leaves were below the maximum permissible limits set by FAO/WHO and Codex Alimentarius Commission.
Copyright©2017,Wondimeneh Dubale et al. This is an open access article distributed under the Creative Commons Attribution License, which permits unrestricted use, distribution, and reproduction in any medium, provided the original work is properly cited.
INTRODUCTION
Coffee is one of the most popular and widely consumed beverages in the world, having extensive commercial as well as social importance. It is also one of the most important agricultural products in the international trade putting into motion approximately US$ 35 billion per year and being
surpassed only by petroleum (Grembecka et al., 2007; Santos
and Oliveira, 2001). There are many different species of coffee in the world; however, the two main species cultivated for
commercial production are Coffea arabica and Coffea
canephora (Habtamu, 2008). Coffea arabica, accounts for 75–
80% of the world's production and over 90% of the market
(Santos and Oliveira, 2001; Daniels, 2009). Coffea arabica is
the only species occurring in Ethiopia (Kufa, 2010). Coffee is produced in more than70 countries and it is the major source of foreign currency earnings; furthermore, it supports the
*Corresponding author: Vegi Maheswara Rao
Department of Chemistry, School of Physical Sciences, College of Natural and Mathematical Sciences, The University of Dodoma, P.O. Box: 259, Dodoma, Tanzania
livelihood of millions of rural families (Tornincasa et al.,
2010). Mineral elements play critical role in building body tissue and regulating numerous physiological processes. They are thus essential constituents of enzymes and hormones; regulate a variety of physiological processes, and are required
for the growth and maintenance of tissues and bones (Soetan et
al., 2010). Coffee reduces cancer incidence (Yu, et al., 2011).
On the other hand, the toxic metals Cd and Pb have no biological function and exhibit toxicological problems even at trace concentrations (Iwegbue, 2012). Therefore, regular monitoring of levels of metals in different food materials is essential to prevent excessive build-up of these metals in the
food chain (Arora et al., 2008). Gedeo zone of Ethiopia is
known throughout the world by its coffee, especially Yirgacheffee coffee beans which have special taste and aroma. In the international market, Yirgacheffee coffee beans have a trademark with the rights owned by Ethiopia. As a result, cost and consumption of Yirgacheffee coffee beans were greatly increased over the past few years. There are no reports in the literature on the levels of common, heavy and toxic metals in coffee beans of Gedeo zone. In addition, coffee leaves are extensively used to make coffee leaf beverage in the zone.
ISSN: 0976-3376
Vol. 08, Issue, 11, pp.6526-6533, November,Asian Journal of Science and Technology 2017Available Online at http://www.journalajst.com
ASIAN JOURNAL OF
SCIENCE AND TECHNOLOGY
Article History:
Received 22nd August, 2017
Received in revised form
27th September, 2017
Accepted 22nd October, 2017
Published online 30th November, 2017
Key words:
However, the levels of common, heavy and toxic metals in the coffee leaves were not clearly understood by the consumers. There are no reports in the literature on the levels of common, heavy and toxic metals in coffee beans of Gedeo zone. Therefore, in this study, we report the levels of common (Mg, K, Ca), heavy (Cr, Mn, Co,Ni, Cu, Zn) and toxic (Cd, Pb) metals in coffee beans, leaves and their supportive soil of the three major coffee producing districts, Kochere, Yirgacheffee and Wonago in Gedeo zone, Ethiopia.
MATERIALS AND METHODS
Reagents and Equipment
Chemicals and reagents used for the analysis were all of analytical grade. The reagents and chemicals used in this study
were HNO3 (68-70%), H2O2 (30%), HCl (37%), 0.1%
LaCl3·7H2O (UNI- CHEM
®
chemical reagent, China), stock
standard solutions containing 1000 mg/L, in 2% HNO3, of the
metals Mg, K, Ca, Cr, Mn, Co, Ni, Cu, Zn, Pd and Cd (Buck Scientific Puro-Graphic, USA). Stainless steel soil sampling auger (Oakfield Apparatus Company, Oakfield, USA), ceramic mortar and pestle, electric motor grinder (Retsch, GmbH & Co. KG Type ZM 1, Hann 1, Germany), microwave digester (Buck Scientific Model BMS 1, USA) and flame atomic absorption spectrophotometers (FAAS) (Buck Scientific Model 210VGP, USA) equipped with deuterium arc back ground correctors and hollow cathode lamps with air-acetylene flame were used in this study.
Sample Collection
Coffee beans, leaves and soil samples were collected from three major coffee producing districts (Kochere, Yirgacheffee and Wonago) during the main coffee harvesting season (November to January). For the collection of coffee bean and leaf samples eight sites were selected from a single district. Again from a single site eight farmers were randomly selected. Thereafter, from each farmer’s farm a minimum of five coffee plants were randomly chosen for sampling of beans and leaves. Soil samples were systematically collected from all the sites under each sampled coffee plant at 75 cm radius and 30 cm depth. Since the investigation was concerned with possible uptake of common, heavy and toxic metals by coffee plants, the samples were collected from the whole area that the root system of the plant penetrates. Finally, after collection, each sample was homogenized to form one representative coffee bean, leaf and soil samples per each district.
Preparation of Coffee Bean Samples
The collected coffee beans were cleaned up, to separate the unripe, overripe and damaged cherries and to remove dirt, soil, twigs and leaves. Then the cherries were dried in full sun on a hard, flat and clean surface. After drying for more than four weeks, the coffee beans were removed from the dried husk. These coffee beans were then ground into a fine powder and 50 g of this was taken for the analysis.
Preparation of Coffee Leaf Samples
Coffee leaves were washed to remove exogenous contaminants from their surfaces. The leaves were washed with tap, distilled and deionized water for 30, 10 and 15 min, respectively and
then dried in full sun for at least 2 weeks. The dried leaves were finally ground into a fine powder by using electric motor grinder, of which, 50 g was used for the analysis.
Preparation of Soil Samples
The visible pieces of plant residues were removed from collected soil samples and then air dried and homogenized. The dried soil samples were ground and sieved through a 2 mm mesh size. The total amount of soil samples collected from each district was over 500 g of sieved soil, of which 50 g was used for analysis.
Optimization of Digestion Conditions
In order to get clear and colorless solution of coffee bean and leaf digest which is suitable for FAAS analysis, different
combinations of parameters of microwave digestion
procedures were attempted. Major variables were volume of
HNO3 and H2O2; digestion temperature, time and power. A
total of 20 trails were made by varying the above three parameters one after the other. The optimum digestion procedure was selected depending upon the clarity of digests that is a solution without any residue and suspended matter, involving minimal reagent volume, minimal digestion time and temperature. The obtained optimum digestion conditions for coffee bean and leaf are given in Table 1.
Table 1. Optimum microwave digestion conditions for the digestion of coffee bean and leaf samples
Step Temperature (oC) Time ( min) Power (W)
Coffee bean
1 145 5 85
2 210 10 90
3 50 10 0
Coffee leaf
1 165 5 85
2 220 15 90
3 55 15 0
Digestion of Coffee Beans and Leaves
Coffee bean powder (0.3 g) was directly weighed in a poly-tetrafluoro ethylene (PTFE) digestion vessel, and optimized
volumes of 7 mL of HNO3 (68-70%) and 2 mL of H2O2 (30%)
were added and the vessels were placed in a fume hood for 10 min for pre-digestion. Then, the vessels were closed and placed on the rotating turntable of the microwave oven and then the digestion process was started. Finally, the sample was digested at the optimum conditions. The digested solutions were cooled and then filtered through filter paper (Whatman no. 42).
The digestion was carried out in triplicate for each bulk sample. Digestion of a reagent blank was also performed with the same procedure in parallel with the digestion of the samples keeping all digestion parameters the same. Six blanks were digested for coffee beans samples. A solution of 0.1 %
LaCl3·7H2O was used in the determination of Ca and Mg to
avoid chemical interference and the solution was then filled up to the mark of 25 mL volumetric flask with deionized water. The same procedure is followed for the digestion of leaf samples with its optimized conditions (Table 1) using the
optimized reagent volumes of 5 mL of HNO3 (68-70%) and 2
Digestion of Soil Samples
For the digestion of soil samples the EPA 3050B (EPA 3050B, 1996) method was applied with a very slight modification. The dried and sieved soil sample (0.5 g) was taken in a digestion
vessel and 10 mL of 1:1 HNO3 and H2O (deionized) was
added. The sample was heated to 110oC and refluxed for 25
minutes. Then it was allowed to cool and 5 mL of conc. HNO3
was added and refluxed for 120 minutes. After 2 hours, due to the appearance of brown fumes, the digestion was repeated by
addition of 5 mL conc. HNO3 twice with 10 minutes interval
until no brown fumes was given off by the sample indicating
the completion of reaction with HNO3. The sample was cooled
and 3 mL of water (deionized) and 5 mL of H2O2 (30%) was
added. The sample was heated for 90 minutes until excessively vigorous effervescence was disappeared. After cooling, 10 mL
of conc. HCl was added to the sample and heated at 95oC for
25 minutes. Finally, the digest was allowed to cool, filtered through Whatman No. 42 filter paper and the resultant clear light yellow solution was made up to 50 mL with deionized water. Reagent blanks were also prepared and digested with the same procedure as that of soil sample.
Instrument Operating Conditions
Elements Mg, K, Ca, Cr, Mn, Co, Ni, Cu, Zn, Cd and Pb were analyzed with FAAS equipped with deuterium arc background corrector and air-acetylene flame system using external calibration curve. For each of the elements, their respective hallow cathode lamp was inserted in to the atomic absorption spectrophotometer and the solution was successively aspirated into the flame. The acetylene and air flow rates were managed to ensure suitable flame conditions. Three replicate determinations were carried out for each sample. Ten elements (Mg, Ca, Cr, Mn, Co, Ni, Cu, Zn, Cd and Pb) were analyzed by the absorption mode of the instrument and one element (K) was analyzed by the emission mode of the instrument. The same analytical procedure was employed for the determination of elements in the six digested blank solutions for each of the samples. The instrument operating conditions (wavelength, slit width, lamp current) were adjusted for maximum signal intensity according to the manufacturer guide for each analyte.
Calibration procedure
For each metal the calibration curves were made by using diluted solutions prepared from stock standard solutions of 1000 mg/L of the metals Mg, K, Ca, Cr, Mn, Co, Ni, Cu, Zn,
Cd and Pb in 2% HNO3. Intermediate standard solutions
containing 10 mg/L were prepared in 100 mL volumetric flasks from the standard stock solutions by sequential dilution. Four working standards were freshly prepared for each element from the intermediate standards by diluting with deionized water. Three replicate determinations were carried out for each metal and the same analytical procedures were employed for blank solutions.
Method validation
Spiking method was used to validate the method. The spiking experiment was performed in four flasks for each of coffee bean and leaf samples. Coffee bean powder sample (0.3 g) was taken in four different flasks. To the first flask 200 μL of 1000 mg/L Ca and 300 μL of 1000 mg/L Mg were spiked. To the second flask 1500 μL of 1000 mg/LK was spiked. The third flask was spiked with 25 μL of 10 mg/L Cu, Mn and Zn. In the fourth flask 15 μL of 10 mg/L of Ni, Co and Cr was spiked. Similarly 0.3 g of coffee leaf powder was taken in four different flasks. 300 μL of 1000 mg/L Ca and Mg; 1000 μL of 1000 mg/L K; 50 μL of 10 mg/L Cu, Mn and Zn; and 15 μL of
10 mg/L of Co were spiked in the 1st, 2nd, 3rd and 4thflasks,
respectively. All the spiked samples were digested in triplicate following the optimal digestion procedure developed and then analysed. Result of spiking experiment revealed that percent recoveries of metals in coffee bean and leaf samples lie within the range of 90–106% and 87–107%, respectively (Table 2). This indicates that the recovery results were within the acceptable range. Accordingly, the result shows the validity and reliability of the proposed method for analysis of the target metals.
Method detection limit
After digestion of six blank solutions for each of coffee bean, leaf and soil samples, triplicate readings were obtained for each sample.
Table 2. Recovery test results for the optimized procedure of coffee bean and leaf sample
Sl. No. Elements Conc. in sample
(μg/g)
RSD (%) (n=3)
Amount added (μg/g)
Conc. in spiked sample (μg/g)
RSD (%) (n=3)
Recovery (%) (SD, n=3) Coffee bean
1 Mg 1833.00 2.16 600 2395.67 0.78 93.78 (5.00)
2 K 15042.80 0.35 2500 17315.33 0.30 90.92 (3.05)
3 Ca 1037.33 2.22 400 1460.00 1.07 105.67 (2.18)
4 Cr 1.92 8.85 3.0 4.82 4.36 96.56 (1.02)
5 Mn 21.13 5.40 5.0 26.05 4.61 98.27 (4.01)
6 Co 2.47 6.47 3.0 5.18 0.77 90.33 (4.81)
7 Ni 2.43 5.76 3.0 5.41 0.37 99.33 (4.48)
8 Cu 23.39 5.43 5.0 28.28 4.10 97.93 (2.70)
9 Zn 12.75 7.92 5.0 17.50 6.34 95.00 (6.12)
Coffee leaf
1 Mg 1889.98 1.72 600 2533.33 1.46 107.22 (1.80)
2 K 13282.20 0.47 2000 15210.7 0.01 96.42 (3.18)
3 Ca 2248.59 2.08 600 2817.33 0.04 94.79 (7.63)
4 Mn 52.01 3.79 10 61.84 2.72 98.33 (8.50)
5 Co 2.29 7.86 3 5.05 0.99 91.78 (4.53)
6 Ni 1.38 8.70 3 4.51 0.67 104.23 (3.10)
7 Cu 25.28 4.39 10 33.93 3.24 86.50 (2.14)
Then the method detection limit of each element was calculated as three times the standard deviation of the blank (3δ blank, where δ = standard deviation of the blanks).
RESULTS AND DISCUSSION
Analytical figures of merit
Instrument operating conditions such as wavelength, slit width, lamp current were adjusted for maximum signal intensity according to the manufacturer guide for each metal under study. The instrument operating conditions, method detection limits and correlation coefficients of the calibration curves for the determination of metals in coffee bean, leaf and soil samples by FAAS are given in Table 3. As can be seen in Table 3, the correlation coefficients of the calibration curves for the entire metals were greater than or equal to 0.999 which assured the linearity of instrumental response for each metal. The reproducibility of the analytical procedure was checked by carrying out a triplicate analysis and calculating the relative standard deviations for each metal. The values of relative standard deviations (% RSD) are less than 10 % for all mean concentrations of metals in each sample. Therefore, the precision of results obtained by the current method is very good.
Distribution pattern of metals in coffee beans
In coffee beans, K was the most abundant common metal followed by Mg and Ca (Table 4). The highest levels of K in the coffee beans is due to the fact that nutrient elements such as N, P, K, S, and Mg are highly mobile in the plant tissues and trans-located from old plant tissues to new plant tissues (Weis and Weis P, 2004). The other reason for higher concentration of K, Mg and Ca is that, these elements are among the major elements required by the plants. Among the determined heavy metals, Cu was the most accumulated one followed by Mn and Zn in coffee bean samples of the three districts. Higher Cu levels in the beans may be attributed to the higher availability of this micronutrient in the supportive soils under coffee plantation. The level of Cr was the least among all the metals. Generally, the concentration of detected metals in coffee beans are in the order of Cr <Ni < Co < Zn <Mn <Cu <Ca <Mg < K. The toxic metals Cd and Pb were not detected in coffee beans of the three districts. This result indicates that there is no environmental pollution due to industrial toxic metal wastes in Gedeo zone. In addition, the absence of toxic metals might also be an evidence for the non-appearance of the use of some commercial fertilizers and herbicides for coffee plantation in the zone. Furthermore, Cd and Pb have no nutritional value for human beings; their low concentration is appreciable.
Therefore, it could be stated that coffee beans of Gedeo zone is safe in terms of health risks associated with these toxic elements. The trend of the distribution patterns of each metal in coffee beans is the same for Kochera, Yirgacheffee and Wonago districts. One way ANOVA revealed the mean concentrations of all the detected metals except Co are significantly different in farmer’s coffee beans of three districts at 95% confidence level. The probable reasons for the significant difference of concentrations of metals may be difference of age and varieties within the sampled coffee plants (Daniel and Chandravanshi, 2010).
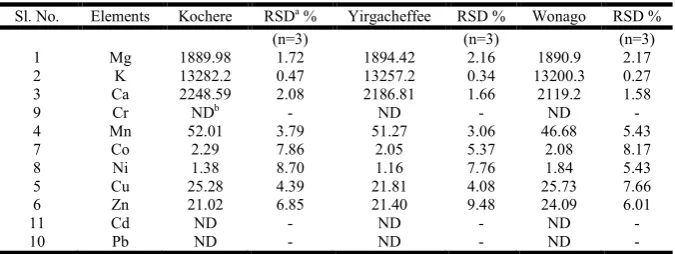
Distribution pattern of metals in coffee leaves
Coffee leaves contain significantly higher concentration of K than the rest of common metals Ca and Mg (Table 5). Among heavy metals, Mn occurs in highest content followed by Cu, Zn and Co in decreasing order, while Ni is found to occur in least concentration. Generally, the concentration of metals in coffee leaves are in the order of Ni < Co < Zn < Cu < Mn < Mg < Ca < K. The levels of Cr, Cd and Pb were found to be below the method detection limit. The absence of Pb, Cd and Cr may be due to the fact that no commercial fertilizers are
used for coffee plantation (Farahmand et al., 2011). In coffee
leaf samples, the concentration of common metals and heavy metals follow similar trend in the three districts. There is no significant difference in the concentration of Zn, Co, K and Mg in coffee leaf samples of the three districts. On the other hand significant difference is observed in Mn, Cu, Ni and Ca. The significant difference might arise from the chemical composition of coffee leaves, the specific environmental conditions in which the plant was grown or the studied area might contains different concentration of the mineral nutrient in the soil under coffee plantation.
Distribution pattern of metals in soil samples
In soil samples, Mg was found at highest concentration followed by Ca and K in common metals (Table 6). Among the heavy metals Mn was found to have higher concentration followed by Cu and Zn. The toxic metal Pb was found to be below the detection limit. In general the decreasing order of concentrations is Mg > Ca > K > Mn > Cu > Zn > Co > Ni > Cr > Cd. The distribution of metals in soil samples of the three districts followed the same pattern. The statistical analysis revealed that there is a significant difference in mean concentration of the detected metals except Mg and Cr in soil samples of the three districts. The source for this difference may be due to the variation in pH, moisture content and chemical compositions of the soils of three districts (Ghehsareh and Samadi, 2012). Even though Cd and Cr are detected in the soil samples, those are not detected in the coffee leaf samples and Cd is not detected in coffee bean sample. Similarly, Cr is present in the detectable level in coffee bean samples, but not detected in coffee leaf samples. Moreover, the order of levels of the metals is not the same for coffee beans, leaves and their supportive soil.
The reasons for these inconsistencies are the trace elements present in any part of the plant must have existed in the rooting zone of the plant, at least in soluble form. A trace element must also pass through at least one cellular membrane in its movement from soil to plant. The selectivity of these processes of mineral bioaccumulation within the vegetable varies with different trace elements, with different plants and with the unique environment in which the commodity is grown (Anderson and Smith, 2002). Previous investigations demonstrated that the distribution of the metals among plant organs was selective and depended on the part of the plant, surface characteristics of the plant organ, and the element that
was examined (Blagojevic et al., 2009). Mechanisms that
control plant availability to soil microelements often depends on soil properties such as soil texture, pH, cation exchange
capacity, CaCO3, organic matter, clay amount, soil oxidation
Comparison of the concentration of metals in coffee beans with literature values
Nutrient content of any plant food varies widely and is affected by factors such as variety or cultivar; part of the plant consumed; stage of maturity; geographic site of production or climate; harvesting and post-harvest handling conditions; and storage. Comparing nutrient content of plant foods from different data sources is therefore challenging. Common errors introduced during sampling procedures, sample preparation and analytical methods can also affect the reported nutrient
values (Van Jaarsveld et al., 2014). Even if there is a
difference in sample preparation and analysis techniques, results obtained in the present study were compared with the values reported by different researchers in the literature. Many authors reported the concentration of essential and non-essential metals in raw and roasted coffee beans, which are grown in different part of the world including Ethiopia. The comparison of the concentration of metals in coffee beans
obtained in the current study with reported values is presented in Table 7. Results of the present study are more or less consistent with the literature values reported by different researchers from different countries.
Comparison of the concentration of metals in coffee leaves with tea leaves
Since no previous study was found on determination of the concentrations of essential and non- essential metals in coffee leaf samples; comparison is made with the tea leaves (Table 8). From the comparison it can be seen that coffee leaves are potentially a rich source of some dietary metals such as K, Zn and Cu like tea leaves. In addition, coffee leaves contain appreciable amount of essential metals Mg and Ca. Therefore, if coffee leaves are used to make coffee leaf beverage, similar to the tea leaf, then it might help many people as a source of dietary essential elements. It might also serve as an additional source of income for farmers.
Table 3. Instrument operating conditions, method detection limits and correlation coefficients of calibration curves for the determination of metals in the samples by FAAS
Sl. No. Elements
Instrument operating conditions MDLb (mg/kg) for
Correlation Coefficients
(r) Wave length
(nm)
Slit width (nm)
Lamp current (mA)
IDLa
(mg/L)
Coffee bean samples
Coffee leaf samples
Soil samples
1 Mg 285.2 0.7 1.0 0.001 0.380 0.270 0.360 0.9995
2 K 766.5 0.7 - 0.010 0.350 0.250 0.380 0.9999
3 Ca 422.7 0.7 2.0 0.010 0.400 0.820 0.350 0.9994
4 Cr 357.9 0.7 2.0 0.050 0.090 0.070 0.100 0.9996
5 Mn 279.5 0.7 3.0 0.010 0.310 0.210 0.330 0.9995
6 Co 240.7 0.2 4.5 0.050 0.060 0.070 0.090 0.9992
7 Ni 232.0 0.2 7.0 0.040 0.200 0.090 0.100 0.9997
8 Cu 324.7 0.7 1.5 0.020 0.330 0.220 0.250 0.9999
9 Zn 213.9 0.7 2.0 0.005 0.170 0.150 0.180 0.9998
10 Cd 228.9 0.2 7.0 0.005 0.040 0.040 0.050 0.9994
11 Pd 233.3 0.7 2.0 0.100 0.200 0.150 0.170 0.9990
aIDL= Instrumental detection limit, bMDL= Method Detection Limit
Table 4. Average concentration (μg/g)of metals in coffee beans
Sl. No. Elements Kochere RSDa (%) n=3) Yirgacheffee RSD (%) (n=3) Wonago RSD (%) (n=3)
1 Mg 1748.23 1.86 1833.00 2.16 1758.87 1.04
2 K 14631.30 0.32 15042.8 0.35 14861.1 0.26
3 Ca 1252.93 2.41 1037.33 2.22 1132.60 2.04
4 Cr 1.04 7.69 1.92 8.85 1.08 7.41
5 Mn 23.60 5.51 21.14 6.62 17.25 4.17
6 Co 2.86 8.74 2.47 6.47 2.49 7.63
7 Ni 1.66 4.82 2.43 5.76 2.34 4.70
8 Cu 28.54 3.08 23.39 5.43 26.76 3.21
9 Zn 10.40 9.23 12.75 7.92 8.74 8.35
10 Cd NDb - ND - ND -
11 Pb ND - ND - ND -
a
RSD=Relative standard deviation, bND = Not detected
Table 5. Average concentration (μg/g) of metals in coffee leaves
Sl. No. Elements Kochere RSDa % Yirgacheffee RSD % Wonago RSD %
(n=3) (n=3) (n=3)
1 Mg 1889.98 1.72 1894.42 2.16 1890.9 2.17
2 K 13282.2 0.47 13257.2 0.34 13200.3 0.27
3 Ca 2248.59 2.08 2186.81 1.66 2119.2 1.58
9 Cr NDb - ND - ND -
4 Mn 52.01 3.79 51.27 3.06 46.68 5.43
7 Co 2.29 7.86 2.05 5.37 2.08 8.17
8 Ni 1.38 8.70 1.16 7.76 1.84 5.43
5 Cu 25.28 4.39 21.81 4.08 25.73 7.66
6 Zn 21.02 6.85 21.40 9.48 24.09 6.01
11 Cd ND - ND - ND -
10 Pb ND - ND - ND -
Table 6. Average concentration (μg/g) (n=3) of metals in soil samples
Sl. No. Elements Kochere RSDa % (n=3) Yirgacheffee RSD % (n=3) Wonago RSD % (n=3)
1 Mg 2236.06 2.40 2216.6 1.79 2153.06 1.60
2 K 815.91 3.16 905.43 4.02 711.24 8.03
3 Ca 1167.77 2.06 1313.91 2.30 1248.82 3.87
4 Cr 5.01 4.19 5.63 4.62 5.55 7.39
5 Mn 412.94 3.90 385.88 5.67 337.10 8.41
8 Co 10.05 6.27 8.59 3.73 11.66 6.69
9 Ni 6.45 7.44 8.33 6.60 7.30 4.38
6 Cu 61.89 6.08 76.9 1.74 70.98 3.07
7 Zn 47.14 5.32 45.92 7.01 34.60 5.72
10 Cd 3.11 4.82 2.59 8.11 3.49 7.45
11 Pb NDb - ND - ND -
a
RSD = Relative standard deviation, bND = Not detected
Table 7. Comparison of quantified metal concentrations (µg/g) in coffee beans with literature values
Metals Present study Brazil(Martin et al., 1998) Costa Rica (Anderson and Smith,2002) India(Suseela et al., 2001) Ethiopia (Abera, 2006)
Mg 1748 - 1833 1720 - 2060 2203 2000 - 3100 1670 - 1690
K 14631 - 15043 12280 - 18280 18570 14000 - 29000 13010 - 17000
Ca 1037 - 1253 990 - 1370 1079 869 - 1171 710 - 1250
Cr 1.04 - 1.92 NRa NR 0.4 - 1.00 0.21 - 0.28
Mn 17.25 - 23.60 26 - 39 38 7 - 13 13 - 19
Cu 23.39 - 28.54 15 - 77 18.1 0.4 - 16 11 - 30
Zn 8.74 - 12.75 4-61 7.97 2 - 9 4 - 21
Co 2.47 - 2.86 NR NR NR 2.6 - 6.8
Ni 1.66 - 2.43 NR NR NR 2.0 - 2.5
Cd NDb NR NR NR ND
Pb ND NR NR NR ND
aNR: Not reported, bND: Not detected
Table 8. Comparison of metal concentrations (μg/g) in coffee leaves with the reported values in tea leaves
Metals Present Study
Reported values Ethiopia
(Daniel and Chandravanshi,2010)
Japan (Zhu et al., 2011)
India (Seenivasan et al., 2008)
Turkey (Karak and Bhagat, 2010)
Mg 1891 - 1894 3219 - 3538 3014 NRa NR
K 13200 - 13282 11503 - 13780 15772 NR NR
Ca 2119 - 2249 3821 - 4419 4488 NR NR
Cr NDb NR NR 2.5 - 11.4 1.16 - 3.41
Mn 46.68 - 52.01 1242 - 1421 761 NR 2617 - 3154
Co 2.05 - 2.29 ND NR NR NR
Ni 1.16 - 1.84 NR 5.44 1.1 - 5.3 6.60 - 11.7
Cu 21.81 - 25.73 9.1 - 11.5 18.93 15.9 - 32.2 5.83 - 10.7
Zn 21.02 - 24.09 20.2 - 21.6 NR NR NR
Cd ND ND NR 0.05 - 0.38 0.05 - 1.27
Pb ND ND NR 0.48 - 1.03 ND
aNR: Not reported, bND: Not detected
Table 9. Comparison of present results for coffee beans and coffee leaves with maximum permissible limits set by FAO/WHO, different organizations and countries
Metals
Present study MPLa
( μg/g) Type of plant MPL set by Reference
Coffee beans Coffee leaf
Cr 1 – 2 1 – 2 2.0 Medicinal plant Canada (Arora et al., 2008)
Mn 17 - 24 17 - 23 no MPL Medicinal plant WHO (Khuda et al., 2012)
Co 2.5 – 3 2 – 3 0.2 Medicinal plant WHO (Khuda et al., 2012)
Ni 1.7-2.4 1.6-2.3 1.5 Medicinal plant WHO (Khuda et al., 2012)
Cu 23 - 29 23 –28
40 In foods FAO/WHO (Arora et al., 2008)
20.0 Medicinal plant China (Jabeen et al., 2010)
150.0 Medicinal plant Singapore (Jabeen et al., 2010)
Zn 9 – 13 9 – 13
50 Grain USDA (Salama and Radwan, 2005;
Iwegbue, 2012)
100 Beans USDA
27.4 Edible plants FAO/WHO (Jabeen et al., 2010)
Cd NDb ND 0.05
Leafy vegetables and
fresh herbs Walker
(Salama and Radwan, 2005;
Blagojevic et al., 2009)
0.3 Medicinal plant China (Jabeen et al., 2010)
Pb ND ND 0.3 Cereals & legumes CAC (Arora et al., 2008)
Maximum permissible limits of metals
Concentrations of heavy metals in plants are highly essential for good health of animals and human beings, but the metals should be within permissible limits as recommended by
FAO/WHO and other standard providing bodies.
Concentrations higher or lower than the recommended limits
have adverse effects on health (Yahaya et al., 2010; Leung et
al., 2008). No information was found in literature regarding
maximum permissible limits of heavy metals in coffee bean. Therefore comparison was made with standards set for other food items and herbal plants (Table 9). The levels of metals found in coffee bean and leaf samples were below the maximum permissible limit according to the international standards for heavy metals. From this, it can be inferred that there is no health risk associated with heavy metals during the consumption of coffee beans and leaves from Gedeo zone.
Correlation of metals in coffee beans and leaves with soil samples
The correlations between metals in coffee bean and leaf samples with that of soil samples are presented in Table 10. From this table, it is observed that the more the concentrations of metals like Mg, Ca, Cr, Mn, Zn and Co in the soil, more is the accumulation of them in coffee beans. This implies that there is dependence of the metal concentration in the coffee beans on the amount of metals under the supportive soil of the plant. Table 10 indicates very high positive correlation for Mn and Cu in coffee beans. A moderate correlation is observed for Mg, Ca, Cr, Zn and Co whereas poor positive and negative correlation observed for K and Ni respectively. In the case of coffee leaves, high positive correlation is observed for Mg, Mn and Zn. Moderate positive correlation is observed for Ca and Co. Poor positive correlation is observed for K whereas negative correlation is observed for Ni and Cu. The statistical analysis shows that, for most metals positive correlations exist in their concentrations between supportive soil and the tissues of coffee plant (leaves and beans). This may suggest that, metal absorption in coffee plants is influenced by the content and bioavailability of metals in the supportive soil under coffee plantation.
Conclusion
All the samples contain much higher amount of common metals than heavy and toxic metals. In coffee beans and leaves levels of toxic metals were less than the method detection limit and the levels of trace heavy metals were below the maximum permissible limits set by FAO/WHO and CAC for different food items. Therefore, there is no health risk associated with toxic and trace heavy metals in using coffee beans of Gedeo zone. This study also showed that there is high nutritional value for the coffee leaves in addition to coffee beans, suggesting using coffee leaves for preparing a beverage similar to tea.
There is a positive correlation for the concentration of most of the metals in coffee beans and leaves with the supportive soil under coffee plantation. This may suggest a dependence of metal concentration in the coffee tissues on the level of metals under supportive soil of coffee plantation.
Acknowledgement
The authors express their gratitude to the farmers for their co-operation during sample collection.
REFERENCES
Abera, G. 2006. Investigation of metals in raw and roasted indigenous coffee varieties in Ethiopia. M. Sc. Thesis, Addis Ababa University, Ethiopia.
Anderson, K.A. and Smith, B.W. 2002. Chemical profiling to
differentiate geographic growing origins of coffee. Journal
of Agricultural and Food Chemistry, 50: 2068 - 2075.
Arora, M., Kiran, B., Rani, S., Rani, A., Kaur, B. and Mittal, N. 2008. Heavy metal accumulation in vegetables irrigated
with water from different sources. Food Chemistry, 111:
811 - 815.
Blagojevic, N., Damjanovic-Vratnica, B., Vukasinovic-Pesic, V. and Durovic, D. 2009. Heavy metals content in leaves
and extracts of wild-growing Salvia officinalis from
Montenegro. Polish Journal of Environmental Studies
18(2): 167-173.
Daniel, W.G. and Chandravanshi, B.S. 2010. Levels of metals in commercially available Ethiopian black teas and their
infusions. Bulletin of the Chemical Society of Ethiopia,
24(3): 339 - 349.
Daniels, N. 2009. Variation in coffee processing and their impact on quality and consistency. M. Sc. Thesis, Michigan University, USA.
EPA, Method 3050B, 1996. Acid digestion of sediments, sludge’s, and soils. US Environmental Protection Agency, 1-12.
Farahmand, F., Pirumyan, G. and Ghavi, F.F. 2011. Evaluation of heavy metals pollution in drinking water based on
ground water sources. Australian Journal of Basic and
Applied Sciences, 5(6): 891 - 896.
Ghehsareh, A.M. and Samadi, N. 2012. Effect of soil acidification on growth indices and microelements uptake
by greenhouse cucumber. African Journal of Agricultural
Research, 7(11): 1659 –1665.
Grembecka, M., Malinowska, E. and Szefer, P. 2007. Differentiation of market coffee and its infusions in view
of their mineral composition. Science of the Total
Environment, 383: 59 -69.
Habtamu, M. 2008. Image analysis for Ethiopian coffee classification. M. Sc. Thesis, Addis Ababa University, Ethiopia.
Iwegbue, C.M.A. 2012. Metals contents in some brands of
biscuits consumed in southern Nigeria. American Journal
of Food Technology, 7(3): 160 - 167.
Table 10. Pearson correlation coefficient for metals in coffee beans and leaves with soil samples
Metals Mg K Ca Cr Mn Cu Zn Co Ni
Coffee beans
r 0.8811 0.3997 0.7929 0.6309 0.9994 0.9561 0.7577 0.7512 -0.1954
Coffee leaves
r 0.9972 0.4102 0.8716 - 0.9734 -0.7317 0.9996 0.6867 -0.3689
Jabeen, S., Shah, M.T., Khan, S. and Hayat, M.Q. 2010. Determination of major and trace elements in ten important
folk therapeutic plants of Haripur basin, Pakistan. Journal
of Medicinal Plants Research, 4(7): 559 - 566.
Karak, T. and Bhagat, R.M. 2010. Trace elements in tea
leaves, made tea and tea infusion: A review. Food
Research International 43: 2234 - 2252.
Khuda, F., Iqbal, Z., Zakiullah, Z., Khan, A., Nassir, F., Muhammad, N., Khan, J.A. and Khan, M.S. 2012. Metal analysis, phytotoxic, insecticidal and cytotoxic activities of selected medicinal plants of Khyber Pakhtunkhwa.
Pakistan Journal of Pharmacological Science, 25(1): 51-
58.
Kufa, T. 2010. Environmental sustainability and coffee
diversity in Africa. International Coffee Organization
(ICO) World Coffee Conference. 1 - 3.
Leung, A.O., Duzgoren-Aydin, N.S., Cheung, K.C. and Wong, M. H. 2008. Heavy metals concentrations of surface dust from e-waste recycling and its human health implications
in southeast China. Environmental Science and Technology
42(7): 2674 -2680.
Martin, M.J., Pablos, F. and Gonzalez, G. 1998. Characterization of green coffee varieties according to their
metal content. Analytica Chimica Acta, 358(2): 177 - 183.
Salama, A.K. and Radwan, M.A. 2005. Heavy metals (Cd, Pb) and trace elements (Cu, Zn) contents in some food stuffs
from the Egyptian market. Emirates Journal of
Agricultural Science, 17(1): 34 - 42.
Santos, E.J.D. and Oliveira, E.D. 2001. Determination of mineral nutrients and toxic elements in Brazilian soluble
coffee by ICP-AES. Journal of Food Composition and
Analysis, 14: 523 - 531.
Seenivasan, S., Manikandan, N., Muraleedharan, N.N. and Selvasundaram, R., 2008. Heavy metal content of black
teas from south India. Food Control, 19: 746 - 749.
Soetan, K.O., Olaiya, C.O. and Oyewole, O.E. 2010. The importance of mineral elements for humans, domestic
animals and plants: A review. African Journal of Food
Science, 4(5): 200 - 222.
Suseela, B., Bhalke, S., Kumar, A.V., Tripathi, R.M. and Sastry, V.N. 2001. Daily intake of trace metals through
coffee consumption in India. Food Additives and
Contaminants 18(2): 115 - 120.
Tornincasa, P., Furlan, M., Pallavicini, A. and Graziosi, G.,
2010. Coffee species and varietal identification. Tools for
Identifying Biodiversity: Progress and Problems. 307 -
313.
Van Jaarsveld, P., Faber, M., Van Heerden, I., Wenhold, F., Van Rensburg, W.J. and Van Averbeke, W. 2014. Nutrient content of eight African leafy vegetables and their potential
contribution to dietary reference intakes. Journal of Food
Composition and Analysis, 33: 77-84.
Weis, J.S. and Weis, P., 2004. Metal uptake, transport and release by wetland plants: implications for phytoremidation
and restoration. Environment International, 30: 685 - 700.
Yahaya, M.I., Ezeh, G.C., Musa, Y.F. and Mohammad, S.Y. 2010. Analysis of heavy metals concentration in road
side’s soil in Yauri, Nigeria. African Journal of Pure and
Applied Chemistry, 4(3): 022 - 030.
Yu, X., Bao, Z., Zou, J. and Dong, J. 2011. Coffee consumption and risk of cancers: A meta-analysis of cohort
studies. BioMedical Central Cancer 11:96, doi:
10.1186/1471-2407-11-96.
Zhu, Y., Narukawa, T., Inagaki, K., Kuroiwa, T. and Chiba, K. 2011. Development of a certified reference materials (NMIJ CRM 7505-a) for the determination of trace
elements in tea leaves. Analytical Sciences: The
International Journal of the Japan Society for Analytical
Chemistry, 27(11): 1149 - 1155.