497 Regular Article
PLANT MOLECULAR BIOLOGY
Genetic diversity analysis of colored and white rice genotypes using
Microsatellite (SSR) and Insertion-Deletion (INDEL) markers
Siddhi Patel, Rallapalli Ravikiran, Sudeshna Chakraborty*, Sneha Macwana, N. Sasidharan, Ruchi Trivedi and Bhushan Aher
Department of Agricultural Botany, Anand Agricultural University, Anand 388110, Gujarat, India
Abstract
Genetic diversity analysis of 19 coloured and white rice genotypes were conducted using 14 Simple Sequence Repeat (SSR) and 21 Insertion Deletion (INDEL) markers. Among them, polymorphic results were obtained for 9 SSR and 12 INDEL markers. The PIC values ranged from 0.36(RM484) to 0.78 (RM 167) and 0.50 (R9M20) and 0.81 (R9M10) for SSR and INDEL markers respectively. In the case of both SSR and INDEL markers highest genetic diversity was observed between Krishna Kamod (White pericarp) and IRST 1 (Red pericarp) whereas least genetic diversity was observed between Lal Kada (Red pericarp) and Krishna Kamod (White pericarp). However, it was also found that brown, black and red pericarp share more similarity among themselves. It was also observed that INDEL markers reveals greater diversity among the genotypes as compared to SSR markers which was indent from the low average similarity index observed in the former. On the whole INDEL markers were found to be more efficient than SSR markers for diversity analysis.
Key words: Red rice, SSR, INDEL, Polymorphism, Heterozygosity
Introduction
Rice is the second most important cereal crop in the world. Among the rice growing countries in the world, India has the second largest area under rice crop (about 45 million ha) and ranks second in production next to China. In Asia, traditionally, rice with varied colours such as red, purple, brown yellow and green have been grown. Coloured rice has been preferred in the past for their special features in medicinal value and exclusive taste as compared to common rice. Coloured rice have higher concentrations of protein, total essential amino acids, vitamin B1 and minerals (Suzuki et al., 2004; Yoshida et al., 2010). In India, coloured rice is prevalent in pockets of South, North western and North eastern Himalayan region (Deepa et al., 2008). The red rice was preferred by people in many parts of India, Sri-Lanka and Bhutan. Two
loci have been identified using classical genetic
analysis for red pericarp coloration, Rc (brown
pericarp and seed coat) and Rd (red pericarp and
seed coat). When present together these loci
produce red seed colour whereas Rdin the absence
of Rc provides brown seeds whereas Rc alone has
no phenotype (Kato and Lshikawa, 1921). A
mutation in theRcgene that changed the red seed
of wild rice into the white seeds of modern rice is shared by a large majority of rice varieties, regardless of subspecies (Megan et al., 2007). The study of morpho-agronomic variability is the classical way of assessing genetic diversity for plant breeders. Genetic marker screening is based on the survey of genetic diversity as revealed by variation at specific gene loci and provides information about the amount and distribution of genetic diversity within and among populations (Buu and Lang., 1999). A wide variety of DNA markers such as Restriction Fragment Length
Polymorphism (RFLP), Amplified Fragment
Length Polymorphism (AFLP), Simple Sequence Repeat (SSR), Insertion/Deletion markers (INDEL) etc. have been extensively used in rice for genetic diversity analysis, phylogenetic and evolutionary studies, mapping and tagging genes for quantitative traits of agronomic importance and Marker Assisted Selection(MAS). Molecular markers like Received 30 June 2013; Revised 18 February 2014; Accepted
22 February 2014; Published Online 25 March 2014 *Corresponding Author
Sudeshna Chakraborty
Department of Agricultural Botany, Anand Agricultural University, Anand 388110, Gujarat, India
Siddhi Patel et al.
RAPD, AFLP are extensively been used to quantify the inter-specific, intra-specific and inter-generic variability in different plant groups and crop varieties (Pawar et al., 2013). Kibria et al. (2009) has screened several rice varieties for studying the genetic diversity by using SSR and RAPD markers.
SSR markers can estimate genetic diversity between cultivars e.g. between parents of genepool or between plants extracted from a population or between populations. Microsatellites are more powerful for the identification of within cultivar variation (Lapitan et al., 2007). Zhou et al. (2003) investigated the genetic diversity and genetic
structure of natural populations of O. rufipogon in
China using SSR markers and information was found to be significant. Steele et al. (2008) reported that a genome wide rice polymorphism database developed by Shen et al. (2004) contains more than
4,00,000 insertion/ deletion polymorphisms
(InDels). They used 50 insertion/ deletion markers
(InDels) for distinguishing between indica and
japonica variety. These are co- dominant markers
that give two possible alleles according to presence or absence of insertion sequence, situated between the primers.
The present research is envisaged with an objective to access genetic diversity among 19 colored rice genotypes (selected according to the availability of genotypes) linked SSR markers as these markers are highly polymorphic and easy to detect. The INDELs selected were identified from 12 chromosomal locations.
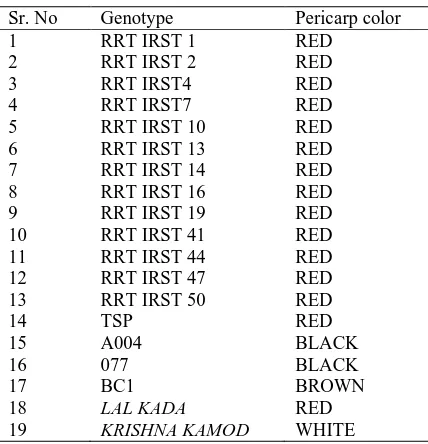
Table 1. List of genotypes used in the present study.
Sr. No Genotype Pericarp color
1 RRT IRST 1 RED
2 RRT IRST 2 RED
3 RRT IRST4 RED
4 RRT IRST7 RED
5 RRT IRST 10 RED
6 RRT IRST 13 RED
7 RRT IRST 14 RED
8 RRT IRST 16 RED
9 RRT IRST 19 RED
10 RRT IRST 41 RED
11 RRT IRST 44 RED
12 RRT IRST 47 RED
13 RRT IRST 50 RED
14 TSP RED
15 A004 BLACK
16 077 BLACK
17 BC1 BROWN
18 LAL KADA RED
19 KRISHNA KAMOD WHITE
Materials and Methods
The study was conducted at Plant Biotechnology Laboratory, Department of Agricultural Botany, B.A
College of Agriculture, Anand Agricultural
INDEL bands. The Jaccard’s coefficients between each pair of accessions were used to construct a dendrogram using the unweighted pair group method with arithmetic averages (UPGMA). The PIC, hetrozygosity, and allelic diversity measures marker informativeness and allelic and genotypic frequency were calculated. These measures are calculated using PROC ALLELE procedure of SAS/GENETICS 9.3 version.
Results and Discussion
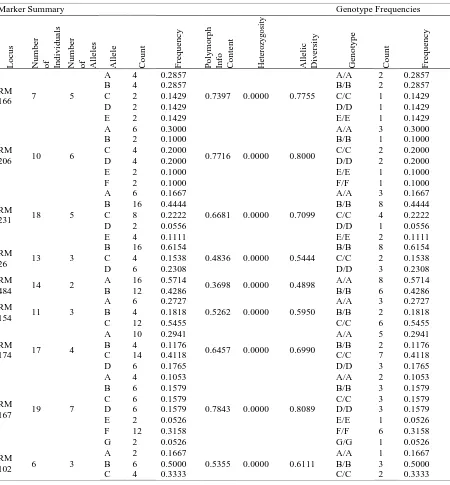
The present investigation on assessment of pigmented colored rice varieties was carried out in the Biotechnology Laboratory of Department of Agricultural Botany, B. A. College of Agriculture, Anand Agriculture University, Anand, Gujarat, India. Total of 14 SSR and 21 INDEL markers were used for the study out of which 9 SSR markers and 12 INDEL markers gave polymorphic results (Table 2).
Microsatellite (SSR) markers are the PCR based markers that have been developed in many plant species; they have an advantage of being multi allelic, highly polymorphic and codominant. In the present study total of 14 primers were used to
generate fingerprint of 19 genotypes of Oryza sativa
among which nine succeeded to produce
polymorphic or monomorphic alleles when applied with rice cultivars generating 129 bands. The level of
polymorphism among the varieties was evaluated by calculating the PIC values for each of the nine
microsatellite markers. Among the nine
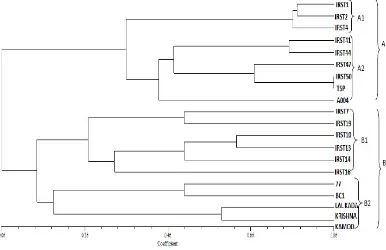
microsatellite markers used lowest PIC of 0.36 was recorded in RM 484 while highest PIC of 0.78 was obtained with RM 167. The Cluster analysis divided the genotypes into two major groups A and B. In this group TSP and IRST50 showed highest genetic similarity. First cluster (A) was further sub-divided into two minor clusters i.e., A1 and A2. Second major cluster B included two minor clusters B1 and B2 (Figure 1). The second major cluster indicated that black and brown rice are genetically more closely related to red rice. Highest genetic diversity
was shown between Krishna Kamod and IRST1
whereas least genetic diversity was observed
between Lal Kadaand Krishna Kamod, IRST1 and
IRST2. In the present study multiple loci were detected by RM 166, RM484, RM154, RM174, RM167 and RM102. Occurrence of rare alleles might have resulted from unequal crossing over, translocation, other types of mutation or residual heterozygosity (Lapitan et al., 2007). Similar work has been carried out by Rajguru et al. (2005) where genetic diversity between white and red rice varieties was studied through SSR markers. They also found substantial difference between colored rice with microsatellite markers.
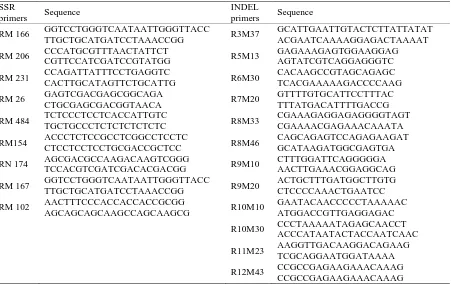
Table 2. list of SSR and INDEL primers for characterizing 19 genotypes.
SSR
primers Sequence
INDEL
primers Sequence
RM 166 GGTCCTGGGTCAATAATTGGGTTACCTTGCTGCATGATCCTAAACCGG R3M37 GCATTGAATTGTACTCTTATTATATACGAATCAAAAGGAGACTAAAAT
RM 206 CCCATGCGTTTAACTATTCT
CGTTCCATCGATCCGTATGG R5M13
GAGAAAGAGTGGAAGGAG AGTATCGTCAGGAGGGTC
RM 231 CCAGATTATTTCCTGAGGTC
CACTTGCATAGTTCTGCATTG R6M30
CACAAGCCGTAGCAGAGC TCACGAAAAAGACCCCAAG
RM 26 GAGTCGACGAGCGGCAGA
CTGCGAGCGACGGTAACA R7M20
GTTTTGTGCATTCCTTTAC TTTATGACATTTTGACCG
RM 484 TCTCCCTCCTCACCATTGTC
TGCTGCCCTCTCTCTCTCTC R8M33
CGAAAGAGGAGAGGGGTAGT CGAAAACGAGAAACAAATA
RM154 ACCCTCTCCGCCTCGGCCTCCTC
CTCCTCCTCCTGCGACCGCTCC R8M46
CAGCAGAGTCCAGAGAAGAT GCATAAGATGGCGAGTGA
RN 174 AGCGACGCCAAGACAAGTCGGG
TCCACGTCGATCGACACGACGG R9M10
CTTTGGATTCAGGGGGA AACTTGAAACGGAGGCAG
RM 167 GGTCCTGGGTCAATAATTGGGTTACC
TTGCTGCATGATCCTAAACCGG R9M20
ACTGCTTTGATGGCTTGTG CTCCCCAAACTGAATCC
RM 102 AACTTTCCCACCACCACCGCGG
AGCAGCAGCAAGCCAGCAAGCG R10M10
GAATACAACCCCCTAAAAAC ATGGACCGTTGAGGAGAC
R10M30 CCCTAAAAATAGAGCAACCT ACCCATAATACTACCAATCAAC
R11M23 AAGGTTGACAAGGACAGAAG TCGCAGGAATGGATAAAA
Siddhi Patel et al.
Figure 1. Dendrogram of genetic relationship among rice genotypes based on SSR markers.
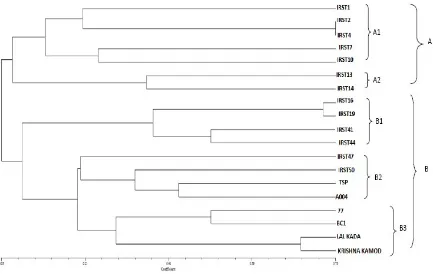
A total of 21 INDEL markers were screened out of which only 12 INDEL markers showed expected results. Highest numbers of polymorphic bands were observed in R5M13, R8M46 and R9M10. The highest PIC of 0.81 was recorded in R9M10 while lowest of 0.50 was obtained in R9M20. The level of polymorphism among the varieties was evaluated by calculating the number and PIC values for each of the 9 microsatellite markers evaluated. The dendrogram divides the varieties into two major groups i.e. A and B. Line between the genotypes IRST2 and IRST4 indicates that they have highest genetic similarity. First cluster (A) was further sub-divided into two minor clusters, first minor cluster (A1) comprised of IRST1, IRST2, IRST4, IRST7 and IRST10. Second A2 comprised of IRST13 and IRST 14. Second major cluster (B) included three minor clusters, first minor cluster (B1) comprised IRST16, IRST19, IRST41 and IRST44. Second minor cluster (B2) included IRST47, IRST50, TSP, and A004. While
third minor cluster (B3) consisted of 077, BC1, Lal
Kada, Krishna Kamod. Second major cluster
depicted black and brown rice, which were genetically closely related to red rice (Figure 2). Similar work has been carried out by Yu et al. (2002) where SSR and INDEL markers were used for diversity between several rice genotypes. Xingxing et al. (2007) validated the INDEL primer pairs based on the comparative genomic study on DNA sequences between several rice species. The result revealed that out of 45 INDEL primers used
41 could accurately identify indica and japonica
rice varieties with reliability over 80%.
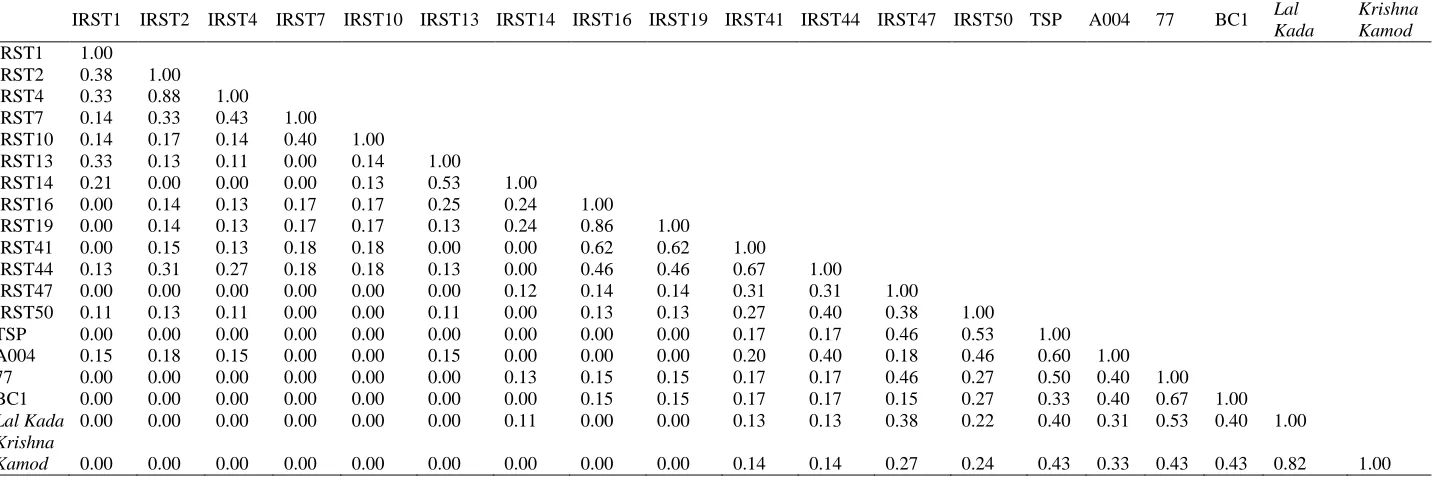
0.88 (Table 4). Highest similarity (0.88) found between IRST2 and IRST4.Average similarity index observed was 0.74 in SSR whereas 0.17 in INDEL. Thus, it can be inferred that less diversity was detected using SSR markers as it is evident from its similarity value.
Arithmetic mean heterozygosity Allelic
diversity, polymorphism information content (PIC) and marker indices (MI) are measures for detecting polymorphism and comparing efficiency of markers. PIC is a quantification of the number of
alleles that a marker has and the frequency of each of the alleles in the subset of germplasm tested. Since, a marker with fewer alleles has less power to distinguish several samples, and alleles present at low frequency have less power to distinguish, a higher PIC is assigned to a marker with many alleles and with alleles present at roughly equal proportions in the population (Jiang et al., 2010). Among 9 SSR markers and 12 INDEL markers highest PIC value was obtained for INDEL marker R9M10 0.81.
Emir. J. Food Agric. 2014. 26 (6): 497-507 doi: 10.9755/ejfa.v26i6.15722
http://www.ejfa.info/
502
Table 3. Similarity matrix of rice genotypes based on SSR markers.
IRS T1
IRS T2
IRS T4
IRS T7
IRST 10
IRST 13
IRST 14
IRST 16
IRST 19
IRST 41
IRST 44
IRST 47
IRS T50 TSP
A00
4 77 BC1
Lal Kada
Krishna Kamod
IRST1 1
IRST2 0.92 1.00 IRST4 0.90 0.92 1.00 IRST7 0.69 0.77 0.69 1.00 IRST10 0.59 0.67 0.59 0.79 1.00 IRST13 0.59 0.67 0.59 0.79 0.85 1.00 IRST14 0.64 0.67 0.59 0.74 0.74 0.85 1.00 IRST16 0.74 0.82 0.74 0.90 0.79 0.85 0.85 1.00 IRST19 0.69 0.77 0.69 0.90 0.74 0.79 0.74 0.90 1.00 IRST41 0.74 0.82 0.74 0.85 0.69 0.74 0.69 0.85 0.90 1.00 IRST44 0.74 0.82 0.74 0.85 0.69 0.74 0.69 0.85 0.90 0.95 1.00 IRST47 0.79 0.87 0.79 0.69 0.64 0.64 0.64 0.74 0.74 0.79 0.79 1.00 IRST50 0.77 0.85 0.77 0.77 0.67 0.72 0.67 0.77 0.82 0.87 0.87 0.87 1.00 TSP 0.77 0.85 0.77 0.77 0.72 0.77 0.67 0.77 0.82 0.87 0.87 0.87 0.95 1.00 A004 0.82 0.85 0.77 0.82 0.67 0.72 0.72 0.82 0.82 0.87 0.87 0.77 0.85 0.85 1.00 77 0.67 0.74 0.67 0.82 0.77 0.77 0.77 0.87 0.82 0.77 0.77 0.67 0.69 0.69 0.74 1.00 BC1 0.72 0.79 0.72 0.82 0.77 0.77 0.77 0.87 0.82 0.82 0.82 0.72 0.74 0.74 0.79 0.90 1.00
Lal Kada 0.56 0.64 0.56 0.67 0.62 0.67 0.72 0.72 0.67 0.67 0.67 0.56 0.64 0.59 0.64 0.79 0.74 1.00
503
Table 4. Similarity matrix of rice genotypes based on INDEL markers.
IRST1 IRST2 IRST4 IRST7 IRST10 IRST13 IRST14 IRST16 IRST19 IRST41 IRST44 IRST47 IRST50 TSP A004 77 BC1 Lal
Kada
Krishna Kamod
IRST1 1.00 IRST2 0.38 1.00
IRST4 0.33 0.88 1.00
IRST7 0.14 0.33 0.43 1.00 IRST10 0.14 0.17 0.14 0.40 1.00
IRST13 0.33 0.13 0.11 0.00 0.14 1.00
IRST14 0.21 0.00 0.00 0.00 0.13 0.53 1.00
IRST16 0.00 0.14 0.13 0.17 0.17 0.25 0.24 1.00
IRST19 0.00 0.14 0.13 0.17 0.17 0.13 0.24 0.86 1.00
IRST41 0.00 0.15 0.13 0.18 0.18 0.00 0.00 0.62 0.62 1.00
IRST44 0.13 0.31 0.27 0.18 0.18 0.13 0.00 0.46 0.46 0.67 1.00
IRST47 0.00 0.00 0.00 0.00 0.00 0.00 0.12 0.14 0.14 0.31 0.31 1.00
IRST50 0.11 0.13 0.11 0.00 0.00 0.11 0.00 0.13 0.13 0.27 0.40 0.38 1.00
TSP 0.00 0.00 0.00 0.00 0.00 0.00 0.00 0.00 0.00 0.17 0.17 0.46 0.53 1.00 A004 0.15 0.18 0.15 0.00 0.00 0.15 0.00 0.00 0.00 0.20 0.40 0.18 0.46 0.60 1.00 77 0.00 0.00 0.00 0.00 0.00 0.00 0.13 0.15 0.15 0.17 0.17 0.46 0.27 0.50 0.40 1.00 BC1 0.00 0.00 0.00 0.00 0.00 0.00 0.00 0.15 0.15 0.17 0.17 0.15 0.27 0.33 0.40 0.67 1.00
Lal Kada 0.00 0.00 0.00 0.00 0.00 0.00 0.11 0.00 0.00 0.13 0.13 0.38 0.22 0.40 0.31 0.53 0.40 1.00
Krishna
Emir. J. Food Agric. 2014. 26 (6): 497-507 doi: 10.9755/ejfa.v26i6.15722
http://www.ejfa.info/
A more specific comparison of overall efficiency of two marker systems was provided by marker index (MI). Comparison of the marker index values revealed high level of polymorphism in INDEL (0.23) than SSR (0.19) (Tables 5, 6). Mean allelic diversity for 9 SSR markers were found to be 0.67 and 0.64 for 12 INDEL markers which indicated that the diversity detected by INDEL was more than SSR. The arithmetic mean
heterozygosity across all loci was 0.61 and 0.60 for SSR and INDEL marker respectively. All the measures used to compare the efficiency of the two markers indicated that there was higher level of polymorphism detected by INDEL than SSR markers, thus it can be concluded that INDEL markers was more efficient than SSR in the present study.
Table 5. SSR marker analysis by statistical analysis system (SAS) software.
Marker Summary Genotype Frequencies
L o cu s N u m b er o
f Indiv
id u al s N u m b er o
f Allel
es A ll el e C o u n t F re q u e n c y P o ly m o rp h In fo C o n te n t H et er o zy g o si ty A ll el ic D iv er si ty G en o ty p e C o u n t F re q u e n c y RM
166 7 5
A 4 0.2857
0.7397 0.0000 0.7755
A/A 2 0.2857
B 4 0.2857 B/B 2 0.2857
C 2 0.1429 C/C 1 0.1429
D 2 0.1429 D/D 1 0.1429
E 2 0.1429 E/E 1 0.1429
RM
206 10 6
A 6 0.3000
0.7716 0.0000 0.8000
A/A 3 0.3000
B 2 0.1000 B/B 1 0.1000
C 4 0.2000 C/C 2 0.2000
D 4 0.2000 D/D 2 0.2000
E 2 0.1000 E/E 1 0.1000
F 2 0.1000 F/F 1 0.1000
RM
231 18 5
A 6 0.1667
0.6681 0.0000 0.7099
A/A 3 0.1667
B 16 0.4444 B/B 8 0.4444
C 8 0.2222 C/C 4 0.2222
D 2 0.0556 D/D 1 0.0556
E 4 0.1111 E/E 2 0.1111
RM
26 13 3
B 16 0.6154
0.4836 0.0000 0.5444
B/B 8 0.6154
C 4 0.1538 C/C 2 0.1538
D 6 0.2308 D/D 3 0.2308
RM
484 14 2
A 16 0.5714
0.3698 0.0000 0.4898 A/A 8 0.5714
B 12 0.4286 B/B 6 0.4286
RM
154 11 3
A 6 0.2727
0.5262 0.0000 0.5950
A/A 3 0.2727
B 4 0.1818 B/B 2 0.1818
C 12 0.5455 C/C 6 0.5455
RM
174 17 4
A 10 0.2941
0.6457 0.0000 0.6990
A/A 5 0.2941
B 4 0.1176 B/B 2 0.1176
C 14 0.4118 C/C 7 0.4118
D 6 0.1765 D/D 3 0.1765
RM
167 19 7
A 4 0.1053
0.7843 0.0000 0.8089
A/A 2 0.1053
B 6 0.1579 B/B 3 0.1579
C 6 0.1579 C/C 3 0.1579
D 6 0.1579 D/D 3 0.1579
E 2 0.0526 E/E 1 0.0526
F 12 0.3158 F/F 6 0.3158
G 2 0.0526 G/G 1 0.0526
RM
102 6 3
A 2 0.1667
0.5355 0.0000 0.6111
A/A 1 0.1667
B 6 0.5000 B/B 3 0.5000
Table 6. INDEL marker analysis by statistical analysis system (SAS) software.
Marker Summary Genotype Frequencies
L o c u s G en o ty p e C o u n t F re q u en cy C o u n t F re q u en cy P o ly m o rp h In fo C o n te n t H et er o zy g o si ty A ll el ic D iv er si ty G en o ty p e C o u n t F re q u en cy
R3M37 1 1 A 2 1.0000 0.0000 0.0000 0.0000 A/A 1 1.0000
R5M13 7 4
A 2 0.1429
0.6414 0.0000 0.6939
A/A 1 0.1429
B 4 0.2857 B/B 2 0.2857
C 2 0.1429 C/C 1 0.1429
D 6 0.4286 D/D 3 0.4286
R6M30 8 3
A 4 0.2500
0.5547 0.0000 0.6250
A/A 2 0.2500
B 4 0.2500 B/B 2 0.2500
C 8 0.5000 C/C 4 0.5000
R7M20 17 4
A 20 0.5882
0.5290 0.0000 0.5813
A/A 10 0.5882
B 2 0.0588 B/B 1 0.0588
C 8 0.2353 C/C 4 0.2353
D 4 0.1176 D/D 2 0.1176
R8M33 4 4
A 2 0.2500
0.7031 0.0000 0.7500
A/A 1 0.2500
B 2 0.2500 B/B 1 0.2500
C 2 0.2500 C/C 1 0.2500
D 2 0.2500 D/D 1 0.2500
R8M46 19 5
A 14 0.3684
0.7085 0.0000 0.7479
A/A 7 0.3684
B 10 0.2632 B/B 5 0.2632
C 4 0.1053 C/C 2 0.1053
D 4 0.1053 D/D 2 0.1053
E 6 0.1579 E/E 3 0.1579
R9M10 7 3
A 4 0.2857
0.5015 0.0000 0.5714
A/A 2 0.2857
B 2 0.1429 B/B 1 0.1429
C 8 0.5714 C/C 4 0.5714
R9M20 14
4
A 2 0.0714
0.5407 0.0000 0.6122
A/A 1 0.0714
B 10 0.3571 B/B 5 0.3571
C 14 0.5000 C/C 7 0.5000
D 2 0.0714 D/D 1 0.0714
R10M10 10 7
A 2 0.1000
0.7978 0.0000 0.8200
A/A 1 0.1000
B 2 0.1000 B/B 1 0.1000
C 2 0.1000 C/C 1 0.1000
D 6 0.3000 D/D 3 0.3000
E 2 0.1000 E/E 1 0.1000
F 2 0.1000 F/F 1 0.1000
G 4 0.2000 G/G 2 0.2000
R10M30 14 8
A 2 0.0714
0.8058 0.0000 0.8265
A/A 1 0.0714
C 2 0.0714 C/C 1 0.0714
D 2 0.0714 D/D 1 0.0714
E 8 0.2857 E/E 4 0.2857
F 6 0.2143 F/F 3 0.2143
G 2 0.0714 G/G 1 0.0714
H 2 0.0714 H/H 1 0.0714
I 4 0.1429 I/I 2 0.1429
R11M23 12
5 A 10 0.4167
0.6990 0.0000 0.7361
A/A 5 0.4167
B 4 0.1667 B/B 2 0.1667
C 4 0.1667 C/C 2 0.1667
D 4 0.1667 D/D 2 0.1667
E 2 0.0833 E/E 1 0.0833
R12M43 18 5
A 6 0.1667
0.6859 0.0000 0.7222
A/A 3 0.1667
B 16 0.4444 B/B 8 0.4444
C 4 0.1111 C/C 2 0.1111
D 4 0.1111 D/D 2 0.1111
Siddhi Patel et al.
Conclusion
Characterization and quantification of genetic diversity have been a major goal in evolutionary biology. Information of genetic diversity within and among closely related crop varieties is essential for a rational use of genetic resources. Information regarding genetic variability at molecular level could be used to help, indentify and develop genetically unique germplasm that compliments existing cultivars. The present work will be a boon for plant breeders in choosing the varieties for generating a new hybrid. It can be concluded that among 19 genotypes, the preferable genotype for
crossing is IRST 1 and Krishna kamod as it has
highest genetic diversity and thus maximum heterosis can be exploited by crossing the varieties
IRST 1 and Krishna kamod.
References
Ahmadikhah, A. and G. I. Karlov. 2006. Molecular
mapping of the fertility restoration gene Rf4
for WA cytoplasmic male sterility in rice. Plant
Breed.125:363-367.
Buu, B. B. and N. Lang. 1999. Using molecular markers in study of rice genetic diversity. Omonrice 7:15-25.
Deepa, G., V. Singh and K. A. Naidu. 2008. Nutrient composition and physicochemical properties of Indian medicinal rice-Njavara. Food. Chem. 106(1):165-171.
Jiang, S. K., H. Cheng, Y. J. Wang, W. F. Chen and J. X. Zeng. 2010. Development of a Highly Informative Microsatellite (SSR) Marker
Framework for Rice (Oryza sativa L.)
Genotyping. Agri. Sci. China. 9(12):1697-1704.
Kato, S. and J. Ishikawa. 1921. On the inheritance of the pigment of red rice. Japan J. Genet.1:1– 7.
Kibria, K., F. Nur, S. N. Begum, M. M. Islam, S. K. Paul, K. S. Rahman and M. N. Azam. 2009. Molecular marker based genetic diversity analysis in aromatic rice genotypes using SSR and RAPD markers. Int. J. Sustain. Crop Prod. 4(1):23-34.
Lapitan,V. C., D. S. Brar, T. Abe and D Redona. 2007. Assessment of genetic diversity of Philippine Rice cultivars carrying good quality traits using SSR markers. Breed. Sci. 57:267-270.
Megan, T. S., M. J. Thomson, B. E. Pfeil and S. McCoucha. 2006. Caught Red-Handed: Rc
Encodes a Basic Helix-Loop-Helix Protein Conditioning Red Pericarp in rice. The Pl. Cell. 18:283–294.
Pawar, U. R., J. Baskaran, I. P. Ajithkumar and R.
Panneerselvam. 2013. Genetic variation
between Xylocarpus spp. (Meliaceae) as revealed by Random Amplified Polymorphic DNA (RAPD) markers. Emir. J. Food Agric. 25(8):597-604.
Rajguru, S. N. N. R. Burgos, V. K. Shivrain and J. M Steward. 2005. Mutations in the red rice ALS gene associated with resistance to imazethapyr. Weed Sci. 53(5):567-577.
Shen, Y. J., H. Jiang, J. P. Jin, Z.B.Zhang, Y. Y. He, G. Wang, C. Wang, L. Qian, X. Li, Q.B.Yu, H. J. Liu, D. H. Chen, J. H. Gao, H. Huang, T. L. Shi and Z. N. Yang. 2004.
Development of genome-wide DNA
polymorphism database for map-based cloning of rice genes. Plant Physiol. 135:1198–1205. Steele, K. A., R. Ogden, R. Mcewing, H. Briggs
and J. Gorham. 2008. Indel markers
distinguish Basmatis from other fragrant rice varieties. Field Crops Res. 105:81-87.
Suzuki, M., T. Kimura, K. Yamagishi, H. Shinmoto and K. Yamaki. 2004. Comparison of mineral contents in 8 cultivars of pigmented brown rice. Nippon. Shokuhin. Kagaku. Kogaku. Kaishi. 51:424-427.
Tao,C., D. Zang, Z. Zhen, Z. Ling, Z.Q. Yong, Z. L. Hui, Y. Shu, Y. Xin and W. C. Line. 2014. Development of New Indel marker to detect genotypes of Rf-1a conferring fertility restoration of BT- type cytoplasmic male sterility in rice. Rice Sci. 21(1):13-19.
Xingxing, C., J. Liu, Y. Qiu, W. Zhao, Z. Song and
B. Lu. 2007. Differentiation of
indica-japonica rice revealed by insertion/ deletion
(Indel) fragments obtained from the
comparative genomic study of DNA sequences between ’93-11’ (indica) and ‘Nipponbare’ (japonica). Front. Biol. China. 2:291-296. Yu, J., J. Wang, G. K. S. Wong, S. Li, B. Liu, Y.
Deng, L. Dai, Y. Zhong and X. Zhang. 2002.
A draft sequence of the rice genome (Oryza
sativaL.). Science 296:79-92.
Zeng, Y. X., Z. H. Wen, L.Y. Ma, Z. J. Ji, X. M. Li and C. D. Yang. 2013. Development of 1047 insertion deletion markers for rice genetic studies and breeding. Genet. Mol. Res. 12(4):5226-5235.
Zhou, H., Z. Xie and S. Ge. 2003. Microsatellite analysis of genetic diversity and population
genetic structure of a wild rice (Oryza
rufipogon Griff.) in China. Theor. Appl.