Understanding the innovativeness of information
technology products and service providers in an IT
cluster in Nigeria
Williams E. Nwagwu
1and Stanley Ibeku
2[email protected] ORCID: orcid.org/0000-0002-5225-2934 [email protected] ORCID: orcid.org/0000-0001-9942-3641
Received: 04 July 2016 Accepted: 01 August 2016
Every society has social and other systems that encourage and promote, or otherwise, individuals to engage in creative processes and/or support new ideas and experimentation that may result in new products, services or technological processes. This study examined how the most popular innovation variables provide explanation for the capacity of information technology (IT) products and service providers in the Otigba Computer Hardware Cluster in Lagos, Nigeria to devise and harness new strategies of solving IT problems. The study also investigated the respondents’ capacity to acquire, assimilate, transform and use knowledge, and the relationship between these capacities and their innovativeness. Data were collected from 273 respondents with the aid of a questionnaire and an indepth interview schedule. The study confirms the importance of stronger networking for transfer of knowledge by showing that the respondents’ interaction with knowledge sources has strong relationship with their capacity to innovate, acquire, understand and use knowledge. However, innovativeness among the operators in the cluster is not necessarily a function of the traditional innovation variables of absorptive, acquisition, transformation, exploitation and other capacities. The capacity to transform knowledge into applications has a significant effect on the capacity of the operators to introduce new ideas, processes and techniques. Findings from the interviews reveal that the information technology products and service providers are able to devise new ways of solving old and new IT problems, especially as they relate to computer hardware. Research on innovativeness among operators in this cluster must seek explanation from local circumstances in addition to the popular recognised variables.
Keywords: Innovation, information technology, innovation capacity, Otigba
1 Introduction and Background to the Study
Innovation involves devising and/or applying existing technologies, methods and ideas to achieve better solutions to the problems of the human society. It involves the application of creativity to meet both existing and new market needs through development of more effective products, processes, services, technologies or ideas (Maranville 1992). Innovation also encompasses new ways of using new or old products, services or processes, as well as the introduction, diffusion and adaptation of new artifacts into the society. Innovation may replace existing products; it could also enhance them (Tushman and Anderson 2004). The capacity to imbibe and introduce new ideas, new techniques and new processes is referred to as innovativeness. Innovativeness reflects a social system’s tendency to engage in and support new ideas, experimentation and creative processes that may result in new products, services or technological processes (Rhee, Park and Lee 2010). Also, it is the measure of the extent to which the adaptation of new and old technologies and knowledge addresses the challenges of the society.
Firms that are located in clusters are believed to have higher chances of being innovative than those isolated (Baptista and Swann 1998, Porter 1998, West 2001); they are able to achieve interaction with different types of actors (Tepic et al. 2012, Baptista and Swann 1998, Porter 1998, West 2001). Operating in clusters facilitates easy collaboration and forming of, and working in, teams. It also promotes faster circulation and easy acquisition of ideas and information from customers, employees and competitors. For example, feedback from customers on products could be useful in the subsequent modification or design of products or in the improvement of services. In clusters, organisations are able to identify, acquire and absorb ideas required for building skills in both the immediate and wider environments. In a recent paper, Pouris (2016) said that clusters make it possible for firms, higher education and research institutions, and other entities to come together and facilitate collaboration on complementary social, technological and economic activities. A
1. Williams E. Nwagwu is Head of Programme at the Documentation, Information and Communication Centre for the Council for the Development of Social Science Research in Africa, Dakar, Senegal. He is also a Research Fellow at the Department of Information Science, University of South Africa, Pretoria, South Africa. He is affiliated to the Africa Regional Centre for Information Science, University of Ibadan, Nigeria
typical example of an information technology (IT) cluster is the Otigba Computer Hardware Cluster located in Lagos, Nigeria.
1.2 The Otigba Computer Hardware Cluster in Lagos, Nigeria
Bamiro (2003), Oyelaran-Oyeyinka (2007) andNwagwu and Idowu (2015) have studied the emergence and rapid growth (and other aspects) of a cluster of information technology products and service providers in Nigeria, most of whose activities Nwagwu and Idowu (2015) have described as “artisanal”. These operators do not necessarily have formal training in information technology or related disciplines. Their skills are, in the majority, acquired through informal apprenticeship systems. The operators in these clusters depend on informal knowledge to be able to develop themselves in order to tackle IT problems effectively. To perform well, they are able to identify and absorb knowledge from the immediate and wider environments; they also interact with different types of actors for the achievement and accumulation of relevant information and knowledge that may help them realise different types of innovations. The largest and main computer hardware, software and service cluster in Nigeria is the Otigba Computer Hardware Cluster in Lagos.
According to Oyelaran-Oyeyinka (2014), this network organisation of suppliers, buyers, clone builders and components traders has generated an intensely competitive environment and a local milieu that provides for a significant knowledge base for the future of Nigeria’s IT revolution. According to the Small and Medium Enterprises Development Agency of Nigeria (SMEDAN) (2005), the Computer and Allied Products Association of Nigeria (CAPDAN), which is the association of IT operators, had about 3,500 registered enterprises, with about 8,000 to 10,000 employees, excluding their employers. In addition to these, Oyelaran-Oyeyinka (2014) has observed that there are also about 1,500 street operators.
Besides Oyelaran-Oyeyinka’s study (2014), Abiola (2006) evaluated the IT enterprises in the cluster in terms of their size capacity, performance and modes of operation and sustainability. Using a questionnaire, Abiola (2006) found that they had an average size of eight, a relatively strong skills base, very high employment generation capacity, and cooperative competition. Drawing on the concepts of industrial clusters and multidimensional poverty in Nigeria, Oyelaran-Oyeyinka (2014) studied the impact of the cluster on the standard of living and poverty alleviation among the employees in the cluster. Employing a methodological framework that combined survey questionnaires, subjective versus objective measures of living standards, diverse informant interviews, and archival research, the findings revealed that the cluster positively impacts on the standard of living of the employees and that more than half of the employees have improved water, sanitation and cooking fuel options, while owning assets such as radios, refrigerators and televisions in their houses.
Despite the relative high focus of research in this cluster, no studies have addressed such questions as: Do the IT products and service providers have the capacity to innovate? Are the engineers/artisans even aware that they could be introducing new ideas, new techniques, new products and processes? What is the networking behavior of members of the cluster? Do the members of the cluster have sufficient skills to innovate? What is their capacity to acquire, assimilate, transform and use knowledge for innovation? These concepts have been studied in-depth in the innovation literature (Klerkx and Leeuwis 2009, Tepic et al. 2012, Hansen 1999, Reagans and McEvily 2003, Nooteboom et al. 2007).
1.3 Objectives and justification of the study
The study investigates the capacity of the information technology products and service providers in Otigba in Lagos, Nigeria, to acquire, assimilate, transform and use knowledge, and the relationship between these capacities and their innovativeness. The study also examines how the networking behaviour, knowledge acquisition, assimilation, transformation and exploitation capacities of the information technology products and service providers relate to their innovativeness. Generally, this study will highlight the extent to which popular innovation variables are able to provide explanation for the innovativeness in a technology cluster in Nigeria. The study will also provide impetus for looking for explanation for the innovativeness in the cluster in other variables, thus enriching the options for improving the ability of innovators to address issues related to their areas of mandate.
2 Conceptual setting
It is generally accepted and common in the literature that the networking behaviour, knowledge acquisition and assimilation capacity of innovators, as well as their absorptive and transformative capacities, are key variables that influence innovativeness. These concepts are reviewed very briefly below.
2.1 Networking behaviour
with external sources relate to the acquisition of explicit knowledge (Hansen 1999, Reagans and McEvily 2003, Nooteboom et al. 2007, Tepic et al. 2012).
2.2 Acquisition capacity
Acquisition capacity refers to an individual’s capability to identify and acquire externally generated knowledge that is critical to his/her operations (Zahra and George 2002). It is the ability of an individual or organisation to recognise and obtain knowledge that is external to the self or the organisation as a useful resource in the process of innovation; it is a very important element in gaining insight into innovativeness (Indarti 2010).
2.3 Absorptive capacity
Acquired knowledge must be understood and incorporated into tasks. High absorptive capacity promotes the speed, frequency, and magnitude of innovation, which in turn generates new knowledge (van den Bosch, Volberda & de Boer 1999). There are internal and external factors that facilitate absorptive capacity. The internal factors include: (i) level of education: Arjona (2013) has shown that level of education is a determinant in this regard – the higher the level of educational training of individuals, the higher their ability to assimilate and use new knowledge; (ii) number of employees: Lee and Sung (2005) showed that size of a firm, as measured by the number of employees, is significantly related to volume of research and development activities, which is often used as an indicator to measure a firm’s absorptive capacity; (iii) prior related knowledge: prior knowledge base is the sum of all individual units of knowledge within an organisation – according to Kim (1998), prior related knowledge has a positive effect on absorptive capacity; it determines the level of a person’s ability to perform the principal activities of acknowledging the value of the new knowledge, assimilating it, and applying it for commercial and other ends (Cohen and Levinthal 1990); (iv) the presence of gatekeepers: the gatekeepers’ role is to create a language that can be understood by different parties involved in the innovation process and can improve a firm’s absorptive capacity through knowledge sharing. Gradwell (2003) has shown that the gatekeeper is an interface that scans the environment for relevant knowledge and transforms this information in such a way that it can be understood by the firm’s employees.
2.4 Assimilation capacity
Assimilation capacity refers to the routines and processes that allow an individual to analyse, process, interpret and understand the information obtained from external sources (Kim 1997). It is the integration of new knowledge or information with what is already known. The whole essence of innovation is to transform new or existing innovations or ideas into products and services.
2.5 Transformation capacity
Transformation capacity of the innovator denotes the capability to develop and refine the routines that facilitate the combining of existing knowledge with newly acquired and assimilated knowledge (Tepic et al. 2012). This is accomplished by adding or deleting knowledge or simply by interpreting the same knowledge in a different manner. Generally, the ability to innovate is dependent on the recognition, understanding and application of new knowledge and other resources such as financial (Klerkx and Leeuwis 2009). Transformation is a complete change of a product or service into something with an improved usefulness.
2.6 Exploitation capacity
New products and ideas or services are often intended to be introduced into the market for use. Tepic et al. (2012) define exploitation capacity as an individual’s capability to translate external information directly into new business applications; application of external information to business contributes to profitability and availability of the skills to convert external information into profitability. Evidently, these capacities are interconnected but not necessarily in a linear form. Also, the processes involved in innovation are not expected to be obtained in one ‘shop’. For example, an innovator could acquire a certain piece of knowledge, the final product of interest to him or her. He or she takes that knowledge straight to the market where it serves as an innovation, but where it may also be subjected to further innovation.
2.7 Research Framework
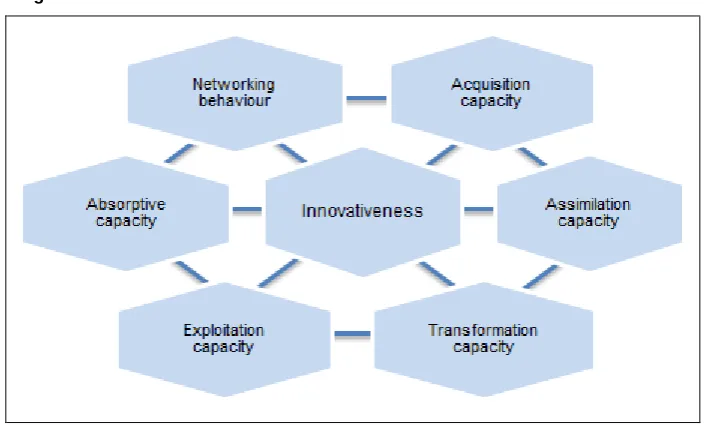
Figure 1 illustrates a framework of the relationship among innovation variables and innovativeness. The framework posits that capacities of absorption (variables of age, educational status, number of employees, membership of associations, and income level), acquisition, assimilation, transformation, exploitation and networking behaviour explain innovativeness. The framework also suggests that the variables have relationships among themselves
.
3 Methodology
The following methodologies were used in the course of the study.
3.1 Research design
employed qualitative design to help reinforce and evaluate the quantitative findings obtained over a more specific scale. The qualitative approach was guided by in-depth interviews. Interviews are suitable as they could broaden the horizon of the researcher with the possibility of revealing constructs or factors not originally envisaged by the researcher.
Figure 1 The research framework
3.2 Sampling
According to SMEDAN (2005), CAPDAN had about 3,500 registered enterprises, with about 8,000 to 10,000 employees, excluding their employers. Oyelaran-Oyeyinka’s (2014) observation that there were also about 1,500 street operators means that the number of the operators in the cluster would have increased tremendously. However, there is no up-to-date sampling frame of the stalls or of the operators. Hence, statistical sampling procedure could not be adopted. The respondents were owners of shops/stall where any of the categories of information technology products and services are rendered. Given the anticipated difficulty of identifying owners of stalls who would be willing to complete our instruments, we purposively decided on three hundred respondents, ensuring that an equal number of respondents were selected from the computer repair/servicing, installation and cloning categories of the operators.
3.3 Instrumentation
A questionnaire instrument was suitable for the quantitative data collection. The questionnaire was structured into seven sections: (a) socio-demographic characteristics, (b) networking frequency, (c) acquisition capacity, (d) assimilation capacity, (e) transformation capacity, (f) exploitation capacity, and (g) innovativeness.
Section a: Demographics
The demographic characteristics are age, educational qualification, gender, type of employment, type of business, professional membership, and union membership.
Section b: Networking frequency
The operators were asked to indicate the frequency of their contact with local suppliers, foreign suppliers, contractors, manufacturers, local and foreign customers, government institutions and knowledge institutions. The operators were also asked to indicate the extent to which they made use of the actors, and the knowledge and information they obtained from them in their work. The overall networking frequency was considered in the model by calculating the average frequency of contact with the actors. The higher the overall average score, the higher the level of interaction between the operators and a wider range of actors. The section was measured on a four-point Likert scale as follows: often=4, sometimes=3, rarely=2 and never=1.
Section c: Acquisition capacity
The measurements of absorptive capacity developed by Jansen, van den Bosch and Volberda, (2005) and further adapted by Tepic et al. (2012) were used. Data on acquisition capacity were obtained by asking questions about contact with partners for the purpose of collection of information about developments in the sector, attendance of IT-related meetings, allocation of time, and skillfulness in establishing contact with the relevant parties in the network.
Section d: Assimilation capacity
Section e: Transformation capacity
Five items, adapted from Jansen, van den Bosch and Volberda, (2005) and Tepic et al. (2012) were used to determine transformation capacity. The operators were asked to what extent they stored information for later use, how skillful they considered themselves in assessing the usability of external information, how much time they spent and how skillful they were in translating acquired information into changes and adjustments in their businesses.
Section f: Exploitation capacity
Three items adapted from Jansen, van den Bosch and Volberda, (2005) and Tepic et al. (2012) were used to measure exploitation capacity. The operators were asked about their capacity to translate external information into new and improved business applications, whether the use of the acquired information contributed to how much time they spent and how skillful they were in converting acquired information into innovativeness.
Section g: Innovativeness
To measure innovativeness, the study employed an eleven-item survey measure developed and adapted from InformationWeek 500’s analysis of the top 500 innovative firms and used in Sexton (2012). Section C to D were measured on a five-point Likert scale including strongly agree (SA=5), agree (A=4), undecided (U=3), disagree (D=2) and strongly disagree (SD=1).
3.4 The interview schedule
During a discussion with officials of CAPDAN, the researchers requested a list of operators whom they considered to be suitable candidates to inform them about the business, considering their number of years in business and scale of their businesses. CAPDAN provided a list of twenty-nine operators. These operators were asked if they would be willing to answer the questions in the schedule. The interview schedule can be found in Table 12 at the end of this article. In total, eighteen people were interviewed. The interviews were conducted in English, recorded and later transcribed.
3.5 Pretesting the instrument and validating the scale
The scales used in the questionnaire in this study were mainly adapted, but they were validated by their original developers. All the same, in order to ensure the suitability and adequacy of the adaptation in the environment of study, twenty copies of the questionnaire were administered to respondents in similar jobs in Ibadan, Nigeria. A major observation was that the size of the instrument was too large for the busy, self-employed IT workers. There was also an observation that some of the questions were somewhat technical and required explanations in order for participants with low levels of education to understand them. The final questionnaire that was administered included explanations of questions that were considered technical. The scales were validated using the approach of Cronbach’s internal consistency test. The researchers obtained a low Cronbach value of 0.68, a value close to 0.7 which is generally accepted for internal consistency of scales. They did not pre-test the interview schedules.
3.6 Administration of the research instruments
Access to the respondents was negotiated with the permission and support of CAPDAN, an umbrella body of the operators. The researchers and three assistants visited the stalls in the cluster, introduced the study to the identified stall owners and solicited their participation. Securing participation was a difficult task as the would-be respondents complained about the time it would take to complete the questionnaire or be interviewed and the distraction they would cause to them. The respondents were given the option to decide whether to participate in the questionnaire survey or not. The questionnaire was self-administered during business hours in the month of January 2015.
The in-depth interviews were conducted by posing questions to the respondents and following up responses with further questions to generate a discussion. Eighteen respondents across the three categories of product and service providers in the study were involved in the interviews. The interviews were later transcribed and themes were developed based on the research objectives.
3.7 Data preparation and analysis
4 Results
The researchers distributed 300 copies of the questionnaire; 273 were returned and satisfactorily completed, although the variables of marital status and association membership suffered one and two non-responses respectively. The return rate of 91% is very satisfactory for an unsolicited survey.
4.1 Socio-demographic characteristics
The socio-demographic characteristics of the respondents are shown in Table 1. All the respondents were male. The respondents within the age bracket of 27-32 years were the largest in number (40.3%). Respondents within the age bracket of 33-38 (29.3%) followed by those within >26 and 39-44 constituted 15% and 9.9% respectively, and those in the age bracket of above 45 constituted 5.5%. In respect of education, the largest number of respondents had a university education (40.7%); respondents with secondary education followed closely (39.6%) while those with technical education and primary education constituted 14.3% and 4.8% respectively. Only two or 0.7% reported any professional qualification. The majority of the respondents (51.3%) were married, while 48.4% were single. Almost all the respondents (98.9%) engaged in maintenance/repair services while 32.6% were rendering installation services and 12.5% reported that they cloned computers. Furthermore, 89.7% of the respondents reported that they were members of the association while only 2.2% reported belonging to any professional body. In respect of income level, the respondents earned a mean of about 19,000 Nigerian naira weekly.
Table 1 Socio-demographic characteristics of respondents
Demographic characteristics Frequency Percent
Age (N=273, mean=32.53)
≤26 years 41 15.0
27-32 110 40.3
33-38 80 29.3
39-44 27 9.9
≥45 15 5.5
Educational qualification (N=273)
Primary Education 13 4.8
Secondary Education 108 39.5
Technical Education 39 14.3
University Education 111 40.7
Professional Qualification 2 0.7
Marital status (N=272)
Single 132 48.4
Married 140 51.3
Type of business* (N=273)
Maintenance/Repair 270 98.9
Computer Cloning 34 12.5
Installation 76 32.6
Membership of :(N=271)
Union membership 245 89.7
Professional body 6 2.3
*sums do not add up to 100% due to multiple responses
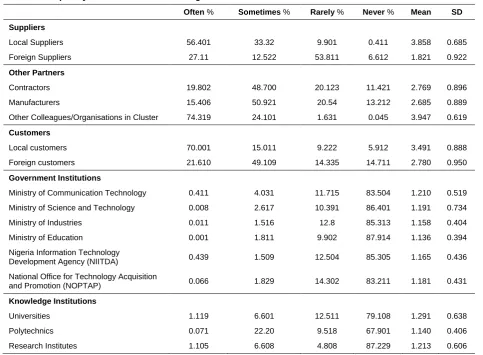
4.2 Networking frequency
Table 2 Frequency distribution of networking
Often % Sometimes % Rarely % Never % Mean SD
Suppliers
Local Suppliers 56.401 33.32 9.901 0.411 3.858 0.685
Foreign Suppliers 27.11 12.522 53.811 6.612 1.821 0.922
Other Partners
Contractors 19.802 48.700 20.123 11.421 2.769 0.896
Manufacturers 15.406 50.921 20.54 13.212 2.685 0.889
Other Colleagues/Organisations in Cluster 74.319 24.101 1.631 0.045 3.947 0.619
Customers
Local customers 70.001 15.011 9.222 5.912 3.491 0.888
Foreign customers 21.610 49.109 14.335 14.711 2.780 0.950
Government Institutions
Ministry of Communication Technology 0.411 4.031 11.715 83.504 1.210 0.519
Ministry of Science and Technology 0.008 2.617 10.391 86.401 1.191 0.734
Ministry of Industries 0.011 1.516 12.8 85.313 1.158 0.404
Ministry of Education 0.001 1.811 9.902 87.914 1.136 0.394
Nigeria Information Technology
Development Agency (NIITDA) 0.439 1.509 12.504 85.305 1.165 0.436
National Office for Technology Acquisition
and Promotion (NOPTAP) 0.066 1.829 14.302 83.211 1.181 0.431
Knowledge Institutions
Universities 1.119 6.601 12.511 79.108 1.291 0.638
Polytechnics 0.071 22.20 9.518 67.901 1.140 0.406
Research Institutes 1.105 6.608 4.808 87.229 1.213 0.606
4.3 Application of information obtained through networking
Table 3 relates to the perceived application of information obtained through networking. It shows that 59.7% and 62.3% of the respondents respectively strongly agreed that they used the information they received from other sources for the purpose of learning and doing repairs (M=4.593 and M=4.579). Less than one third (30%) of the respondents were undecided about applying the information they obtained for the purpose of computer cloning (M=2.637). For the purpose of branding of computer and modification of products, the mean scores of 3.622 and 3.696 corresponded with the 46.2% and 47.3% who use the information they obtain for these purposes. Collaboration and marketing had means of 2.771 and 2.133 respectively, corresponding with the 19.8% who were undecided in respect of collaboration, and the 27.5% who ‘disagreed’ in respect of marketing. Finally, 45.8% and 42.1% of the respondents disagreed about applying the information they obtain for regulation and environmental issues (M=1.912 and M=1.878).
Table 3 I apply the information obtained through networking
SA % A % U % D % SD % Mean S.D
Learning 59.7 27.8 0.4 6.2 5.9 4.593 1.136
Repair 62.3 35.5 0.7 0.7 0.7 4.579 0.626
Cloning 14.7 20.5 5.9 30 27.8 2.637 1.451
Branding of computer 25.3 46.2 5.5 8.8 13.2 3.622 1.315
Modification of products 23.4 47.3 13.9 3.3 11 3.696 1.193
Collaboration 5.9 31.9 19.8 17.2 24.5 2.771 1.294
Marketing 2.2 11.0 21.6 27.5 37 2.133 1.104
Regulation 0.4 10.3 15.4 27.5 45.8 1.912 1.029
Environmental Issues 0.7 7.3 13.2 35.9 42.1 1.878 0.953
4.4 Acquisition capacity
In respect of the respondents’ assessment of their acquisition capacity through identified avenues, the results in Table 4 show that 65.2% agreed that they acquired some capacity through interaction with customers (M=4.418). Further, the mean of 3.938 corresponds to 40.3% of the respondents who agreed that they acquired capacity through manufacturers. A similar result applied to acquiring capacity from discussion with contractors (28.9%) and suppliers (30.4%), with the highest mean values of 3.649 and 3.806 respectively. As would be expected of busy people in the informal sector, participating in seminars, workshops and conferences to upgrade skills and gain more knowledge had a mean score of 2.952, reflecting the 6.6% of the respondents who were ‘undecided’ about this avenue. In a similar manner, the mean score of 3.392 indicates that contacting people for useful knowledge and information about new developments in the work was an uncertain approach for capacity acquisition.
Table 4 Frequency distribution of acquisition capacity
I get information through SA % A % U % D % SD % Mean S.D
Customers 26.0 65.2 0.7 1.5 6.6 4.418 1.06
Manufacturers 39.9 40.3 0.7 10.6 8.1 3.938 1.25
Contractors 37.4 28.9 8.8 9.2 15 3.649 1.44
Suppliers 44.0 30.4 1.8 9.9 13.9 3.806 1.44
Seminars, workshops, conferences 25.6 22.7 6.6 11.4 33.7 2.952 1.65
People and institutions 29.7 31.9 9.9 5.1 23.4 3.392 1.53
Colleagues 68.8 12.36 5.23 7.41 6.2 3.68 1.89
Note: SA=Strongly Agree, A=Agree, U=Undecided, D=Disagree, SD=Strongly Disagree, S.D=Standard Deviation
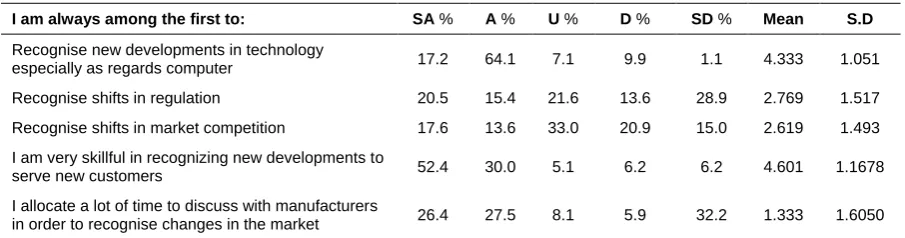
4.5 Assimilation capacity
In respect of the capacity to assimilate new knowledge, Table 5 reveals that the mean of 4.333 reflects the 64.1% of those who agreed that they were able to recognise new developments in computer technology. The disconnection between the respondents and the government is reflected in the mean value of 2.769 that represents the 21.6% of the respondents who are undecided about recognising shifts in regulation. The market dynamics appear too complex for the respondents as the mean value of 2.619 corresponds to 33% who strongly disagree (M=2.619) that they recognise shifts in market competition.
Table 5 Frequency distribution of assimilation capacity
I am always among the first to: SA % A % U % D % SD % Mean S.D
Recognise new developments in technology
especially as regards computer 17.2 64.1 7.1 9.9 1.1 4.333 1.051
Recognise shifts in regulation 20.5 15.4 21.6 13.6 28.9 2.769 1.517
Recognise shifts in market competition 17.6 13.6 33.0 20.9 15.0 2.619 1.493
I am very skillful in recognizing new developments to
serve new customers 52.4 30.0 5.1 6.2 6.2 4.601 1.1678
I allocate a lot of time to discuss with manufacturers
in order to recognise changes in the market 26.4 27.5 8.1 5.9 32.2 1.333 1.6050
Note: SA=Strongly Agree, A=Agree, U=Undecided, D=Disagree, SD=Strongly Disagree, S.D=Standard Deviation
In terms of skillfulness in recognising new developments to serve new customers, 52.4% strongly agreed with the statement (M=4.601). 32.2% disagreed that they allocated time to converse with manufacturers in order to recognise changes in the market (M=1.33).
4.6 Transformation capacity
Do the respondents have the capacity to transform the knowledge they acquire into products and services? Table 6 shows that only 28.6% of the respondents were undecided about recording and storing newly-acquired knowledge for future reference, while 30.0% strongly disagreed about doing so. About half of the respondents recognised the usefulness of new external knowledge to add to their existing knowledge about technology (M=4.645).
(M=3.033). 47.3% agreed that they had sufficient skills to translate external information to be able to understand changes in their business (M=4.369).
Table 6 Frequency distribution of transformation capacity
SA % A % U % D % SD % Mean S.D
I record and store newly acquired knowledge for
future reference 5.5 17.2 28.6 18.7 30.0 1.456 1.647
I recognise the usefulness of new external
knowledge to our existing knowledge 50.2 37.7 0.4 9.9 1.8 4.645 1.005
I discuss with my colleagues how trends in the
market could be used to improve our business 43.6 29.3 5.9 12.8 8.4 4.725 1.246
I allocate a lot of time to translation of external
information into changes to our business 18.3 12.1 32.6 8.1 28.9 3.033 2.518
I have sufficient skills to translate external
information into changes to our business 28.9 47.3 4.8 9.9 9.2 4.369 1.228
Note: SA=Strongly Agree, A=Agree, U=Undecided, D=Disagree, SD=Strongly Disagree, S.D=Standard Deviation
4.7 Exploitation capacity
What about taking advantages of the opportunities created by networking to introduce new products and ideas into their businesses? Table 7 shows that 39.6% of the respondents strongly disagreed that they translated external information directly into new business applications (M=4.590). As high as 59.6% of the respondents agreed that external information contributed to the improvement in the business (M=3.900), just as 42.2% were undecided about their skills to convert external information for improving the business (M=3.451).
Table 7 Frequency distribution of exploitation capacity
SA % A % UD % D % SD % Mean S.D
I translate external information directly into new
business applications 17.6 5.9 19.4 16.1 39.6 4.590 1.500
Application of external information contributes
to improvement in our business 24.5 59.6 12.7 8.4 3.3 3.900 1.127
I have sufficient skills to convert external
information into improvement in our business 34.4 8.8 42.2 4.8 8.4 3.451 1.182
Note: SA=Strongly Agree, A=Agree, U=Undecided, D=Disagree, SD=Strongly Disagree, S.D=Standard Deviation
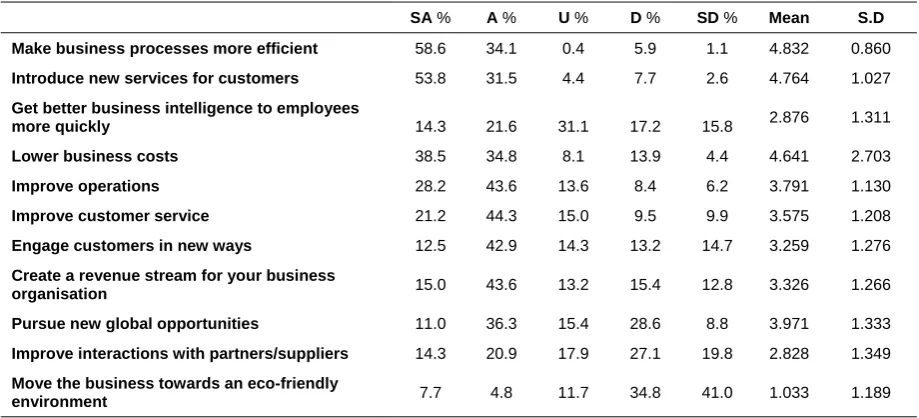
Table 8 Frequency distribution of innovativeness
SA % A % U % D % SD % Mean S.D
Make business processes more efficient 58.6 34.1 0.4 5.9 1.1 4.832 0.860
Introduce new services for customers 53.8 31.5 4.4 7.7 2.6 4.764 1.027
Get better business intelligence to employees
more quickly 14.3 21.6 31.1 17.2 15.8 2.876 1.311
Lower business costs 38.5 34.8 8.1 13.9 4.4 4.641 2.703
Improve operations 28.2 43.6 13.6 8.4 6.2 3.791 1.130
Improve customer service 21.2 44.3 15.0 9.5 9.9 3.575 1.208
Engage customers in new ways 12.5 42.9 14.3 13.2 14.7 3.259 1.276
Create a revenue stream for your business
organisation 15.0 43.6 13.2 15.4 12.8 3.326 1.266
Pursue new global opportunities 11.0 36.3 15.4 28.6 8.8 3.971 1.333
Improve interactions with partners/suppliers 14.3 20.9 17.9 27.1 19.8 2.828 1.349
Move the business towards an eco-friendly
environment 7.7 4.8 11.7 34.8 41.0 1.033 1.189
4.8 Capacity to devise means of solving IT problems
The study also investigated whether the respondents considered themselves able to devise means of solving IT problems (see Table 8). More than half of the respondents (58.6%) strongly agreed that they had the capacity to make their business processes more efficient (M=4.832). A similar result was obtained in respect of introducing new services for customers (M=4.764), and lowering business costs (M=4.641). The mean scores for improving operations (3.791) and improve customer service (3.575) show that 42.9% of the respondents agreed that they could devise means of meeting these expectations, while 14.3% were undecided about engaging customers in new ways (M=3.259).
About one third of the respondents (31.1%) were undecided about whether they were providing better business intelligence to their employees quickly (M=2.876). However, 36.3% agreed with pursuing new global opportunities (M=3.971), 14.3% strongly agreed with improving interactions with partners/suppliers, while 7.7% strongly agreed with moving the business towards an eco-friendly environment (M=1.033).
4.9 Capacity to devise means of solving IT problems: the interviews
The researchers synthesised the interview results which are here reported under key subheadings.
4.9.1 Creativity
The interviews revealed that the respondents recognised and were conscious of their ability to devise new ways of solving old and new IT problems, especially as they related to computer hardware. They valued their undertakings. They tried out new ideas and improved on existing systems. According to one respondent:
You cannot underestimate what is going on here. People come here, not only from Nigeria, but also from different parts of Africa because of the activities that go on here. If there is no big business here, people will not be talking about Otigba. This place would not have been this way. It is because we make things in different ways. People come here and we upgrade their system. We do things differently. We have very creative people here. We don’t just assemble computer parts; we try to put different parts of different brands in entirely different ways. And they work. So if it is being creative or innovative, we are capable. Innovation is not only when you come out with a new product per se, but when you devise better means in product and business processes. And that is what you get here (Male, Cloning).
Perhaps the idea of “[putting] different parts of different brands in entirely different ways” illustrates the extent of experimentation that takes place in the cluster. This response shows how enlightened some operators are with respect to the innovativeness that occurs in the cluster. It is also significant that the operators have a good knowledge of what it means to innovate; they engage in ‘trial and error’ but their aim is to “devise better means in product and business processes”.
4.9.2 Collaboration, value for information as a good, and customer satisfaction
The response below illustrates that the operators are focused and committed to achieving business success.
Information is power. If you don’t have knowledge, you are as good as dead. Through learning and collaboration with my colleagues and from the internet and even from the customers, my business grows. This is because when I meet the needs and satisfy my customers, I get more work from other customers. I upgrade laptop for people. Perhaps if my customer wants his system to be using higher RAM, I do it here (Male, Maintenance/repair).
Another response illustrates the same:
… if you don’t interact and discuss with the suppliers, manufacturers and your customers. I can say that the information you get from these categories of persons help a lot in improving my business (Male, Maintenance/repair)
Likewise, another:
Like I said earlier, you do certain things you have not done before by simply discussing with your customers or by learning about what is the latest in technology. In this way, you try your best to achieve the same thing. So, you can see that through interactions with your customers, suppliers and learning about the latest in computer, you are able to introduce new services and do new things (Male, Maintenance/repair).
4.9.3 Experimentation and innovation
We make things entirely different from how HP, Dell and others do theirs. You cannot underrate the people you see here. All we do is to see how we can use our own techniques and knowledge to solve our IT challenges and this continues to improve our work here (Male, Maintenance/repair).
The respondents reported an ability to improve in their businesses as they experienced an increase in income and sustained patronage by the customers.
Yes, by using other ways of meeting customers’ needs you are able to reduce the amount of money you would have used on that job. Through careful planning and also utilisation of alternative materials, I am able to cut costs significantly. As a customer comes out with a new product, or when I come out with one myself that will look like an exact copy of an original product, instead of using the original parts and components manufactured by the original manufacturer, I decide to use other parts or components that are cheaper but still of good quality and fitting to the specification or requirement. That way, I am able to lower business costs, and services are made more efficient. This is because sometimes you discover that when you clone systems or when you use different components, the system even performs better and can do what the original system may not be able to do (Male, Cloning).
Another respondent commented thus:
Everything in this life is step by step. And no man knows it all. It is through what I learn or the information I get that I apply to do other areas of the work that I have not been doing before. For instance, in trying to use a hard disk which has a particular capacity for another component or if I try to use a different motherboard for another brand, it is new service and it is because I am trying to meet the need of a particular customer. Also, sometimes we do trial and error. You try to fit certain components and parts together and see the result. Through all these, you are able to do new things and introduce services that you are not used to before (Male, Maintenance/repair).
Another response from a participant was:
We introduce new products through our cloned systems. When the user or the producer defines the requirement for a particular system, we go ahead to design based on the specifications. There is trial and error in this business. You see us trying out different components and sometimes we come out with good systems, sometimes they just don’t work. So I would say we build new products here (Male, Cloning).
The previous responses could indicate unprofessional approaches to solving problems; but these approaches are spurred by the unavailability of spare parts or even complete parts of computer models the operators wish to build. The claim of trying out combinations of parts from different equipment that perform better than the original parts may require laboratory tests to validate. The fact, however, is that branded spare parts may sometimes be the only differentiation between a certain part obtained from a branded product and that of another. The ability to identify the parts that are complimentary and cheaper, and confidently use them for a service, is a demonstration of skill.
4.9.4 Challenges lead to innovation and experimentation
A respondent commented thus about challenges around innovation and experimentation:
In fact, one of the problems we are battling in this computer village is the issue of space for more business outlets. I have been able to open another computer repair and sales center at Adeniyi Jones Street here in Lagos. Ordinarily, I would have loved to open the shop here (Otigba) but, as you can see, there are no spaces. So, what I am saying, in essence, is that we have been able to expand the business because, when people see the work you do and it is beneficial and even more economical to them compared with the prices of western products, your business will grow because they will advertise your business. On customer services, we try as much as possible to expand customer services; that is why, in my business, we repair computers, we maintain computers, we clone and we also install. In fact, by the grace of God, we will be venturing into software applications development, but that one requires much technicalities and also deep knowledge (Male, Maintenance/repair).
Another respondent said:
software to help the various hardware to work. We test the systems and if they work, it is good for business. So I can say we introduce new products here and that is why people come in here every day for one system or the other (Male, Cloning).
4.9.5 Increased income
About increased income, one respondent said:
My level of income increases significantly. Apart from the fact that you need money to pay your workers, buy parts and other components and also run the business generally, I can say I make a living here. You may not know the amount of money that flows in this computer village daily. That is why you have banks all around here. The money we make may be divided to take care of other things, but I can really say that my income increases and this is made possible by the new things I learn and the customers (Male, Installation).
Another respondent stated:
My income increases when you meet the needs of the customer. Especially when you are able to do what a particular customer wants, you get your money and even more because you have been able to satisfy him or her. Now, when you upgrade a system for instance or when you use a particular hard disc on another one thereby cutting costs, you get paid because you have been able to save the customer more money he would have used to buy the main system. Definitely, there is an increase in income when you come out with new services or modify a system. Income increases (Male, Cloning).
The respondents are able to achieve innovation through increase in their income when their products and services meet the needs of the people.
4.10 Further statistical analysis
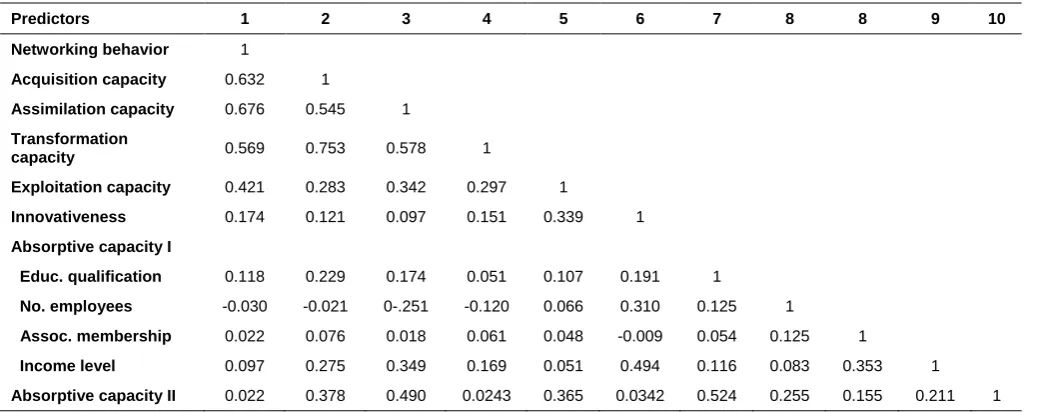
A correlation matrix was used to investigate the independence of the variables in respect of predicting the innovativeness of the respondents. Table 9 reveals that many of the innovation predictor variables in this study are highly binary-correlated (high correlation was set as r>0.6). However, assimilation capacity has low correlation with acquisition capacity (r=0.545), while transformation capacity and innovativeness have low correlation with all the other predictors.
Table 9 Zero order binary correlations of the innovation variables
Predictors 1 2 3 4 5 6 7 8 8 9 10
Networking behavior 1
Acquisition capacity 0.632 1
Assimilation capacity 0.676 0.545 1
Transformation
capacity 0.569 0.753 0.578 1
Exploitation capacity 0.421 0.283 0.342 0.297 1
Innovativeness 0.174 0.121 0.097 0.151 0.339 1
Absorptive capacity I
Educ. qualification 0.118 0.229 0.174 0.051 0.107 0.191 1
No. employees -0.030 -0.021 0-.251 -0.120 0.066 0.310 0.125 1
Assoc. membership 0.022 0.076 0.018 0.061 0.048 -0.009 0.054 0.125 1
Income level 0.097 0.275 0.349 0.169 0.051 0.494 0.116 0.083 0.353 1
Absorptive capacity II 0.022 0.378 0.490 0.0243 0.365 0.0342 0.524 0.255 0.155 0.211 1
Absorptive capacity I was measured with educational qualification, number of employees, association membership and income level, while Absorptive capacity II was measured with prior knowledge of the field and presence of gatekeepers. Table 9 shows that all the absorptive capacity variables are good for predicting innovativeness because the correlations are less than 0.6. Notice that sex was not included in this correlation diagnosis because the business was dominated by males (98.6%). We included marital status in the descriptive (Table 1) to glean an idea about marriage among the respondents, but there is no evidence in the literature that this variable could relate to innovativeness, and was therefore not included in this diagnosis and further analysis. What follows is a principal component analysis of the predictors undertaken to reduce their dimensionality.
collected from suppliers and personal ability and action in identifying other relevant sources of information are the major components of acquisition capacity of the innovators.
Table 10 Principal components of networking behavior, acquisition, assimilation, transformation and exploitation capacities
Variables Components Initial Eigen values Tests
Total % of var Cum %.
Acquisition capacity
I get information from suppliers 3.577 51.098 51.098 KMO=0.773,
Bartlet test: X2=817.193, Df=21, p=0.000
I allocate a lot of time to contact
relevant people and institutions 1.184 16.920 68.018
Assimilation capacity
I am very skillful 2.169 43.381 43.381 KMO=0.525,
Bartlet test: X2=400.946, Df=10, p=0.000
I am among the first to recognise shift
in market 1.402 28.047 71.428
Transformation capacity
I recognise the usefulness of new external knowledge to our existing knowledge
2.282 45.648 45.648
KMO=0.690,
Bartlet test: X2=285.432, Df=10, p=0.000
Exploitation capacity
I have sufficient skills to convert external information to improve my business
1.559 51.970 51.970 KMO=0.498,
Bartlet test:X2= 100.075, Df= 3, p= 0.000 I translate external information directly
into new business applications 1.001 33.364 85.334
Networking behavior
I liaise with polytechnics 4.605 28.780 28.780 KMO=0.719,
Bartlet test:X2=2387.043 Df=10, p=0.000 I liaise with foreign suppliers 3.738 23.364 52.144
Absorptive capacity I
Learnt lessons from branding 3.437 38.190 38.190
KMO=0.637,
Bartlet test: X2=1264.572, Df= 36, p=0.000 Learnt lessons from other
sources/activities 1.855 20.616 58.807
Learnt lessons from cloning 1.094 12.153 70.960
The results in Table 10 also suggest that personal skill and capability of the innovator and the innovator’s ability to recognise shifts in the market constitute the major components that determine the innovators’ assimilation capacity, whereas recognising the usefulness of new external knowledge is sufficient to transform the knowledge acquired into practice. In order to take the innovation to the market, the innovators require skills to convert external information and translate it directly into new business applications. The innovators network with two major types of institutions, namely polytechnics and foreign suppliers. The innovators’ capacity to recognise and obtain external knowledge was formed mainly through branding, cloning and liaising with other sources of information.
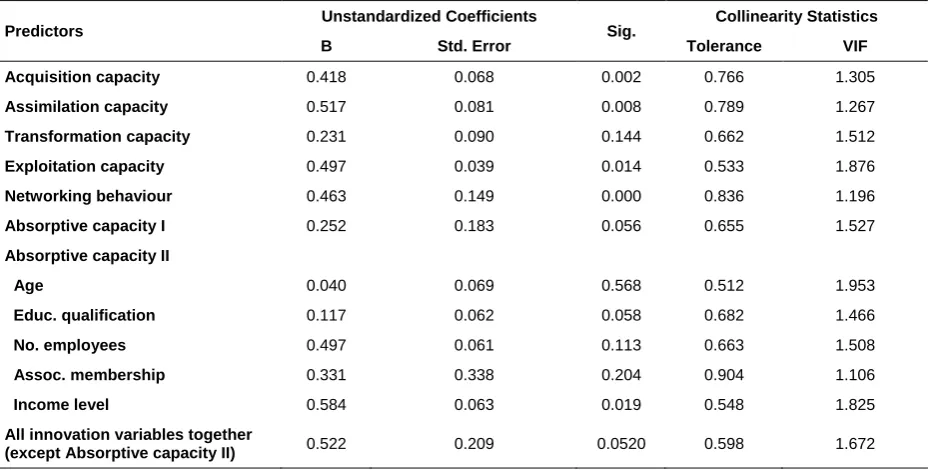
A linear regression method was adopted to test how the innovation capacities related to innovativeness (see Table 11).
Table 11 Linear regression result of the innovation predictors on innovativeness
Predictors Unstandardized Coefficients Sig. Collinearity Statistics
B Std. Error Tolerance VIF
Acquisition capacity 0.418 0.068 0.002 0.766 1.305
Assimilation capacity 0.517 0.081 0.008 0.789 1.267
Transformation capacity 0.231 0.090 0.144 0.662 1.512
Exploitation capacity 0.497 0.039 0.014 0.533 1.876
Networking behaviour 0.463 0.149 0.000 0.836 1.196
Absorptive capacity I 0.252 0.183 0.056 0.655 1.527
Absorptive capacity II
Age 0.040 0.069 0.568 0.512 1.953
Educ. qualification 0.117 0.062 0.058 0.682 1.466
No. employees 0.497 0.061 0.113 0.663 1.508
Assoc. membership 0.331 0.338 0.204 0.904 1.106
Income level 0.584 0.063 0.019 0.548 1.825
All innovation variables together
All the variables predicted innovativeness (p≤0.05), except age, number of employees, membership of associations and transformation capacity (p≥0.05). Also, except for absorptive capacity I (B=0.252), educational qualification (B=0.117) and acquisition capacity (B=0.418), whose prediction magnitudes were considerably low, the magnitude of the other predictors was in the median range (B≥0.5). When all the predictors were considered together, they narrowly predicted innovativeness (p=0.0520). Altogether, the innovativeness of the products and services providers in Otigba may not be explained sufficiently by the use of the innovation capacities – there are variables located elsewhere which may provide a more detailed explanation.
5 Discussion of the findings
This study investigated how identified innovation variables explain the innovativeness of information technology products and service providers in the Otigba Computer Hardware Cluster in Lagos, Nigeria. Over 55% of respondents were younger than 32 years of age. Evidently, the computer village cluster is predominantly made up of relatively young people, a statistic that reflects the current knowledge about the youthful population of Nigeria (Pouris 2006). The advantage of this age structure among operators in the cluster is that they have a longer time in which to learn, experiment and deploy their energies to innovate in the sector. The near-equal proportions of operators with university education (40.7%) and secondary education (39.6%) also suggest that the cluster could provide a good educational ground where those who have higher education could influence those who do not have it.
The large number of university graduates in the cluster could support the opinions of Oyelaran-Oyeyinka (2014): that unemployment is a major explanation for the popularity of the informal IT sector. A large proportion of the respondents doing maintenance and repair (98.9%) signifies a large number of learners, as repair and maintenance are the path to higher-level activities in the cluster, such as cloning and branding. Despite the relative youthfulness of the population, a high number of respondents reported that they are married. This may suggest that the operators believe in the ability to support families through their business. This surmise is supported by the interviews by Ibeku and Nwagwu (2015) in which some of the respondents reported that they are able to support their families satisfactorily based on their businesses. Membership of the association (CAPDAN) is a compulsory requirement for operators; this explains the high number of respondents who reported being members of the association. This requirement could be a positive development as it could make organisation and coordination of activities in the cluster much easier. Regarding their income, a mean weekly income of 19,000 Nigerian naira means that the income of the operators in this cluster per week is higher than the national minimum wage of 18,000 naira.
Local suppliers are the key networking partners of the operators; foreign suppliers have declined in recent years, the aftermath of the onset of poor economic and social conditions in the country. This finding tallies with common knowledge about the spate of imports of IT equipment in the cluster and in other parts of the country. Most importers bring their goods to the cluster for sale. To what extent does the networking with local suppliers positively influence innovativeness in the cluster? Engaging in this discourse is important to make innovation one of the major objectives to encourage and sustain the cluster. Most importers in Nigeria are not necessarily people who have adequate knowledge of the products and services which they import. Rather, they are business people who engage in their import businesses according to what they consider or are told to be fashionable or what the buyers of their goods require. A significant crop of networking partners linked to the IT products and service providers in the cluster are their colleagues, likely due to factors of proximity and knowledge the individuals have acquired in their areas of skill. A large number of respondents reported networking with manufacturers (50.921%); this high number might be explained by the purchase of goods from local suppliers being followed up with engagement with the manufacturers.
There is a real gap between the operators and the government in respect of networking. Oyelaran-Oyeyinka (2007) suggested that the location of government agencies in Lagos could be a major reason for the emergence and growth of the cluster, a fact that is not manifested by the interaction between members of the cluster and government agencies. Generally though, government agencies meet their IT needs through local contractors who deal with the operators in the cluster. There is also a distance between the operators and knowledge institutions, but the 22% of the operators who reported networking with polytechnics is informative. Polytechnics are established in order to produce technical skills and this nature of educational activities could explain their interaction with the technology cluster under study.
What does the regression result tell us about factors that could explain innovativeness among the innovators? First, innovativeness among the operators in the cluster is not necessarily a function of the traditional innovation variables of absorptive, acquisition, transformation and exploitation capacities, among others. While these make some contribution to the innovativeness, there are other variables located outside this core which account for innovativeness. The study confirms the findings of Tepic et al. (2012): that a higher absorptive capacity, which provides relevant information about changes and innovations, impacts positively on the capacity of the operators to innovate. The capacity to transform knowledge into applications has a significant effect on the capacity of the operators to introduce new ideas, processes and techniques. Findings from the interviews revealed that the information technology products and service providers are able to devise new ways of solving old and new IT problems, especially as they relate to computer hardware. These findings are consistent with the study of Awoleye (2013) which posits that innovation is achieved by meeting the challenges in IT in which better, more efficient and skillful approaches are employed in business processes.
The IT products and service providers are able to introduce new services to the customers; this is evident in their ability to ‘upgrade’ computer systems where they are able to modify products with certain system characteristics and through cloned products. This finding corroborates those of Oyelaran-Oyeyinka (2007) who notes that the Otigba Computer Hardware Cluster exhibits high technical capacity, especially in cloning and upgrade of computers. Typical of the computer cloning business is the introduction of new products. However, the cloning business is no longer fashionable: most of the respondents admitted that the area is no longer as lucrative as it used to be; customers now prefer branded systems. This finding contradicts the findings of Oyelaran-Oyeyinka (2007) who found out that there is high patronage of cloned systems owing mainly to their low cost. The recent finding could be because of the long-lasting nature of the branded systems and their capabilities.
6 Conclusions and Recommendations
This study was designed to examine how the common innovation constructs predict the innovativeness of information technology product and service providers in the Otigba Computer Hardware Cluster in Lagos, Nigeria. Results show that the commonly-deployed innovation variables, namely acquisition capacity, assimilation capacity, transformation capacity, exploitation capacity, networking behaviour and absorptive capacity are crucial in understanding the innovative capacity of innovators. They confirm the importance of stronger networking behaviour for the transfer of knowledge by showing that the respondents’ relationship with knowledge sources has a strong relationship with their capacity to innovate, acquire, understand and use knowledge. However, a principal component analysis extraction of these constructs shows that many of their dimensions contribute nothing to the internal capacity of the constructs to predict the innovativeness of operators. Furthermore, despite the adequacy of their collinearity statistics, the extracted dimensions did not provide sufficient explanation of the innovativeness of these innovators. There is a need for studies designed to redefine the dimensions of the constructs to suit the local environment. It is also appropriate to recommend that further explanations for the innovativeness of the innovators in Otigba in Nigeria be focused on local realities and circumstances. It is only in this way that we can practically demonstrate tendencies and capacities in the social system that enable people to engage in and support new ideas, experimentation and creative processes that may result in new products, services or technological processes. The difficulty of random sampling in this study must be recognised as a limitation of the study.
Table 12 The interview schedule
1. …..describe the type of persons or organisations/institutions you get information from that you use in your work
2. Would you say that the knowledge you get or the things you learn from persons and organisations outside the cluster are useful to your work, if yes how exactly?
3. In what ways do the information or things you learn from these persons or organisations improve your business
4. Can you explain how the information or things you learn from these persons or organisations make you introduce new services?
5. Can you describe the extent you have been able to increase your income through the information or things you learn from persons or organisations?
6. Can you describe the extent you have been able to lower your business costs and make services more efficient?
7. Describe to what extent you have been able to improve customer services and expand your business?
References
van Aalst, H.F. 2003. Networking in society, organisations and education. In Networks of innovation: towards new models for managing schools and systems. OECD, Ed. Paris: OECD. 33-40.
Abiola, B. 2006. Knowledge, technology and growth: the case study of Otigba Computer Village Cluster in Nigeria. Knowledge for Development Program, World Bank Institute, World Bank (Unpublished).
Arjona A.L. 2013. Inter-firm knowledge transfer and experiential learning: a business sustainability approach on SMEs absorptive capacity. PhD thesis. Tecnológico de Monterrey.
Bamiro, O.A. 2003. Otigba Cluster: Nigeria’s Silicon Valley? A study carried out for INTECH. Maastricht: UNU-INTECH.
Baptista, R. and Swann, P. 1998. Do firms in clusters innovate more? Research Policy, 27: 525-540.
Clausen, T.H. 2013. External knowledge sourcing from innovation cooperation and the role of absorptive capacity: empirical evidence from Norway and Sweden. Technology Analysis & Strategic Management, 25(1): 57-70. Cohen, W. and Levinthal, D. 1990. Absorptive capacity: a new perspective on learning and innovation. Administrative
Science Quarterly, 35: 128-152. [Online]. http://www.sagepub.journals/asq/vol35.html (26 August 2014).
Gradwell, T. 2003. Outsourcing-outsourcing knowledge creation: Don't give the game away – Dr Tony Gradwell, trade sector consultant at HM Customs & Excise, looks at how and why firms might outsource knowledge creation. Speciality Chemicals, 23(8): 24-26.
Hansen, M.T. 1999. The search-transfer problem: the role of weak ties in sharing knowledge across organization subunits. Administrative Science Quarterly, 44(1): 82-111.
Ibeku, S. and Nwagwu, W. 2015. Influence of absorptive capacity on innovativeness of Information Technology products and service providers in Lagos, Nigeria. Paper presented at the 2nd International Africalics Conference. 17-19 November 2015. University of Rwanda, Kigali.
Indarti N. 2010. The effect of knowledge stickiness and interaction on absorptive capacity: evidence from furniture and software small-and medium-sized enterprises in Indonesia. PhD thesis. University of Groningen.
Jansen, J., van den Bosch, F. and Volberda, H. 2005. Managing potential and realized absorptive capacity: how do organizational antecedents matter? The Academy of Management Journal, 48(6): 999-1015.
Kim, L. 1997. The dynamics of Samsung’s technological learning in semiconductors. California Management Review, 39(3): 86-101.
Kim, L. 1998. Crisis construction and organizational learning: capability building in catching-up at Hyundai Motor. Organization Science, 9(4): 506-521.
Klerkx, L. and Leeuwis, C. 2009. The emergence and embedding of innovation brokers at different innovation system levels: insights from the Dutch agricultural sector. Technological Forecasting and Social Change, 76(6): 849‐860. Krackhardt, D. 1992. The strength of strong ties. In Networks and organizations: structure, form and action. N. Nohria and
R. G. Eccles, Eds. Boston: Harvard Business School Press.
Lee, C-Y. and Sung, T. 2005. Schumpeter’s legacy: a new perspective on the relationship between firm size and R&D. Research Policy, 34(6): 914-931.
Maranville, S. 1992. Entrepreneurship in the business curriculum. Journal of Education for Business, 68(1): 27-31. Nwagwu, W.E. and Idowu, A. 2015. Demographic and Maslow’s Motivation Predictors of Job Satisfaction of Information
Technology artisans in Nigeria. Proceedings of iConference 2015. 24-27 March 2015. California: University of California. [Online]. http://hdl.handle.net/2142/73647.
Nooteboom, B., Van Haverbeke, W., Duysters, G., Gilsing, V. and Van den Oord, A. 2007. Optimal cognitive distance and absorptive capacity. Research Policy, 36(7): 1016-1034.
Oyelaran-Oyeyinka, B. 2007. Learning in hi-tech and knowledge in local systems: the Otigba Computer Hardware Cluster in Nigeria. Working Paper 2006-2007. Institute for New Technologies. Maastricht: United Nations University.
Oyelaran-Oyeyinka, B. 2014. Industrialization pathways to human development: industrial clusters, institutions and multidimensional poverty in Nigeria. In Harnessing Africa’s growth for faster poverty reduction: proceedings of the First Annual Bank Conference on Africa. 23-24 June 2014. The Paris School of Economics and World Bank. 1-36. Porter, M. 1998. Clusters and competition: new agendas for companies, governments, and institutions. Cambridge, MA:
Harvard Business School Press.
Pouris, A. 2016. Research and innovation funding instruments to raise South Africa’s competitiveness in science and technology: lessons from other developing countries. Paper presented at the National Research and Innovation Dialogue. 7 -8 April 2016. Emperors Palace, South Africa.
Reagans, R. and McEvily, B. 2003. Network structure and knowledge transfer: the effects of cohesion and range. Administrative Science Quarterly, 48(2): 240-267.
Rhee, J., Park, T. and Lee, D.H. 2010. Drivers of innovativeness and performance for innovative SMEs in South Korea: mediation of learning orientation. Technovation, 30: 65-75.
Sexton J.C. 2012. The creation of new knowledge through the transfer of existing knowledge: examining the conundrum of creation and control in innovation. PhD thesis. Florida State University.
Small and Medium Enterprises Development Agency of Nigeria (SMEDAN). 2005. Small and medium enterprises
Tepic, M., Trienekens, J.H, Hoste, R. and Omta, S.W. 2012. The influence of networking and absorptive capacity on the innovativeness of farmers in the Dutch pork sector. International Food and Agribusiness Management Review, 15(3): 1-34.
Tushman, M.P. and Anderson, P. 2004. Managing strategic innovation and change: a collection of readings. Oxford: Oxford University Press.
van den Bosch, F., Volberda, H. and de Boer, M. 1999. Coevolution of firm absorptive capacity and knowledge environment: organizational forms and combinative capabilities. Organization Science, 10: 551-568.
West, J. 2001. The mystery of innovation: aligning the triangle of technology, institutions and organization. Australian Journal of Management, 26 (Special Issue, August): 21-44.