Solubility Study in Ag-Cu Binary System Prepared By
Ball Milling Process
S. M. M. Shafiei
*, E. Salahi, S. A. Tayebi Fard
Materials and Energy Research Center (MERC)
(*) Corresponding author:
[email protected]
(Received:18 Mar. 2012 and Accepted: 23 June 2012)
Abstract:
Solid solutions of Ag-Cu were prepared via ball milling process, for about 5-30 h. The 20at%Ag and Cu-3.64at%Ag composition were investigated by X-ray diffraction technique. It was realized that the solid solubility level could be increased by increasing the initial solute content in the mixture. In addition, shifts in peak positions of silver and copper were observed with milling time. The dissolution volume was estimated by thermodynamic relations and was compared with the measured values using X-ray diffraction technique and it was observed that
the measured and calculated volumes agreed well. The final dissolution volume of 39.155 litters was calculated by thermodynamic relationship.
Keywords: copper, silver, solid solution, mechanical alloying.
Int. J. Nanosci. Nanotechnol., Vol. 8, No. 2, June 2012, pp. 105-110
1. INTRODUCTION
Mechanical alloying process has become a widely used technique to form powder materials and to synthesize a large range of none-equilibrium phases, from amorphous materials to nano-crystalline phases, to extended solid solutions [1-3]. Solid solubility extensions have been achieved in many alloy systems by non-equilibrium processing methods such as RSP and vapor deposition. Similarly, mechanically alloyed powders also exhibit extension of equilibrium solid solubility limits. In addition to synthesizing stable (equilibrium) solid solutions, it has also been possible to synthesize metastable (non-equilibrium) supersaturated solid solutions by mechanical alloying starting from blended elemental powders in several binary and higher order systems [4-10]. Metastable alloys are of great interest due to their novel structure, properties, and applications compared to their equilibrium counter parts. In the present study, the effect of combination on solid solution formation in
Ag-Cu system via mechanical alloying process was investigated.
2- EXPERIMENTAL PROCEDURE
0.9
cos
2 sin
b
d
λ
q
=
+
η
q
(1)Where
η
is strain in lattice, λ is wave length, θ is Bragg angle, b is full-width at half-maximum (FWHM) of the Bragg peaks and d3- RESULT AND DISCUSSION
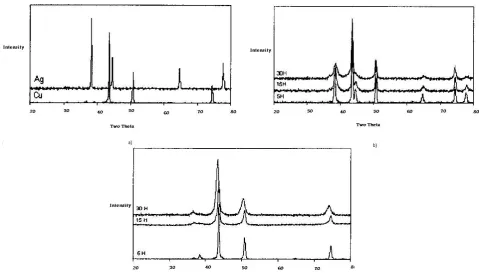
Increasing the milling time of pure silver and copper powders gave rise to the broadening of the X-ray diffraction peaks and reducing the intensity of certain peak such as the one at (111). These were
Figure 1: X-ray diffraction pattern of (a): as received Ag and Cu powders
(b): Cu-20 at.%Ag (c): Cu-3.64at.% Ag at different milling times 5, 15 and 30 h
diffraction domains and the accumulation of lattice defects. However, the peak positions of silver and copper hardly changed with milling time. When aforementioned mechanical mixtures were milled, local mutual dissolution processes formed a new face-centered cubic (fcc) phase with its (111) peak positioned between the (111) reflections of Ag and Cu, as shown in Figure 1. A shift in the diffraction peaks of Cu towards lower angles was the result of an increase in lattice constant which consequently referred to the dissolution of Ag into Cu. In contrast a shift in the diffraction peak of Ag towards upper angles suggested a decrease in lattice constant due to dissolution of Cu into Ag owing to smaller atomic radius of Cu. It is worth noting that the atomic radii of Cu and Ag are 0.128 nm and 0.144 nm, respectively. The average grain sizes of Ag phase in both mixtures were estimated by the peak broadening of X-ray diffraction peaks and the Williamson Hall method as shown in Figure 2.
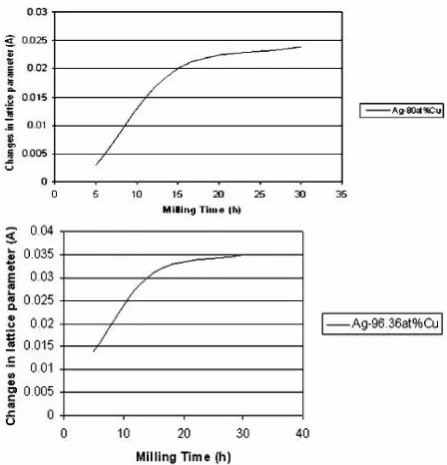
Figure 3: Lattice parameter changes of Cu vs. milling times
Figure 3 depicts the changes in the lattice parameter of Cu as a function of milling time for both mixtures.
Figure 4: Dissolution volume percent accompanying
the formation of Cu-20%atAg solid solution
4- THERMODYNAMICAL INVESTIGATION
Gibbs free energy of a solution may be written as follow [11]:
(
ln
ln )
M
A A B B
G
RT X
a
X
a
∆
=
+
(eq.1)Where
∆
G
Mis the change in the molar Gibbs free energy by the solution,x
Aandx
Bare the molefraction of A and B in the solution, R and T are universal gas constant and temperature, respectively and the
a
denotes activity. Also:.
A A A
a
=
X
γ
(eq.2)Where
γ
is the activity coefficient. For the component i:ln
Mi i
G
RT a
∆
=
(eq.3)The quantity is designated as M i
G
∆
, the partial molar Gibbs free energy of the solution of i. The general thermodynamic relationship for the state properties of a system is applicable to the partial molar properties of components of a system. Thus, for the component i present in a solution:, i i T Comp
G
V
P
∂
=
∂
0
0 ,
i
i T Comp
G
V
P
∂
=
∂
(eq.5)The partial molar volume change accompanying the formation of a solution
(
M)
i
V
∆
is defined as:,
M
M i
i T comp
G
V
P
∂∆
= ∆
∂
(eq.6) Whenx
iis not a function of pressure, then:,
ln
Mi i
T comp
V
p
RT
γ
∂
∆
=
∂
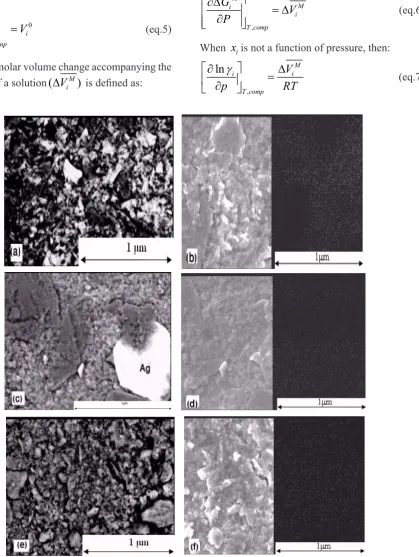
(eq.7)Figure 5: Scanning electron microscopy (SEM) and Cu dot maps of Cu-20 at.%Ag powder milled for
In the present study, the dissolution volume calculated from the thermodynamic relations was in a good agreement with the one measured using the X-ray diffraction. In this way, shift peak shows change of lattice parameter and volume due to diffusion. In the other hand, the final dissolution volume was calculated using equation 7. For calculating the temperature value, equation 8 was used. The final dissolution volume was measured to be 39.155 litters using equation 7. A complete dissolution was achieved after 30h of milling, as shown in Figure 4.
(1
bal)
chimD
T T
D
′ =
+
(eq.8)(T′=573K, P=1.2atm),
T
′
is effective temperature for alloying, which is equivalent to a rise in the temperature of the system to (> T= ambient temperature). Furthermore, it was proposed thatT
′
is related to T through the following relationship. Where,D
balandD
chim are the ballistic and chemical inter diffusion coefficients, respectively. It may be pointed out thatD
chim is exponentially related with temperature, whileD
bal is consideredto be temperature independent [13].
Figure 5 shows SEM images and the Cu dot maps of Cu-20 at. %Ag powder after milling for different durations.
5- CONCLUSIONS
Mechanical alloying process was performed in the Ag-Cu system. It was shown that the solid solubility level rose by increasing the initial solute content in a powder mixture. The shifts in the position of peaks in the X-ray diffraction patterns were utilized to determined changes in the lattice parameter values and calculated the solid solubility levels. The final dissolution volume calculated by thermodynamic relationships was 39.155 litters.
This calculated volume was in a good agreement with the one measured by the X-ray diffraction method. The results suggested that XRD patterns could be a reliable method in quantifying the phase transformation thermodynamics of solid phases subjected to mechanical alloying.
REFERENCES
1. Koch, C. C., Materials science and technology, Vol. 15, (1991), p. 19.
2. Ma, E., Atzmon, M., Mater. Chem. Phys, Vol. 39, (1995), p. 249.
3. Shingu, P. H., Ishihara, K. N., Mater. Trans. Jap Inst. Metals, Vol. 36, (1995), p. 96.
4. Suryanarayana, C., Prog Mater Sci., Vol. 46, (2001), p. 1.
5. Huang, J. Y., Jiang, J. Z., Yasuda, H., Mori, H., Phys Rev B, Vol. 58. (1998), p. 4711.
6. Duwez, P., Willens, R. H., Klement, W., Jr. J. Appl. Phys, Vol. 31, (1960), p. 1136.
7. Benjamin, J. S., Metall. Trans, Vol. 1, (1970), p. 2943.
8. Zghal, S., Twesten, R. Wu, F., Bellon, P., Acta Mater, Vol 50, (2002), p. 4711.
9. Najafabadi, R., Srolovitz, D. J., Ma, E., Atzmon, M., J. Appl. Phys, Vol. 74, (1993), p. 3144.
10. Johnson, W. L., Prog. Mater. Sci, Vol. 30, (1986), p. 81.
11. Gaskell, D. R., Introduction to Thermodynamics of Materials. 2nd ed. 1981.
12. Cullity, B. D., Stoock, S. R., Elements of X-ray Diffraction. 3rd ed. 2001.