Abstract
MEASuREMENT EquIvALENCE/INvARIANCE
A Requirement to Conducting Cross-Groups Comparisons
The establishment of Measurement Equivalence/Invariance (ME/I) is a logical prerequisite to conducting substantive cross-groups comparisons, for example tests of group mean differences, invariance of structural parameter estimates. In agreement with this argument, this paper aims to (1) demonstrate the stages to establish ME/I test, (2) provide an example of ME/I application on customer satisfaction survey across three groups of consumer, (3) demonstrate the steps should be carried out if the measurement were not perceived equivalently by respondents. Conclusions and future research directions are presented.
Keywords: measurement equivalence/invariance, customer satisfaction.
Wahyunigsih
Tadulako University, Palu – Sulawesi Selatan ayu_wningsih@yahoo.com
Johnny Tanamal
A
cademics and practitioners have been using difference tests(e.g. ANOVA, T-Test, Chi-Square,
Discriminate Analysis) to conducting
cross-groups comparisons. Frequently, the results
suggest that there is significant difference
between group ‘A’ and ‘B’ in doing something,
for example in choosing a bank, in expressing
their levels of satisfaction, etc. These results
might not valid if the measures used in the
questionnaires were perceived differently (not
equivalent) by the two groups. If the measures
were perceived not equivalent, of course,
the result of comparing the two groups will
be significantly different. To provide valid
results, measurement equivalence/invariance
test need to be established. As suggested
by Vandenberg and Lance (2000), the
establishment of Measurement Equivalence/
Invariance (ME/I) across groups is a logical
prerequisite to conducting substantive
cross-groups comparisons, for example
tests of group mean differences, invariance
of structural parameter estimates. Hence,
the test of difference is established in the
measurement level of a construct.
The decision to use ME/I is in agreement with
Hayduk (1987) who suggest stacked models
for multiple groups. He points out that the
grouping may reflect different data sources
(different cities, countries, or organizations),
different time periods, different experimental
conditions, or groupings created from the
variables available within a data set, such as
grouping on sex, religion, or age (Hayduk,
1987, p. 277). The group analysis in structural
equation modeling is also suggested by
Bollen (1989, p. 355) who recommends group
comparison when there are situations where
researchers want to know if a measurement
or latent variable model for one group
has the same parameter values as that in
another group. Hence, a group comparison
is examined in the measurement level. Based
on this result, difference test (e.g. ANOVA,
T-test, Chi-Square) can be justified as a valid
tool used to compare two or more groups.
Stages to Establish Measurement
Equivalence/Invariance
To establish a Measurement/Equivalence
Invariance (ME/I) test, the following stages
need to be followed (see Figure 1). This can
be done using structural equation modeling
in multi-groups analysis facility.
Stage 1. Perform baseline model in which all
of the coefficients are not to be constrained.
This means that values in all model matrices
are freely estimated for each group. This
freely estimated, baseline model then
serves as a benchmark against which the
fit of a more restricted model is compared
(Mavondo and Farrell, 2000).
Stage 2. Perform configure invariance, which
requires the same pattern of fixed and free
loadings in the factor loading matrix holds
for each group. Failure to support a configure
invariance suggest that the groups are using
different frames of reference i.e. different
constructs are being mapped across the
groups and no further group comparison are
warranted (Mavondo et al. 2003, p. 527).
Stage 3. Perform weak factorial invariance,
which only requires invariance constraints
on the relationship between indicators and
the corresponding latent variable. In other
words, the factor loadings on each indicator
need to be constrained.
Stage 4. Perform strong factorial invariance,
which involves additional constraints on the
error variance. This reflects the hypothesis
that the entire linear model representing the
relationship of the latent variables to a given
set of measured variables, both the raw-score
regression weights and the intercept terms,
is invariant across groups (Widaman and
Riese, 1997).
Stage 5. Perform strict factorial invariance,
which builds on strong factorial invariance by
invoking still further across-group constraints
on parameter estimates. In this stage, the
covariance between latent variables needs to
be constrained. This is a test of the hypothesis
that the correlations among the latent
variables are invariant across group.
Stage 6. Perform elegant factorial invariance,
which requires the means of the latent
variable to be constrained. This test indicates
the across-groups invariance on the latent
variable. The above stages are illustrated in
Figure 1.
Measuring Customer Satisfaction
Along with the increased research into
customer satisfaction, there has been an
increase in the diversity of measurement
scales used in customer satisfaction surveys
(e.g. Bodet, 2008; Luo and Homburg, 2007).
Although numerous measurement scales
have been proposed, these scales can
be grouped into three broad categories:
performance scales, for example poor,
fair, good and excellent; disconfirmation
better than expected; satisfaction scales, for
example very dissatisfied to very satisfied
(Bodet, 2008).
Following the measurement scales is the type
of scale used in customer satisfaction surveys.
From several studies in this field, there are
two types of scale: single-item scales (e.g.
Oliver, 1977; Westbrook, 1980) and multi-item
scales (e.g. Anderson, Pearo, and Widener,
2008; Athanassopoulos, 2000; Bodet, 2008;
Chan et al., 2003; Danaher and Mattsson,
1994). There have been some critics of the
single-item scales. Yi (1990) claims that single
item scales cannot assess or average out the
variance due to random errors, specific items,
and method factors. As a result, the reliability
of single item scales is difficult to assess
and, even when assessed in some studies
using the only available test-retest reliability
estimate, most estimates of this kind are low
to moderate and indicate that the scales
should be used with caution (Yi, 1990). In
single item scales, customers are solely asked
about the overall evaluation of their service
toward the products and services (Danaher
and Haddrell, 1996).
Therefore, it is difficult to track what factors
result in satisfied customers and which ones
make the customers dissatisfied. Meanwhile,
multi-item scales not only reveal the overall
satisfaction but the customers are also asked
to rate the key components of the service
process (Danaher and Haddrell, 1996). In
addition, Chan et al. (2003) argue that
multi-item scales are significantly more reliable
than the single-item scale. In this study,
customer satisfaction will be measured
using both single item scales and multi item
scales.
Figure 1: Stages to Establish Measurement Equivalence/Invariance Test
Stage 5 Stage 2 Stage 3 Stage 4 e1 e2 e3 e4 e5 e6 e7 e8 X1 X5 X2 X6
η
1η
2 X3 X7 X4 X8Note: Stage 1 is to perform the above model (named as a baseline model) with all of the coefficients are freely estimated
Customer Satisfaction (multi-item scale) (Athanassopoulos ,2000) • Corporate • Innovativeness
• Physical and staff service
• Pricing • Convenience
• Large branch network • Company’s prestige • Privacy of transaction • Product variety • New product introduction
• Product flexibility to cover personal needs • Staff courtesy
• Staff knowledge • Commissions charged • Close to work
• Close to main road network • Hours of operation • No existing measure
- Size of branch network - Company’s prestige - Privacy of transaction - Product variety/range - New product introduction
- Product flexibility to cover personal needs - Staff courtesy
- Staff knowledge - Commissions charged
- The office location - Hours of operation - Accessibility (e.g. via email, via telephone)
Construct Original Measures Measures Used in this Study
Table 1: Measures for Customer Satisfaction Construct
Customer Satisfaction (single-item scale) (Oliver, 1981; Spreng et al 1996.)
• Overall, how satisfied are you with your product? Very … Very
dissatisfied satisfied
• Overall, how do you feel about buying the product? Very pleased … Very displeased
Frustrated … Contented Terrible … Delighted
• To what extent does your product meet your expectations?
Fell short of my … Exceeded expectations expectations
- Overall, how satisfied are you with your car insurance? Very … Very
dissatisfied satisfied
- Overall, how do you feel about having car insurance? Very pleased … Very displeased
Frustrated … Contented Terrible … Delighted
- To what extent does your car insurance meet your expectations?
Fall short of my … Exceed my expectations expectations
An Application on
Customer Satisfaction Survey
In this study, measurement equivalence/
invariance has been applied on the measures
for customer satisfaction. The questionnaires
of this study were distributed to three groups
of consumers. Therefore, the respondents in
the three groups must perceive the measures
of customer satisfaction equivalently. In
other words, the three groups have the same
understanding about the measures used in
the questionnaires.
Because of much debate in the literature
on the use of single-item, the construct
of customer satisfaction is better to be
measured using both a multi-item scale and
a single-item scale. For the purpose of this
study, the measures for multi-item scales
for customer satisfaction are adapted from
Athanassopoulos (2000). These measures
consist of “corporate, innovativeness, physical
and staff service, pricing, and convenience”.
Based on the feedback from consumers,
“accessibility” was included in the measure for
the satisfaction construct. The measures for
the single-item scale are “overall satisfaction
and disconfirmation” based upon the existing
literature put forward by Spreng et al.
(1996) and Oliver (1981). The measures for
the customer satisfaction construct using
multi-item scale and single-item scale are
presented in Table 1.
Results
To perform measurement equivalence/
invariance, the six stages as depicted in
Figure 1 has been followed. In the first
stage, the result indicates that the baseline
model had
χ
2=12.810, df=8, p=.119,χ
2/df=1.601, RMSEA=.036, NFI=.966, CFI=.986,
and TLI=.966. This baseline model was
deemed to fit the data adequately. Model 1
(configural invariance) had
χ
2=13.066, df=11,p=.289,
χ
2/df=1.188, RMSEA=.020, NFI=.965,CFI=.994, and TLI=.989. The resultant
χ
2 fromthis restricted model is compared with that
from baseline model. Model 1 is nested in
baseline model so the chi-square difference
is the appropriate test. Thus, the formal test,
Δ
χ
2(Δdf)= .256 (3), p>.95 (not significant).This result suggests that the regression
weights are invariance across the comparison
groups.
Testing for weak factorial invariance (Model
2) had
χ
2=17.911, df=14, p=.211,χ
2/df=1.279,RMSEA=.025, NFI=.952, CFI=.989, and
TLI=.984. Further, Model 1 is compared with
Model 2. The result indicates that Δ
χ
2(Δdf)=1.615 (3), p>.25 (not significant). This suggests
that the factor loadings are invariance across
the comparison samples. Hence, next stage
for testing strong factorial invariance can be
continued.
Strong factorial invariance (Model 3) had
χ
2=25.868, df=17, p=.077,χ
2/df=1.522, RMSEA=.033, NFI=.930, CFI=.975, andTLI=.970. The result of Model 3 is compared
to Model 2 which shows that Δ
χ
2(Δdf) =2.652 (3), p<.05 (significant). This suggests
that that the conceptualization of customer
satisfaction has been perceived significant
differently (non-equivalent) by comparison
samples at the Strong Factorial Level (Model
3) as indicated by the significant p value
(p<.05). Therefore, further investigation is
needed to determine “what variable(s) are
perceived non-equivalent by consumers”. As
there are five main variables for measuring
satisfaction (corporate, convenience,
innovative-commission, expectation, and
feeling), the chi-square difference test was
performed on each variable. The result of
chi-square difference test using AMOS 5 is
presented in Table 2.
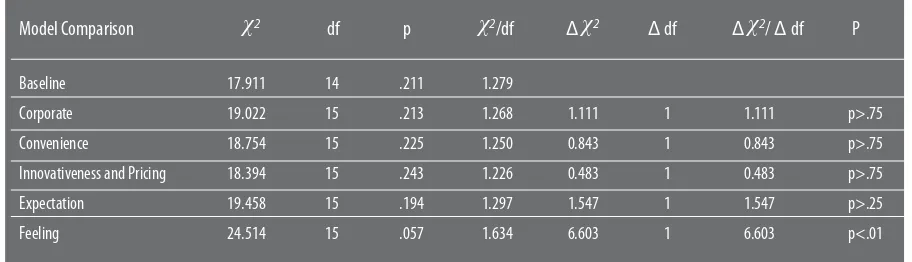
The above chi-square difference test
shows that the four variables: corporate,
convenience, innovative-commission,
expectation have been perceived similarly
(equivalent) by consumers. In other words,
only “feeling” has been perceived to be
significantly different (non-equivalent) by
consumers. Therefore, it can be concluded
that “corporate, convenience,
innovativeness-pricing, and expectation” can be generalized
for measuring customer satisfaction across the
three segments. Following the above result
(Table 2), the measurement equivalence/
invariance test needed to be re-performed
Model Comparison
χ
2 df pχ
2/df Δχ
2 Δ df Δχ
2/ Δ df PBaseline 17.911 14 .211 1.279
Corporate 19.022 15 .213 1.268 1.111 1 1.111 p>.75 Convenience 18.754 15 .225 1.250 0.843 1 0.843 p>.75 Innovativeness and Pricing 18.394 15 .243 1.226 0.483 1 0.483 p>.75 Expectation 19.458 15 .194 1.297 1.547 1 1.547 p>.25 Feeling 24.514 15 .057 1.634 6.603 1 6.603 p<.01
Table 3: Measurement Equivalence/Invariance for CUSTOMER SATISFACTION construct (Excludes the “Feeling Variable”)
Model Comparison
χ
2df P
χ
2/df RMSEA NFI TLI
CFI
Δ
χ
2Δ df
Δ
χ
2/ Δ df
P
Δ NFI Δ TLI
Δ CFI
Baseline 5.773 4 .217 1.443 .031 .979 .980 .993
Model 1 (configural invariance) 6.018 6 .421 1.003 .003 .978 1.000 1.000
Model 1 VS Baseline 0.245 2 .1225 p>.75 -.001 .02 .007
Model 2 (weak factorial invariance) 10.542 8 .229 1.318 .026 .961 .985 .990
Model 2 VS Model 14.524 2 2.262 p>.10 -.017 -.015 -.01
Testing for weak factorial invariance
Model 3 (strong factorial invariance) 11.756 10 .302 1.176 .019 .957 .992 .993
Model 3 VS Model 2 .214 2 .607 p>.25 -.004 .007 .003
Testing for strong factorial invariance
Model 4 (strict factorial invariance) 12.079 11 .358 1.098 .015 .956 .996 .996
Model 4 VS Model 2 1.458 3 .486 p>.75 -.005 .011 .006
Testing for strict factorial invariance
Model 5 (elegant factorial invariance) 12.501 13 .406 1.042 .009 .954 .998 .998
Model 5 VS Model 2 1.959 4 .499 p>.75 .007 .013 .008
Additional: Measurement Equivalence/Invariance for CUSTOMER SATISFACTION construct
Model Comparison
χ
2df P
χ
2/df RMSEA NFI TLI
CFI
Δ
χ
2Δ df
Δ
χ
2/ Δ df
P
Δ NFI Δ TLI
Δ CFI
Baseline 12.810 8 .119 1.601 .036 .966 .966 .986
Model 1 (configure invariance) 13.066 11 .289 1.188 .020 .965 .989 .994
Model 1 VS Baseline .256 3 .086 p>.95 -.001 .023 .008
Model 2 (weak factorial invariance) 17.911 14 .211 1.279 .025 .952 .984 .989
Model 2 VS Model 14.845 3 1.615 p>.25 -.013 -.005 -.005
Testing for weak factorial invariance
Model 3 (strong factorial invariance) 25.868 17 .077 1.522 .033 .930 .970 .975
Model 3 VS Model 2 7.957 3 2.652 p<.05 -.022 -.014 -.014
Testing for strong factorial invariance
Model 4 (strict factorial invariance) 26.243 18 .094 1.458 .031 .929 .974 .977
Model 4 VS Model 2 8.332 4 2.081 p>.10 -.023 -.010 -.012
Testing for strict factorial invariance
Model 5 (elegant factorial invariance) 28.836 20 .091 1.442 .031 .922 .975 .975
Model 5 VS Model 2 10.925 6 1.820 p>.10 -.030 .009 -.014
excluding the “feeling” variable as it was
detected that this item was perceived by
consumers to be non-equivalent. The results
are presented in Table 3.
The measurement equivalence test, as
presented in Table 3 shows that without
“feeling” variable, the conceptualization of
customer satisfaction has been perceived as
equivalent by the three groups of consumer
as indicated by the non-significant of all
the p value. Hence, further investigation on
comparing mean (e.g using ANOVA) across
the three groups of consumer is warranted.
Conclusions and Future Research Directions
Before conducting research using group
comparison analysis (e.g. ANOVA, T-Test,
Chi-Square, Discriminate Analysis), researchers
have to establish the measurement
equivalence/invariance test. This is important
because the test for the difference is identified
in the measurement level, therefore the final
tests of group comparison analysis is valid.
As an example, this paper has demonstrated
the stages to establish ME/I for the measures
of customer satisfaction, which is derived
from the existing literature. The result
indicates that the measures cannot be
generalized. The implication of this study
is that researchers who are interested in
investigating customer satisfaction across
groups (e.g. across gender, age, countries,
cities, organizations, segments, etc) must
establish measurement equivalence. This
study found that the “feeling” variable as
one of the measures of customer satisfaction
was perceived to be significantly different by
different groups consumers. By excluding this
variable, the measure of customer satisfaction
has been perceived to be not significantly
different (equivalent) by the three groups of
consumer. This finding suggests that further
research into measurement equivalence
across groups should reveal whether any
variable(s) or item(s) of the measures cannot
be generalised across groups. Those specific
variable(s) that cannot be generalised
should be used with caution or eliminated.
As a result, researchers who have applied
measurement equivalent in their research
in the context of cross-groups comparison
(e.g. customer satisfaction), the findings can
be generalized.
Athanassopoulos, Antreas D., 2000, “Customer satisfaction cues to support market segmentation and explain switching behavior,” Journal of Business Research, 47 (3 March), 191-207.
Bodet, Guillaume, 2008, “Customer satisfaction and loyalty in service: Two concepts, four constructs, several relationships”, Journal of Retailing and Consumer Services, 15, 165-162
Bollen, Kenneth A., 1989, Structural Equations with Latent Variables, New York: John Wiley & Sons.
Hayduk, Leslie A., 1987, Structural Equation Modeling with LISREL: Essentials and Advances, Baltimore: Johns Hopkins University Press.
Luo, Xueming and Christian Homburg, 2007, “Neglected outcomes of customer satisfaction,” Journal of Marketing, 71 (April), 133-149
Mavondo, Felix and Mark A. Farrell, 2000, “Measuring market orientation: Are there differences between business marketers and consumer marketers?,” Australian Journal of Management, 25 (2), 223-244.
----, Mark Gabbott, and Yelena Tsarenko, 2004, “Measurement invariance of marketinginstruments: An implication across countries,” Journal of Marketing Management, 19, 523-540.
Oliver, R.L., 1981, “Measurement and evaluation of satisfactionprocesses in retail settings,” Journal of Retailing, 57 (3), 25-48.
Shannon, Anderson, Lisa. K. Pearo, and Sally K. Widener, 2008, “Drivers of service satisfaction: Linking customer satisfaction to the service concept and customer characteristics,” Journal of Retailing 10 (4), 365-381.
Spreng, Richard A., S.B. Mackenzie, and R.W. Olshavsky, 1996, “A reexamination of the determinants of consumersatisfaction,” Journal of Marketing, 60 (3), 15-32.
Vanderberg, Robert J. and Charles E. Lance, 2000, “A review and synthesis of the measurement invariance literature: s u g g e s t i o n s , p r a c t i c e s , a n d recommendations for organizational research,” Organizational Research Methods, 3 (1), 4-70.
Widaman, K.F. and S.P. Reise, 1997, “Exploring the measurement invariance of psychological instruments: Application in substance use domain,” in The Science of Prevention: Methodological Advances from Alcohol and Substance Abuse Research, B.J. Kendall and M.T. Windle and S.G. West, Eds. Washington DC: American Psychological Association.