Journal of Engineering Sciences, Volume 5, Issue 1 (2018), pp. H 23–H 28 H 23 JOURNAL OF ENGINEERING SCIENCES
УРНА ІН Н РНИХ НАУ
УРНА ИН Н РНЫХ НАУ
Web site: http://jes.sumdu.edu.ua
DOI:
10.21272/jes.2018.5(1).h4
Volume 5, Issue 1 (2018)UDC 504.06
Efficiency Analysis of Tracking and Stationary Solar Panel Modes Against Solar Radiation
Samaulah H.1*, Basir Y.1, Helmi M.1, Faturrizky F.1, Sugawara A.2 1
Tridinanti University of Palembang, 30129 South Sumatera, Indonesia; 2
Niigata University, 950-2181 Niigata, Japan
Article info:
Paper received:
The final version of the paper received: Paper accepted online:
April 4, 2018 May 24, 2018 May 27, 2018
*
Corresponding Author’s Address:
[email protected]
Abstract. The utilization of solar energy sources is done by using photovoltaic (solar panels). The energy emitted by the sun is fluctuating. This change in radiation energy will also affect the output of solar panels. The relationship of change is what will be measured, observed and proven in this study. The observations are made using a gauge called the solar power meter, where this device can read the amount of solar radiation energy in the W/m2 unit. While the output to be measured is the output power generated by the solar panel itself. Measurement in this study was done using two modes; i. e. stationary mode and tracking mode. The stationary mode is done by placing the solar panel face with slope and azimuth in a predetermined direction, while the tracking mode is to place the solar panel face ex-actly 90° to the sun. Evidently by placing the solar panels to keep the sun coming up, it can achieve efficiency up to 14.1 % compared to stationing solar panels stationed 75° to the north which can only achieve efficiency of 13.7 %.
Keywords: radiation energy, photovoltaic, efficiency, solar panel.
1
Introduction
Sun energy or better known as solar energy has now become one of the alternative energy sources for the gen-eration or provision of electrical energy. The existence of science in the development of new and renewable re-sources is a solution in answering the problematic about the limited availability of fossil resources. Radiation from solar energy is absorbed through medium called solar panels and then converted into electrical energy [1–2].
Given the nature of the sun that is always changing every time, it can be ascertained that the electrical energy generated by a solar panel will also experience fluctua-tions. This needs to be observed and taken into account in order to establish the best tilt angle or even the best mounting mode of a solar panel in a particular location where solar panels can generate maximum electrical en-ergy according to their highest wattage value.
This research attempt to discover to objectives; they are 1) proving the relationship of the angle of solar panels to the intensity of solar radiation that can be absorbed by solar panels; and 2) discover and prove the relation of the intensity of solar radiation absorbed by the solar panel with its output power. Therefore, this study focused on the magnitude of the intensity of solar radiation that can be absorbed by a solar panel and the power generated by solar panels positioned at a predetermined angle and time.
2
Literature Review
2.1
Sunlight
Solar energy supplies energy to the earth in the form of radiation. Solar energy system is exposed to different amounts of sunlight, which controls the amount of power generated by the solar energy conversion system. In other words, the system generates more power when it is exposed to greater amount of sunlight. Each year there are about 3.9·1024 J (1.08·1018 kW·h). Throughout the year, the distance between the sun and the earth varies between (1.47–1.52)·108
km.Consequently, irradiance E° fluctuates between 1.325–1.412 W/m2. The Earth’s at-mosphere retract and reduces the sun's radiation through the process of reflection, absorption (ozone, water vapor, oxygen and carbon dioxide) and scattering (air molecules, dust particles or pollution). For sunny weather during the day, the irradiance reaching the earth’s surface are 1 W/m2.
2.2
Solar panels
2.2.1 The structure of solar panels
tem-H 24 CHEMICAL ENGINEERING: Environmental Protection perature, these panels show low efficiency while
convert-ing sunlight into energy. As a result, the system perfor-mance is diminished and the power generation system encounters a one-third loss approximately [9–10]. There-fore, a solar energy system is exposed to different amounts of sunlight, which controls the amount of power generated by the solar energy conversion system. In other words, the system generates more power when it is exposed to greater amount of sunlight.
One piece of solar cells illuminated by the sun can on-ly produce a dc voltage of 0.5–1.0 V, and short-circuit currents in the scale of mA/cm2. Therefore, a solar mod-ule typically consists of 28–36 solar cells and the total produces a dc voltage of 12 V in standard irradiation conditions. This collection of solar modules is then ar-ranged in a field called solar panels (Figure 1).
Figure 1 – The Solar Module (series)
2.2.2 How solar cells work
The photon is absorbed around depletion layer which is boundary between N-type silicon and P-type and an electron and a hole are separated. The electrons are at-tracted to the N-type silicon side, resulting in a potential voltage. It will increase electrical energy that can later be stored into a battery (Figures 2–3).
Figure 2 – How solar panels work
Figure 3 – Workflow of solar panels
The working process of receiving solar radiation by solar panels is to be converted into electrical energy.
2.2.3 Efficiency
The input power itself is the product of the intensity of solar radiation with the cross-sectional area of the solar panel.
,
·A E
Pin (1)
where Pin – input power, W; E – intensity of solar ra-diation, W/m2; A – cross section area, m2 (Figure 4).
Several factors can reduce or even increase the effi-ciency of such solar panels, such as surface temperature of solar panels, power losses present in the connecting cable, and others [6]. However, ignoring these factors, efficiency can be calculated using the following equation:
,
· out
in n P
P (2)
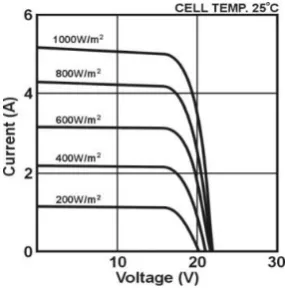
where n – efficiency value; Pout – output power. The effect of this solar intensity by assuming the tem-perature of the solar panel at a temtem-perature of 25 ° . Practically, the surface temperature of solar panels will also fluctuate [2]. The solar cell will operate optimally if its surface temperature remains normal and stable at 25 °C. A rise in temperature higher than normal will weaken the voltage Voc (Figure 5).
Figure 4 – The effect of intensity change
Journal of Engineering Sciences, Volume 5, Issue 1 (2018), pp. H 23–H 28 H 25
3
Research Methodology
3.1
Research workflows
The diagram of the research flow is presented in Figure 6.
Figure 6 – The diagram of the research flow
3.2
Specification of solar module
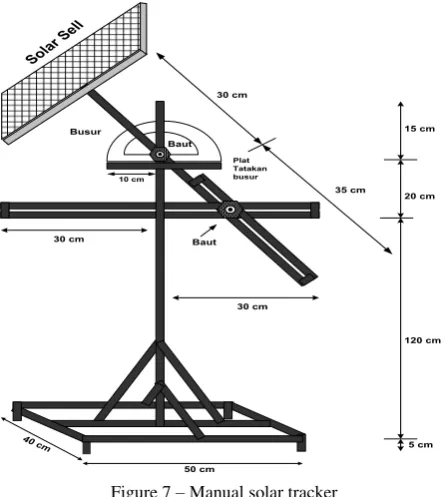
The specification of Solar Cell 50WP (Figure 7) is presented in Table 1.
Table 1 – Specification of Solar Cell 50WP
Specification
(Polycrystalline) Information
Maximum power Pmax 50 W
Maximum power voltage Vmp 16.5 V Maximum power current, Imp 3.34 A Open circuit voltage, Voc 21.1 V Short circuit current, Isc 4.23 A Nominal operating cell
tem-perature, NOCT 45 ± 2 °C
Maximum system voltage 1 000 V
Maximum series fuse 16 A
Total mass 6.5 kg
Dimensions 775×680×28 mm
15 cm
20 cm
120 cm
5 cm
50 cm
40 cm
30 cm
35 cm Busur
So lar
Sel l
30 cm
30 cm
10 cm
Baut Baut
Plat Tatakan busur
Figure 7 – Manual solar tracker
3.3
Position of solar panel
For stationary solar panels, this condition is set for each measurement time:
– putting solar panels in one fixed position; – azimuth: 180° facing north;
– slope: 75°.
For solar tracking panels, its placement basically means always positioning solar panels by precisely fol-lowing the direction of the sunlight. The adjustment of the tilt of the solar panel is adjusted at the following an-gles to adjust the direction of the sun on each hour:
– azimuth: 180° facing east;
– slope: from 30° to 150° with step 15°.
3.4
Time and location measurement
This measurement is done in rooftop of Magister Man-agement Building of Tridinanti University of Palembang. Objects that need to be measured are the intensity of solar radiation absorbed by solar panels, as well as the current and output voltage of solar panels. For that the measuring tools that need to be used includes: Solar Power Meter and Multimeter (Figure 8).
H 26 CHEMICAL ENGINEERING: Environmental Protection
4
Discussion and Analysis
4.1
The relationship of the angle to the
radiation of the sun per day
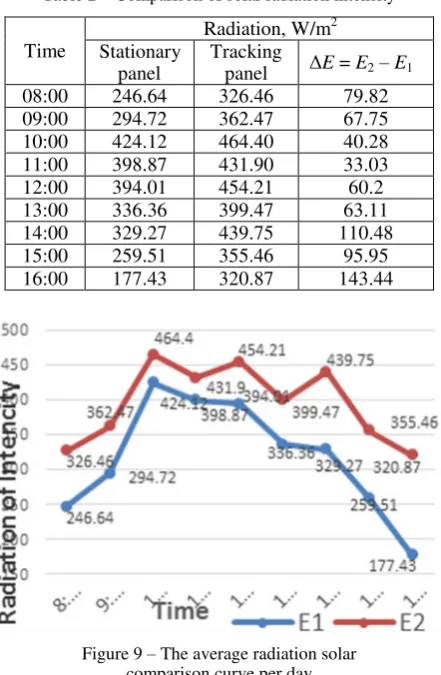
The comparison of solar radiation intensity is present-ed in Table 2 and Figure 9, where E2 – intensity of solar radiation captured by solar panel tracking; E1 – intensity of solar radiation captured by stationary solar panels.
Table 2 – Comparison of solar radiation intensity
Time
Radiation, W/m2 Stationary
panel
Tracking
panel ΔE = E2 – E1
08:00 246.64 326.46 79.82
09:00 294.72 362.47 67.75
10:00 424.12 464.40 40.28
11:00 398.87 431.90 33.03
12:00 394.01 454.21 60.2
13:00 336.36 399.47 63.11
14:00 329.27 439.75 110.48
15:00 259.51 355.46 95.95
16:00 177.43 320.87 143.44
Figure 9 – The average radiation solar comparison curve per day
From the curve above we can see that solar panels with tracking mode can capture more solar radiation in a day. This is evidenced by the deviation value between the two that shows positive results.
The lowest increase is at 11:00, i. e. 33.03 W/m2, or 8.3 %:
%. 3 . 8 % 100
·
95 . 397
03 .
33
n
The highest average increase was at 16:00, i. e. 143.44 W/m2 or 81 %:
%. 81 % 100
·
43 . 177
44 .
143
n
A positive ΔP value indicates that the output power of the solar panel with tracking mode (perpendicular to the sun) is greater than the stationary solar panel. This is directly proportional to the intensity of solar radiation (Table 3, Figure 10). Where as the increased intensity of solar radiation that can be absorbed by a solar panel, it will also increase the output power.
Table 3 – Difference in output power of both solar panel modes
Time Output power, W
P1 P2 ΔP = P2 – P1
08:00 13.78 22.83 9.05
09:00 18.00 25.26 7.26
10:00 27.95 32.68 4.73
11:00 26.76 29.54 2.78
12:00 28.38 33.70 5.32
13:00 21.99 27.58 5.59
14:00 21.21 28.40 7.19
15:00 16.34 23.15 6.81
16:00 9.96 22.26 12.3
Figure 10 – Average power comparison curve
In Table 3, P1 is the output power of the stationary so-lar panel; P2 is the solar power output tracking.
The lowest power increase is at 11:00 o’clock at 2.78 W or 10 %.
%. 0 . 10 % 100
·
76 . 26
78 .
2
Journal of Engineering Sciences, Volume 5, Issue 1 (2018), pp. H 23–H 28 H 27
4.2
Efficiency
Using the number equation (1) to determine the input power and equation (2) to determine its efficiency.
Table 4 – Efficiency of stationary solar panel output power
Time Radiation, W/m2
Pin = E·A, W
Pout, W
n =Pout / Pin, %
08:00 246.64 129.98 13.78 10.60
09:00 294.72 155.32 18.00 11.59
10:00 424.12 223.51 27.95 12.50
11:00 398.87 210.20 26.76 12.73
12:00 394.01 207.64 28.38 13.67
13:00 336.36 177.26 21.99 12.41
14:00 329.27 173.53 21.21 12.22
15:00 259.51 136.76 16.34 11.95
16:00 177.43 93.51 9.96 10.65
Table 5 – Efficiency of solar panel tracking power output
Time Radiation, W/m2
Pin = E·A, W
Pout, W
n =Pout / Pin, %
08:00 326.46 172.04 22.83 13.27
09:00 362.47 191.02 25.26 13.22
10:00 464.40 244.74 32.68 13.35
11:00 431.90 227.61 29.54 12.98
12:00 454.21 239.37 33.70 14.08
13:00 399.47 210.52 27.58 13.10
14:00 439.75 231.75 28.40 12.25
15:00 355.46 187.33 23.15 12.36
16:00 320.87 169.10 22.26 13.16
Referring to table above, we can see that solar panels are placed in a static state on the 180° slope facing north and azimuth 75°, has an efficiency value below its stand-ard. The conditions that enter the efficient range only occur at 12:00 which is also the peak of sun exposure in west Indonesia in particular.
In the solar panel tracking, the state is relatively effi-cient except at an average of 14:00 and 15:00. This may happen because of various factors; including weather, surface temperature of solar panels and power losses [7]. However, the subject of our discussion is that there is an increase in the efficiency of its output when the solar panel is positioned perpendicular to the sun.
4.3
Average solar radiation intensity ratio of
four solar panel modes in one full day
Comparing these four solar panel placement modes based on the average intensity of captured solar radiation and output power in a single day can be seen from the curves below (Figure 11), where E1 – intensity of solar radiation captured by the northern stationary 70° solar panels; E2 – intensity of solar radiation captured by the solar panel tracking north-south; E3 – intensity of solar radiation captured by 70° stationary east solar panels; E4 – intensity of solar radiation captured by solar panels tracking east-west.Figure 11 – Graph of solar radiation intensity comparison of the four-mode solar panels
The eastern-western tracking mode with 15° changes per hour is still much better than the eastern stationary 70° mode as has been the standard provision of solar panel installation in Indonesia. While comparing east stationary 70° solar panels with a 70° north stationer; 70° eastern stationary mode is still better at capturing solar radiation though not much different.
4.4
Comparison of average output power of
all four solar panel modes in one full day
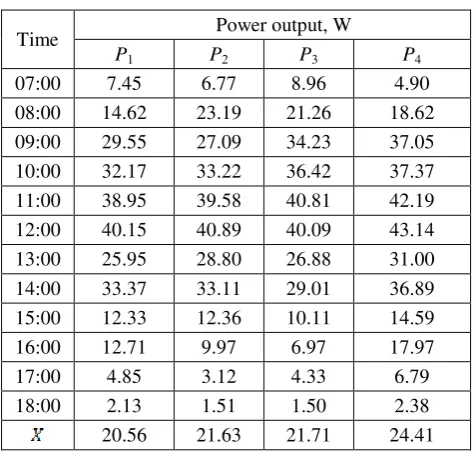
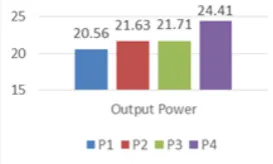
By calculating the output power obtained from the output voltage and current output of solar panel, the data as in Table 6, where p – output power of the northern stationary 70° solar panels; P2 – solar power output track-ing north-south; P3 – output power of the eastern station-ary 70° solar panels; P4 – solar panel power output tracking east-west.Table 6 – The average power of the solar panel outputs are all four modes
Time Power output, W
P1 P2 P3 P4
07:00 7.45 6.77 8.96 4.90
08:00 14.62 23.19 21.26 18.62
09:00 29.55 27.09 34.23 37.05
10:00 32.17 33.22 36.42 37.37
11:00 38.95 39.58 40.81 42.19
12:00 40.15 40.89 40.09 43.14
13:00 25.95 28.80 26.88 31.00
14:00 33.37 33.11 29.01 36.89
15:00 12.33 12.36 10.11 14.59
16:00 12.71 9.97 6.97 17.97
17:00 4.85 3.12 4.33 6.79
18:00 2.13 1.51 1.50 2.38
20.56 21.63 21.71 24.41
In this measurement, it concentrates on the ratio of the total average solar panel output power to all four solar panel modes.
H 28 CHEMICAL ENGINEERING: Environmental Protection Figure 12 – Graph of output power ratio
of all four solar panel modes
5
Conclusion and recommendations
The results of the measurement and discussion can be summarized as follows:
– the angle of a solar panel is very influential on the intensity of solar radiation that can be absorbed by a solar panel, which by positioning the solar panel remains per-pendicular to the sun, maximizing the absorption of sun
radiation 8.3–81.0 % compared with positioning the solar panel in a stationary state;
– the intensity of sunlight is proportional to the output power of a solar panel, where the increase in power that can be achieved by setting the position of the solar panel perpendicular to the sun is 10–23 % compared to posi-tioning the solar panel on a stationary state.
Based on the conclusions, it can be suggested:
– to maximize efficiency, solar panels are expected to be positioned perpendicular to the sun. This is possible by using automatic solar tracker;
– installation of solar panels should be located in high places that are not blocked by the shadow of the any ob-jects or other buildings;
– in the case of measurement and testing, it should use more than one solar panel to adjust the number of modes to be measured to avoid errors caused by time delay in measurement.
References
1. Arbab, H., Jazi, B., & Rezagholizadeh, M. (2009). A computer tracking system of solar dish with two-axis degree freedoms based on picture processing of bar shadow. Renew Energy, 34, 1114–1118.
2. Arismunandar, W. (1995). Teknologi rekayasa surya. Jakarta, Vol. 1, pp. 17.
3. Ghosh, H. R., Bhowmik, N. C., & Hussain, M. (2010). Determining seasonal optimum tilt angles, solar radiations on variously oriented, single and double axis tracking surfaces at Dhaka. Renew Energy, 35, 1292–1297.
4. Hoesin, H. (2011). Memahami radiasi matahari dari enam hal, menuju langit biru dan teknologi pemanfaatanya. Accessed online at September 9th, 2017.
5. Yohana, E. (2010). Pengaruh suhu permukaan photovoltaic module 50 W peak terhadap daya keluaran yang dihasilkan menggunakan reflektor dengan variasi sudut reflektor 0°, 50°, 60°, 70°, 80°. Jurnal Universitas Diponegoro, Semarang, Univer-sitas Diponegoro.
6. Raditya, G. (2015). Faktor yang mempengaruhi kinerja solar panel. Accessed online at August 30th, 2017.
7. Sidopekso, S., & Febtiwiyanti , A. E. (2010). Studi peningkatan output modul surya dengan menggunakan reflektor. Jurnal Uni-versitas Negeri Jakarta. Jakarta: UniUni-versitas Negeri Jakarta.
8. Soeparman, S. (2015). Teknologi tenaga surya. Malang, Vol. 1.
9. Sudibyo, M. (2012). Menimbang ulang penyatuan zona waktu Indonesia. Accessed online.
10. Zahr, M., Friedrich, D., & Kloth, T.Y. (2010) Bionic photovoltaic panels bio-inspired by green leaves. Journal of Bionic Engi-neering, Vol. 7, pp. 284–293.
А а
в
в
ва ь
а
а
в
а
а а
.1
, Й.1, .1, .1, .2
1 П ь . , 30129, .
, І ;
2 , 950-2181, . ,
А а . є ь ,
. Е , , є ь .
є . ь ь, ь
. ь ь – ь
, ь , / 2. ,
є ь , ь, ь . ь
ь : .
є ь ь
, – 90° . П
, ь 14.1 %
, 75° 13.7%.