Original Research Article
Prevalence of smartphone addiction in an urban area of Kanchipuram
district, Tamil Nadu: a cross sectional study
Renuka K.*, Gopalakrishnan S., Umadevi R.
INTRODUCTION
Mobile phones have become an indispensable tool in our daily lives. In addition to making and receiving calls, mobile phones also support other functions such as SMS,
WhatsApp, internet access, Bluetooth, gaming,
photography etc. Mobile phones that offer these facilities are called smartphones. The first mobile phone was launched by Motorola in 1973 and since then there has been various advancements in the mobile phone applications. From 1973 to 2019 worldwide mobile phone users have increased from zero to 4.68 billion, thus penetrating every section of the society.1 Similarly the
smartphone usage around the world has also increased considerably from 1.57 billion in 2014 to 2.53 billion on 2018. It is estimated that over 36% of the world’s population uses a smartphone by 2018 up from about 10% in 2011. In India about 4 million people use a smartphone as on 2018.1
Smartphones have made our life easy in many ways but we should also be aware of the negative effects of smartphone usage and the most concerning is the smartphone addiction. Addiction is considered by WHO as dependence, as the continuous use of something for the sake of relief or stimulation which often causes cravings
ABSTRACT
Background: The use of mobile phones especially smart phones have become an integral part of everyone’s life leading to addiction. Most of the studies conducted earlier were focused on youngsters. Hence this study was conducted to find out the prevalence of smart phone addiction in the study area.
Methods: Community based cross sectional study carried out in Anakaputhur, Tamil Nadu from November 2018 to
January 2019. Sample size of 400 was calculated using the formula 4PQ/L2. The respondents were selected by systematic random sampling. Subjects 18 years and above who are using mobile phones were included in the study. Data was analyzed using SPSS 16 version and presented using descriptive and analytical statistics.
Results: Out of 405 participants 191 participants were non smart phone users and 214 were smart phone users. Overall prevalence of smart phone addiction was 27.6%. Male respondents were more addicted than the female (OR-1.94, 95%CI: 1.12-3.77, p=0.01). There was a statistically significant association between subjects <45 years of age and smart phone addiction (OR-2.33, 95% CI: 1.31-4.13, p=0.003) compared to older age group. Likewise respondents who were class III (modified BG Prasad Scale) and above were more addicted compared to subjects below class III (OR-2.29, 95% CI: 1.32-3.98, p=0.002).
Conclusions: The prevalence of smart phone addiction is high that has to be addressed seriously. This can be tackled
by better life style modification, awareness creation and attitudinal changes.
Keywords: Mobile phone, Phone dependence, Phone abuse
Department ofCommunity Medicine, Sree Balaji Medical College and Hospital, Chennai, Tamil Nadu, India
Received: 16 August 2019
Revised: 30 August 2019
Accepted: 03 September 2019
*Correspondence:
Dr. Renuka K.,
E-mail: [email protected]
Copyright: © the author(s), publisher and licensee Medip Academy. This is an open-access article distributed under
the terms of the Creative Commons Attribution Non-Commercial License, which permits unrestricted non-commercial use, distribution, and reproduction in any medium, provided the original work is properly cited.
when it is absent.2 The two major categories of addiction involve either substance addiction e.g. drugs or alcohol addiction or behavioral addiction such as mobile phone addiction. The terms smartphone addiction, mobile phone overuse, mobile phone dependence describes more or less the same phenomenon.
Globally the smart phone usage is increasing day by day with more and more adolescents being addicted to it. Smart phone overuse can be a sign of smart phone addiction as per the studies of Kim et al, excessive use of smartphone can affect the social, psychological wellbeing and health.3 Clinical psychologist Lisa Merlo says “some patients pretend to talk on phone or fiddle with apps in order to avoid eye contact or other interactions”. Many studies show that increased use of smartphone or mobile phones are associated with headache, dizziness, impaired memory and concentration, fatigue and disturbed sleep.4 Excessive use of smartphone is also associated with macular degeneration which ultimately leads to blindness. Consistent use of smartphone has adverse effects on users’ life which usually starts with social disorders that can ultimately lead to depression and stress
All these physical, psychological and social problems due to smart phone addiction are being identified as an emerging issue. But not much research has been conducted on these issues in the study area. Hence this study was conducted to find out the prevalence of smartphone usage and the level of smartphone addiction in the urban area of Kanchipuram district in Tamil Nadu.
METHODS
Study design
This is a community based cross sectional descriptive study
Study area and population
This study was conducted in Anakaputhur, the urban field practice area attached to a Medical College in Kanchipuram district, Tamil Nadu. It has 18 wards with a population of 48,050 (males: 24,158; females: 23,892). This study was carried out among the adult population (above 18 years) who are permanently residing in the study area. The study was done for a period of three months from November 2018 to January 2019.
Sample size and sampling technique
The sample size was calculated based on the study done by Susila et al in the year 2015 in Tamil Nadu which recorded prevalence of mobile phone addiction as 41%.5 Taking this prevalence, the sample size was calculated using the formula 4PQ/L2 at 95% confidence interval, where the precision (L) is taken as 5% of P. Accounting 10% for non-response the sample size thus calculated was 387, which was rounded off to 400.
Systematic random sampling was used to identify the study participants. Details regarding the study area were obtained from the records maintained in the Urban Health Training Center (UHTC), Anakaputhur. Sampling interval was calculated as follows: Total number of households in Anakaputhur (N)=1851, Sample size (n)=400, Sampling interval= N/n= 1851/400= 4.6. Thus every 5th household was selected for identifying a subject aged 18 years and above who are using a mobile phone, it can be either a normal cell phone or smart phone. If there was no eligible respondent in the selected household, the next house with the eligible study subject was selected. From that house, the next 5th household was selected. This procedure was followed till the desired sample size was reached.
Selection criteria
Resident individuals aged 18 years and above using mobile phones and willing to participate were included in the study. Individuals who stayed as guests in the selected households, those who were <18 years of age and those who were not willing to participate in the study were excluded from the study.
Data collection
Data was collected from eligible and willing participants using a pre-tested structured questionnaire. It consisted of details regarding the socio-demographic characteristics and the pattern of usage of mobile phone.
Smartphone Addiction Scale Short Version (SAS-SV) was used to assess the smartphone addiction pattern among the residents. SAS-SV addresses issues such as daily life disturbance, withdrawal, cyberspace oriented relationship, overuse and tolerance. The internal consistency and concurrent validity of SAS-SV were verified (Cronbach’s alpha=0.967).6
It contains 10 items rated on Likert scale (1- strongly disagree to 6- strongly agree). Total of the responses were calculated and compared to the cut off points of 31 for male and 33 for female.7 Subjects who scored higher than the cut off value were considered to be addicted.
Statistical analysis
Data collected was entered in Microsoft Excel and analysis was done using descriptive and analytical statistics in SPSS software version 16.0. The results were obtained by applying appropriate descriptive and analytical statistics.
Ethical approval and informed consent
RESULTS
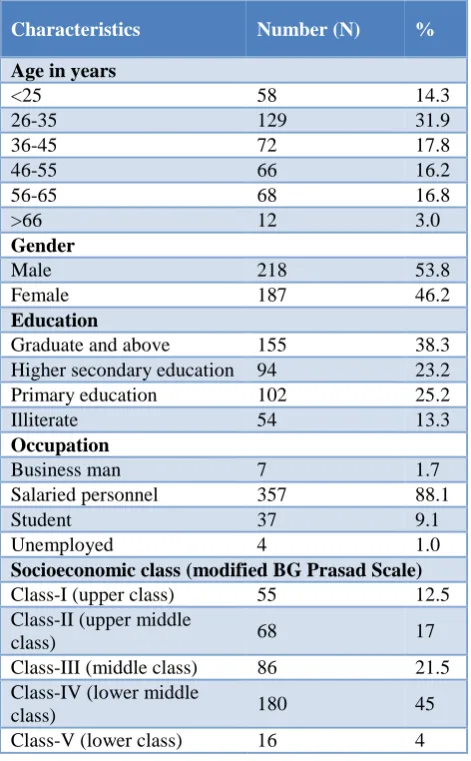
A total of 405 subjects participated in this study on Smartphone addiction. Even though the required sample size was 400, completed data was available for 405 persons, hence the analysis was done for a total of 405 study subjects. The results of the smartphone addiction study are presented below as tables and graphs. The socio demographic characteristics of the study participants are summarized in Table 1.
Table 1: Socio demographic characteristics of study participants (n=405).
Characteristics Number (N) %
Age in years
<25 58 14.3
26-35 129 31.9
36-45 72 17.8
46-55 66 16.2
56-65 68 16.8
>66 12 3.0
Gender
Male 218 53.8
Female 187 46.2
Education
Graduate and above 155 38.3
Higher secondary education 94 23.2
Primary education 102 25.2
Illiterate 54 13.3
Occupation
Business man 7 1.7
Salaried personnel 357 88.1
Student 37 9.1
Unemployed 4 1.0
Socioeconomic class (modified BG Prasad Scale)
Class-I (upper class) 55 12.5
Class-II (upper middle
class) 68 17
Class-III (middle class) 86 21.5
Class-IV (lower middle
class) 180 45
Class-V (lower class) 16 4
The participants involved in the study were in the age group of 18-75 years. The mean age of the participants was 40.5 years. About 64% of the respondents belonged to the age group of <45 years and around 36% of the respondents were >45 years. Male participants were predominantly higher (53.8%) compared to female participants (46.2%)
Majority of the respondents were graduates (38.3%) while 13.3% of the respondents were illiterates. About 88% of the respondents were salaried personnel and 9% of the respondents were students. According to modified BG Prasad socio economic classification majority of the subjects belonged to Class IV socio economic class (45%).
Figure 1: Prevalence of smart phone addiction status in study population.
Of the 405 study participants 191 participants were non smart phone users and 214 were smart phone users. Overall the prevalence of smart phone addiction is found to be 27.6% which is shown in Figure 1.
In the present study, we found a statistically significant association between subjects who were <45 years of age and smart phone addiction (OR-2.33, 95% CI: 1.31-4.13, p=0.003). Male respondents were more likely to get addicted by smart phone usage compared to the female respondents and the association was also found to be statistically significant (OR-1.94, 95%CI: 1.12-3.77, p=0.01). Similarly subjects who belonged to Class III and above according to Modified BG Prasad scale classification for socio economic class were more likely to get addicted by smart phone usage (OR-2.29, 95% CI: 1.32-3.98, p=0.002). The details of the association between the determinants and smart phone addiction is given in the Table 2.
Table 2: Association between determinants of smart phone addiction (n=214).
S.no Factors
Smart phone addiction present
Smart phone addiction absent
N
Chi-square value
P value OR
(95% CI)
1.
Age in years
<45 82 55 137
8.62 0.003* 2.33
(1.31-4.13)
>45 30 47 77
2.
Gender
Male 72 49 121
5.73 0.016* 1.94
(1.12-3.77)
Female 40 53 93
27.60% 72.40%
Addicted Not addicted
S.no Factors
Smart phone addiction present
Smart phone addiction absent
N
Chi-square value
P value OR
(95% CI)
3.
Education
Higher secondary
and above 110 98 208
0.89 0.34 2.237
(0.38-17.78) Below higher
secondary 2 4 6
4.
Occupation
Employed 93 87 180
0.20 0.65 0.84
(0.39-1.77)
Unemployed 19 15 34
5.
Socio economic class (modified BG Prasad Scale)
Class III and above 44 61 105
8.99 0.002* 2.29
(1.32-3.98)
Below Class III 68 41 109
*P value (<0.05) significant at 95% CI.
DISCUSSION
Smart phone usage is advancing at a rapid rate globally. It is not the rapid advancement of technology that is alarming but rather misuse or overuse of these gadgets is more alarming. A research done by Nokia reveals that an average person checks the phone every 6.30 minutes in a 16 hour waking cycle. It is because of these facts that these subjects complain of stiffening up of the back, developing a stoop, tendon injuries, carpel tunnel syndrome, radiation related blindness and inattention blindness.8 This study was done to find out the prevalence of smart phone addiction in an urban community and the interesting outcomes are discussed below
The prevalence of smart phone addiction in the study group is 27.6% which is lower when compared to the study performed by Sethuram et al. in which about 85% of the respondents were high smart phone users.9 Higher prevalence rate (85%) may be because the study was carried out on a specific population i.e. medical students in the age group of 17 to 20 years. In another study conducted by Soni in Indore the prevalence rate of smart phone addiction among the school students were found to be 33%.10 The percentage of smart phone addiction among adolescents were 30.9% in Korea, 10 percent in England, 21 percent in the Philippines, and 18 percent in Hong Kong.11-13 The discrepancies in the prevalence rate may also be due to different classification methods used in different studies and also difference among the participants and different geographical areas in the studies. The high prevalence rate in the present study indicates the potential health problem posed by smart phones in the community.
In our study the prevalence of smart phone addiction is higher among males 33.6% compared to females 18.9% and this difference is statistically significant (p=0.01). Bisen et al in their study showed that there is a significant difference between the addiction rates among the male and the female respondents.14 This is contrary to the results of the study done by Cha et al, Kwon et al, Prezza
et al where even though the rate of smart phone addiction is higher among the males it was not statistically significant.15,16 However some studies reported that female respondents have higher smart phone addiction rates compared to males.17 So up on viewing this scenario there is still a need for further studies to know more about the inconsistent prevalence of smartphone addiction in male and female.
In our study the prevalence of smart phone addiction was found to be greater in subjects who were less than 45 years (38%) compared to subjects who were 45 years and above (14%) and this difference was statistically significant (p=0.003). Similar results were obtained by Davey et al in his meta-analysis which showed that the percentage of smart phone addiction was greater in less than 45 years age group.8 Parsuraman et al in his study showed that majority (75%) of the study participants belonged to the age group of 21 to 25 years.18 Aljohara et al in his study showed that respondents less than 35 years were more addicted to smart phones than older age groups and this difference was statistically significant (p=0.01).19 However most of the studies on smart phone addiction were carried out on adolescent age group, more community based studies should be carried out in order to have a better view of the situation
In our study the prevalence of smart phone addiction is greater in subjects who were below the middle class (32%) compared to the subjects who were above the middle class (21%) and this difference was statistically significant (OR=2.29, 95% CI-1.325-3.989, p=0.003). Sahin et al in his study found that lower income students used their mobile phone more often compared to the higher income group.20 On contrary studies done by Susila et al, Luk et al, in their study stated that majority of the subjects belonged to the upper class.5,21
anxieties suffered by mobile phone users. Another important psychological problem which arises from excessive use of smart phones/mobile phones is ringxiety, a condition where the individuals feel that the phone is ringing whereas actually it is not. It is estimated that 25% of the mobile phone users in India are suffering from this disorder.22
Limitations of the study
Smart phone addiction is a widely prevalent problem with a greater penetration in the society therefore a sample of 400 cannot be generalized to whole population. This study provided a broader picture of smart phone use and addiction but could not provide a focused and a deep understanding of the situation. More over in this study we did not assess any psychiatric symptoms such as depression, anxiety, sleep disturbances, substance abuse which are often observed in the subjects with addictive disorders. Further studies should focus on single area, for example-type of smart phone addiction, gaming, shopping etc. which would enable us to understand the different usage pattern and user characteristics. This would help us in developing effective therapies and preventive programs based on the individual needs.
CONCLUSION
The study showed the overall prevalence of smart phone addiction in the study area to be 27.6%, which is comparatively higher. Smart phone addiction is becoming an increasing concern, we can reduce the impact of smart phones in our lives by modifying certain habits of our smart phone use. For example one can keep the phone out of sight when they are in social gathering, try deleting apps that are unwanted and turn off the audio notifications. Realize what triggers one to get addicted to smart phone and find better uses of the time in order to fight against the stress and boredom. We should make conscious efforts to interact with people in person rather than via phone. Our bodies and mind are built to thrive on human interactions, but isolation with technology will impact us badly.
ACKNOWLEDGEMENTS
We would like to thank the College Management and the Faculty of Department of Community Medicine for their logistic support and guidance throughout the study. We sincerely thank all the participants of the study for their valuable time in carrying out the study and the co-post graduates for helping us in completing this study. We also thank the field staff of UHTC, Anakaputhur for helping to carry out this study by organizing house visits.
Funding: No funding sources Conflict of interest: None declared
Ethical approval: The study was approved by the Institutional Ethics Committee of Sree Balaji Medical College and Hospital
REFERENCES
1. Number of mobile phone users worldwide 2015-2020. Statista. Available at: https://www.statista. com/statistics/274774/forecast-of-mobile-phone-users-worldwide/. Accessed on 8 august 2019.
2. WHO | Dependence syndrome. WHO. Available at:
https://www.who.int/substance_abuse/terminology/d efinition1/en/. Accessed on 8 august 2019.
3. Kim H. Exercise rehabilitation for smartphone addiction. J Exerc Rehabil. 2013;9(6):500-5. 4. Al-Khlaiwi T, Meo SA. Association of mobile
phone radiation with fatigue, headache, dizziness, tension and sleep disturbance in Saudi population. Saudi Med J. 2004;25(6):732-6.
5. Susila T, Somasundaram A, Jenifer A, Kamalipriya S, SwarnaPriya M, Gayathri G, et al. A cross sectional study on electronic device addiction among youth in an urban area, Chennai. Stanley Med J. 2017;4(1):2-7.
6. Development and Validation of a Smartphone
Addiction Scale (SAS). Available at:
https://journals.plos.org/plosone/article?id=10.1371/ journal.pone.0056936. Accessed on 8 august 2019.
7. Lopez-Fernandez O. Short version of the
Smartphone Addiction Scale adapted to Spanish and French: Towards a cross-cultural research in problematic mobile phone use. Addict Behav. 2017;64:275-80.
8. Davey S, Davey A. Assessment of Smartphone Addiction in Indian Adolescents: A Mixed Method Study by Systematic-review and Meta-analysis Approach. Int J Prev Med. 2014;5(12):1500-11. 9. Sethuraman AR, Rao S, Charlette L, Thatkar PV,
Vincent V. Smartphone addiction among medical college students in the Andaman and Nicobar Islands. Int J Community Med Public Health. 2018;5(10):4273-7.
10. Soni R, Upadhyay R, Jain M. Prevalence of smart phone addiction, sleep quality and associated behaviour problems in adolescents. Int J Res Med Sci.2017;5:515-9.
11. Lopez-Fernandez O, Honrubia-Serrano L, Freixa-Blanxart M, Gibson W. Prevalence of problematic
mobile phone use in British adolescents.
Cyberpsychology Behav Soc Netw. 2014;17:91-8. 12. Mak KK, Lai CM, Watanabe H, Kim DI, Bahar N,
Ramos M, et al. Epidemiology of internet behaviors and addiction among adolescents in six Asian countries. Cyberpsychology Behav Soc Netw. 2014;17(11):720-8.
13. Pan YC, Lin HH, Chiu YC, Lin SH, Lin YH. Temporal Stability of Smartphone Use Data:
Determining Fundamental Time Unit and
Independent Cycle. JMIR MHealth UHealth. 2019;7(3):e12171.
15. Kwon M, Kim DJ, Cho H, Yang S. The Smartphone Addiction Scale: Development and Validation of a Short Version for Adolescents. PLOS ONE. 2013;8(12):e83558.
16. Prezza M, Pacilli M, Dinelli S. Loneliness and new technologies in a group of Roman students. Comput Hum Behav. 2004;20:691-709.
17. Tavakolizadeh J, Atarodi A, Ahmadpour S,
Pourgheisar A. The Prevalence of Excessive Mobile Phone Use and its Relation With Mental Health Status and Demographic Factors Among the Students of Gonabad University of Medical Sciences in 2011-2012. Razavi Int J Med. 2014:2. 18. Smartphone usage and increased risk of mobile
phone addiction: A concurrent study. Available at: https://www.ncbi.nlm.nih.gov/pmc/articles/PMC568 0647/. Accessed on 8 august 2019.
19. Alhassan AA, Alqadhib EM, Taha NW, Alahmari RA, Salam M, Almutairi AF. The relationship between addiction to smartphone usage and
depression among adults: a cross sectional study. BMC Psychiatry. 2018;25;18(1):148.
20. Sahin S, Ozdemir K, Unsal A, Temiz N. Evaluation of mobile phone addiction level and sleep quality in university students. Pak J Med Sci. 2013;29(4):913– 8.
21. Luk TT, Wang MP, Shen C, Wan A, Chau PH, Oliffe J, et al. Short version of the Smartphone Addiction Scale in Chinese adults: Psychometric properties, sociodemographic, and health behavioral correlates. J Behav Addict. 2018;7(4):1157-65. 22. George S, Saif N, Joseph BB. A study on the mobile
phone usage pattern and its dependence among medical students of a college in Kerala, India. Int J Res Med Sci. 2017;5(8):3615-9.
Cite this article as: Renuka K, Gopalakrishnan S,