Original Research Article
Derivation of cut-off value for a 10 item opinion based ordinal
survey questionnaire
Balaji Arumugam
1, Suganya E.
1*, Saranya Nagalingam
2INTRODUCTION
Construction and validation of measurement instruments and their assessment to know whether, the instruments are reliable and valid forms of measurement, is known as psychometrics. It mainly involves in measuring the individual’s knowledge, ability, personality and types of behaviours. The common tool of measurement is in the
form of a questionnaire. To state a questionnaire, to have excellent psychometric properties, it must be evaluated for its content validity and reliability.1
The important procedure in scale development is content validity. It is the degree to which an instrument has an appropriate sample of items for the construct being measured.2
ABSTRACT
Background: Questionnaire is the most common tool for data collection in most of the study designs. In spite of the
advantage of using a standardized questionnaire for generalising the study findings, the major disadvantage is that all the population is never the same and its similarity exists only with the presence of heterogeneity, hence, any universal cut-off value cannot be used for the diverse population. This makes it clear that determination of cut-off value for any content validated questionnaire to the specified study population is essential, in order to make the study tool more effective.
Methods: This study was done to determine the cut-off value of psychometric scale of selfie addiction, which was content validated. A detailed mathematical model was used to determine the cut off value. Item analysis was done. Discrimination index, weightage of each item and correction factor was calculated to determine the cut-off value.
Results: The total weighted score, total raw score and correction factor are 28012.62 and 31,046, 0.9 respectively. The total adjusted scale cut-off is 30.43 (rounded as 30). The cut-off value based on crude mid-value is 25 and the cut off value determined for the standardised population is 21.Study population with cut-off value of >30 are considered to be a selfie addict, and those who have obtained a total score ≤30 are considered to be normal (non-selfie addict).
Conclusions: Present study is one of its kind, in determining the cut-off value for a content validated psychometric
scale without any gold standard. The above derived cut-off value of 30 for the psychometric scale of selfie addiction is valid for the specified population, as the Cronbach’s alpha, discrimination index and the correction factor is above 0.75.
Keywords: Selfie addiction, Discrimination index, Cut-off value, Correction factor
1Department of Community Medicine, Tagore Medical College and Hospital, Rathinamangalam, Vandalur, Chennai,
Tamil Nadu, India
2Intensive care unit, Vellamal Medical College, Madurai, Tamil Nadu, India
Received: 22 December 2017
Accepted: 12 February 2018
Accepted: 14 February 2018
*Correspondence:
Dr. Suganya E.,
E-mail: [email protected]
Copyright: © the author(s), publisher and licensee Medip Academy. This is an open-access article distributed under
the terms of the Creative Commons Attribution Non-Commercial License, which permits unrestricted non-commercial use, distribution, and reproduction in any medium, provided the original work is properly cited.
Content validity of various items in the scale can be measured using content validity ratio and content validity index.3 Analysis of content validity can be done, using four point and five point scales. Item content validity index of more than 0.8 is considered appropriate for individual items4 and content validity ratio more than the acceptable limit of 0.375, indicates the constructed item scale to have good content validity.5
In general standardized questionnaire are preferred for the research survey purpose. In spite of the major advantage that a standardized questionnaire can generalize the findings to the whole community, the characteristic features and behaviour of any two individuals in a community are never the same and hence heterogenecity always exist between any 2 population.6,7 This makes it clear, that, it is not ideal to set up a universal cut-off for any survey instrument, where study population is from
various communities with diverse socio-cultural
backgrounds. However, setting up a cut-off point is also necessary for opinion based questionnaires.8
With the above background, the study was planned to derive cut-off values for a 10 item psychometric scale for selfie addction without any reference gold standard.
METHODS
This study was done to determine the cut-off value of psychometric scale of selfie-addiction, which was content validated (Table 1). The scale measured the symptoms of addiction that fulfilled the expectations of the acceptability of the condition. The questionnaire had 10 items with Likert-scale having ordinal scores ranging
from 1-5 for each individual item. Thus the maximum overall score that can be obtained is 50 while the minimum score that can be obtained is 10. Score of 50, indicates the highest possibility of being a selfie-addict and 10, when there is zero possibility. Hence, higher the score, more chance of being a selfie-addict and vice versa.5 Since any such scales gives only the proportion of population responding to each item, derivation of cut-off value became essential, to distinguish a person either as
selfie-addict or non selfie-addict. The detailed
mathematical model for the determination of a cut-off level for decision-making in Norm-referenced test instrument is described below:
Calculation of discrimination index (DI) of individual items
= Point-biserial (Pearson’s) Correlation Coefficient
For the calculation of DI, we divide the test takers into three groups according to their scores on the test as a whole: an upper group consisting of the 27% who make the highest scores, a lower group consisting of the 27% who make the lowest scores, and a middle group consisting of the remaining 46%.
Discrimination index is calculated as follows
= (Up – Lp) U
Where, Upper group (Up) and Lower group (Lp) indicates the number of participants who have answered correctly in upper and lower group respectively; U is total participants in Up.
Table 1: Dr. Balaji Arumugam’s and Dr. Saranya Nagalingam’s Psychometric scale for selfie-addiction.5
S.No Item scale SA A N DA SDA
1 I always sneak time to take selfie’s
2 I always ponder of taking selfie irrespective of my work loads
3 I forget the time, environment and even my relations when, I am taking selfie’s
4 I find myself uncontrollable to stop taking selfies, once I start it
5 I use more than one electronic device to take selfie simultaneously
6 I take selfie’s even during sad situations
7 I feel exasperated when I am unable to take a selfie
8 I endeavour to cut down the amount of selfie’s I take, but I fail
9 I need counselling to reduce my selfie addiction
10 I cannot survive without taking selfie’s
Weightage of each response in each item of the
questionnaire(Table 2)
= (Observed Item Score) X (Discrimination Index) × (Internal Reliability Or Cronbach’s alpha)
Correction factor
= [(Total Weighted score) / (Total Raw Score)] (Table 2)
The cut-off point of an instrument without any gold standard
= Sum [(Mean of Individual Raw Score - 2SEM) × (Correction Factor)]9 (Table 3)
Where
Table 2: Calculation of Weighted scores and correction factor in a psychometric scale for selfie-addiction with 1-5 scores.
Items Discrimination index (DI) Cronbach’salpha
(CA)
Sum Total of Individual weighted scores =∑(xi X DI X CA)
Item 1 0.85 0.76 2765.26
Item 2 0.90 0.76 3163.58
Item 3 0.80 0.76 2696.32
Item 4 0.79 0.76 2841.86
Item 5 0.93 0.76 2926.12
Item 6 0.91 0.76 2696.32
Item 7 0.88 0.76 2765.26
Item 8 0.82 0.76 2788.24
Item 9 0.94 0.76 2742.28
Item 10 0.91 0.76 2627.38
Total Weighted score: 28012.62; Total Raw score (Calculated previously): 31,046; Correction factor = Weighted score/Raw score= 28012.62/31046= 0.9
Table 3: Calculation of cut-off value for a psychometric scale for selfie addiction.
Item Mean 2SEM Mean-2SEM Correction factor (CF) (Mean-2SEM) X CF
1 3.61 0.16 3.45 0.9 3.10
2 4.13 0.11 4.02 0.9 3.61
3 3.52 0.15 3.37 0.9 3.03
4 3.71 0.15 3.55 0.9 3.19
5 3.82 0.12 3.68 0.9 3.31
6 3.52 0.14 3.38 0.9 3.04
7 3.61 0.16 3.45 0.9 3.10
8 3.64 0.15 3.49 0.9 3.14
9 3.58 0.14 3.43 0.9 2.53
10 3.43 0.15 3.28 0.9 2.38
Score Range (1-50) Adjusted cut-off = 30.43; Score Range (1-50) Crude mid-value = 25.
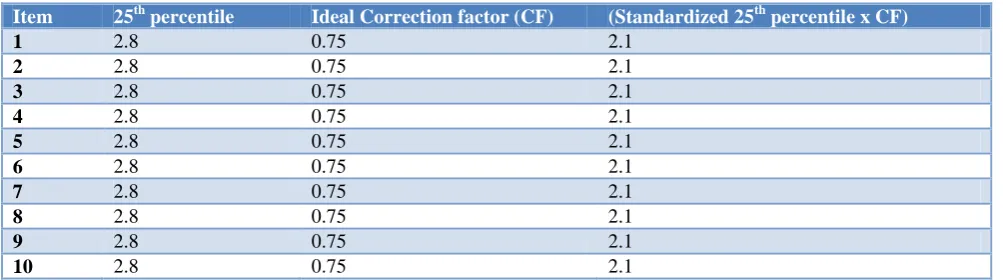
Table 4: Calculation of cut-off value for a psychometric scale for selfie addiction among standardized population. Item 25th percentile Ideal Correction factor (CF) (Standardized 25th percentile x CF)
1 2.8 0.75 2.1
2 2.8 0.75 2.1
3 2.8 0.75 2.1
4 2.8 0.75 2.1
5 2.8 0.75 2.1
6 2.8 0.75 2.1
7 2.8 0.75 2.1
8 2.8 0.75 2.1
9 2.8 0.75 2.1
10 2.8 0.75 2.1
Score range = (10-50) Adjusted cut-off value = 21; Score range =(10-50) Crude Mid-value = 25.
The cut-off value for standardized population is calculated by multiplying the standardized 25th percentile and correction factor (Table 4).
RESULTS
Using the above explained method, the cut-off value for a content validated psychometric selfie addiction scale, was
Mean and the 2 standard error of mean (2 SEM) calculated for individual items and their difference was multiplied with correction factor (0.9) to derive the individual item cut off. This individual item cut-off values are summated to determine the total adjusted scale cut-off, which came as 30.43(rounded as 30). The cut-off value based on crude mid-value is 25, which is the crude cut-off value (Table 3).
For the standardized population, the 25th percentile in the 5 point scored scale came as 2.8. The ideal correction factor 0.75, is multiplied with the 25th percentile to obtain individual item cut-off. All the item cut-off is summated to obtain a cut-off value for the standardized population, which came as 21 (Table 4).
DISCUSSION
Our study has focused on deriving a cut off value for the psychometric scale on selfie addiction. The item analysis is explained in the tables given in the results. In order to arrive at the cut off values the author has adapted the steps, which was published by previous articles. So to determine the cut off value, first the individual items in the likert scale was given equal weightage by 6 content experts. In the second step, the weightage of each response in each item was considered to be directly proportional to the Discrimination Index (DI) as well as
Internal Reliability or Cronbach’s alpha. Item
discrimination index, measures the effectiveness of an item in discriminating between high and low scores on the whole test. The discrimination index, D, is the number of people in the upper group who answered the item correctly minus the number of people in the lower group who answered the item correctly, divided by the number of people in the upper group. The higher DI indicates more effective the item is. Value of 0.30 and above is required to consider an item acceptable.10In the present study, it was found that, all the items in the questionnaire had a discrimination index value of >0.75, indicating that each item in the 10 item psychometric scale questionnaire is effective. The importance of item analysis is well explained in a study conducted at Ahmedabad, for assessing MCQ’s given for community medicine exams, indicating that, item analysis not only helps to determine the cut-off value, but extends its use in identifying the standard of question paper in medical education.11
The index of reliability of the underlying construct is determined by Cronbach's alpha.12,13 Thus, the weighted score for each response in each item is obtained by getting the Observed Item Score multiplied by the product of Discrimination Index and Internal Reliability or Cronbach’s alpha. When internal consistency or Cronbach’s alpha is more than 0.7, it is considered to be acceptable. A low value of alpha could be due to low number of questions or poor item inter-relatedness. The maximum alpha value recommended is 0.9.In the present study having obtained the Cronbach’s alpha value of 0.76, makes the questionnaire reliable. Values higher than
that, suggests that some items are redundant and they are testing the same question in different guise.14 Correction Factor is identified for making an adjustment in the overall cut-off value of the instrument. It is obtained from the ratio of the total weighted score and the total raw score. The overall cut-off value for the instrument is obtained by multiplying the “Correction Factor” with the [Median of individual Raw Score – 25th percentile of Interquartile Range (IQR)] of each item and finally summing them up together.8
In the present study, the cut-off value determined for selfie addiction scale is 30.43, rounded to 30. Being an ordinal scale with positive questions, those participants who have obtained a cut-off value of >30 are considered to be a selfie addict, and those who have obtained a total score ≤30 are considered to be normal (without selfie-addiction). The Cronbach’s alpha of 0.76 and Correction factor of 0.9, suggests the cut-off value to be highly valid for the study population.
Similar study was conducted to determine an adjusted cut-off value for study population on WHO validated QOL assessment instrument. Where the universal cut-off value was 13 (based on the crude mid-value) and the readjusted cut-off value was 9.2, for study population of different socio-demographic population, indicating that re-adjustment of cut-off values is essential to take care of the heterogeneity among study population.8,9
Similarly, in a multi-centric study, adjusted cut-off value was used to determine the diagnostic yield, to suspect Pulmonary Embolism (PE) in emergency department. According to the study findings, it was concluded, that D-dimer level higher than 500 μg/l but below the age-adjusted cut-off ruled out the diagnosis of pulmonary embolism.15 This study explains the usage of cut-off value determination in clinical practice.
CONCLUSION
Any study tool with ordinal values, becomes an effective tool for survey, only when proper cut-off value is determined for the specific study population following the standard procedure as above. Present study is one of its kind, in determining the cut-off value for a content validated psychometric scale without any gold standard. With the calculated Cronbach’s alpha, discrimination index and the correction factor value, which is above 0.75, the scale is considered to be appropriate for the study population.
Funding: No funding sources Conflict of interest: None declared
Ethical approval: The study was approved by the Institutional Ethics Committee
REFERENCES
1. David JR. Encyclopedia of Behavioral Medicine.
2. Shi J, Mo X, Sun Z. Content validity index in scale development. J Cent South Univ (Med Sci). 2012;37(2):152-5.
3. Lawshe CH. A quantitative approach to content
validity. Personnel Psychology. 1975;28:563-75.
4. Mussio SJ, Smith MK. Content validity: A
procedural manual. International Personnel
Association, Chicago; 1973.
5. Balaji A, Saranya N. Validation of Psychometric Scale on Selfie Addiction. Int J Contemp Med Re¬s. 2015;2(4):941-6.
6. IRA/NCTE Joint Task Force on Assessment.
Standards for the assessment of reading and writing. Newark, DE: International Reading Association and Urbana, IL: National Council of Teachers of English; 1994.
7. Chestnut Hill, MA: National Commission on
Testing and Public Policy, Boston College; 1990. 8. Ankur B. Methods for decision-making in survey
questionnaires based on likert scale. J Asian Sci Res. 2013;3(1):35-8.
9. Ankur B, Kumaraswamy K, Biswadeep D, Kumar
SG, Rohit KV, Sami ARA. A Tool for Decision-Making in Norm-Referenced Survey Questionnaires with Items of Ordinal Variables. Int J Collaborat Res Internal Med Pub Health. 2014;6(3):52-63.
10. Wood DA. Test construction: Development and
interpretation of achievement tests. Columbus CE. Merrill Books; 1960.
11. Sanju G, Rashmi S, Manish R. Item and test
analysis to identify quality multiple choice questiona (MCQs) from an assessment of medical students of Ahmedambad, Gujarat. Indian J Comm Med. 2014;39(1):17-20.
12. Rourke O, Norm, Hatcher LA. Step-by-step
approach to using the SAS(R) system for factor analysis and structural equation modeling. North Carolina; 2013.
13. Righini M, Van Es J, Den Exter PL, Roy PM, Verschuren F, Ghuysen A, et al. Age-Adjusted D-Dimer Cutoff Levels to Rule Out Pulmonary
Embolism The ADJUST-PE Study. JAMA.
2014;311(11):1117-24.
14. Cronbach LJ. Coefficient alpha and the internal structure of tests. Psychometrika. 1951;16:297-334.
15. Mohsen T, Reg D. Making sense of
Cronbach’salpha. Int J Med Edu. 2011;2:53-5.
Cite this article as: Arumugam B, Suganya E,