Available online on 15.06.2019 at http://jddtonline.info
Journal of Drug Delivery and Therapeutics
Open Access to Pharmaceutical and Medical Research© 2011-18, publisher and licensee JDDT, This is an Open Access article which permits unrestricted non-commercial use, provided the original work is properly cited
Open Access
Research Article
Formulation and Characterization of Transdermal Patch of Candesartan
Celexitil
Hira Shabnam*
1, Dua Jagdeep Singh
1, Prasad D.N.
2, Puri Anchal
1, Kaushal Sahil
1 1 Department of Pharmaceutics, Shivalik College of Pharmacy Nangal, Punjab, India2 Department of Chemistry, Shivalik College of Pharmacy Nangal, Punjab, India
ABSTRACT
The aim of the present study is to formulate and characterized the transdermal patch of Candesartan celexitil. The objective is study was to increase the bioavailability of drug. In the present study, transdermal patch of Candesartan celexitil were prepared by solvent casting technique employing HPMC cps 50 polymer and glycerin as plasticizer using mercury as substrate. Total thirteen formulation (F1-F13) were prepared having drug and polymer ratio (1:2, 1:4, 1:6, 1:8, and 1:10). From the selected batch F2 containing drug polymer ratio (1:4), four formulations each were prepared and evaluated containg drug urea (1-4%) and oleic acid (1-4%) as permeation enhancer. The prepared transdermal patches were evaluated on the basis of different parameters like weigh, thickness, folding endurance, percent moisture absorption, percent moisture loss, drug content uniformity, in vitro skin permeation study. The fabricated final transdermal patches were further subjected to in vitro permeation study. In order to confirm the exact mechanism of drug release from all the patches, the data were computed and graphed according to Korsmeyer equation. Diffusion exponent of release process controlled by Super case Ⅱ transport Non- Fickian diffusion, n values of Korsmeyer- Peppas model shows a combination of diffusion and dissolution mechanism indicating the drug release from the formulation was controlled by more than one process. It was concluded that the prepared formulation F13 (4% w/v of oleic acid) showed highest cumulative percent drug release and increase the bioavailability of the drug.
Keywords:Novel drug delivery system, Transdermal drug delivery, Transdermal drug delivery system,Differential scanning calorimetry.
Article Info: Received 25 April 2019; Review Completed 30 May 2019; Accepted 01 June 2019; Available online 15 June 2019 Cite this article as:
Hira S1, Dua JS, Prasad DN, Puri A, Kaushal S,Formulation and Characterization of Transdermal Patch of Candesartan
Celexitil, Journal of Drug Delivery and Therapeutics. 2019; 9(3-s):255-262 http://dx.doi.org/10.22270/jddt.v9i3-s.3001
*Address for Correspondence:
Hira Shabnam, Department of Pharmaceutics, Shivalik College of Pharmacy Nangal, Punjab, India
INTRODUCTION
Novel drug delivery is development friendly dosage form of various formulations with the ultimate aim of increasing their dosing connivance to the patient. The NDDS may involve a new dosage form eg. From thrice a day dosage to once a day dosage form or developing a transdermal patch in
place of other drug formulation 1. Today about 74% of drug
are taken orally and are found not to be as effective as desired Transdermal drug delivery offers an attractive alternative to the oral administration and injection. With the creation of current time pharmaceutical dosage form, transdermal drug delivery system is recognized itself as an
important part of NDDS 2. Transdermal dosage forms, still a
costly alternative to conventional formulation, are becoming popular because of their exclusive advantages improved bioavailability, extra uniform plasma level, controlled absorption, painless and reduced side effects easy application and flexibility of terminating drug administration by simple removing the patch to the skin are the some of the
potential advantages of TDD 3. Oral dosage form like tablets
and capsules are most widely used drug delivery system but dosage forms face problem of destruction of drug by gastric acid and digestive juices, irritation to gastric mucosa (nausea and vomiting), effect too slow for emergency, and unable to use in unconscious patient. Oral route has many further problems like unpleasant taste of some drugs, odor and color. TDDS patches drug are used by continuous release so they show their effect for exact duration and Transdermal
patch is non-irritating and noninvasive technique 4.
Present study was aimed to increase the bioavailability of drug. Candesartan celexitil was chosen as a model drug for study since it posses near ideal characterstics that a drug must have in formulating a transdermal drug delivery such as high lipid solubility, low molecular weight, effective in low concentration.
and kidney problems. Candesartan belongs to angiotensin receptor blockers (ARBs) class of drugs. It works by selectively blocks the binding of angiotensin II to AT1 in many tissues including vascular smooth muscle and the adrenal glands. This inhibits the AT1-mediated vasoconstrictive and aldosterone-secreting effects of angiotensin II and results in
an overall decrease in blood pressure 5.
MATERIAL
Candesartan celexitil was obtained as gift sample from Aurobindo Pharma Ltd., Hyderabad. Other material such HPMC cps50, Alcohol, Glycerine, Dichloromethane, Chloroform, Sodium hydroxide, Sodium chloride, n- octanol, Methanol, Potassium dihydrogen phosphate was provide by institute.
METHOD
In the present study matrix type patch of Candesartan
Celexitil was prepared by solvent casting method using mercury substrate and evaluated for various parameters. Monolithic transdermal systems of candesartan celexitil were prepared as per formulae given in table 1. Selected polymer ration of HPMC cps50 was dissolved completely in casting solvent Dichloromethane, chloroform & alcohol in ratio 2:2:1. The solutions were stirred for 20 min using magnetic stirrer. Glycerin (50% w/w of polymer) as plasticizer and urea and oleic acid used as permeation enhancer in different concentration was added to beaker’s solution. Specific quantity of drug was respective polymer solution. The solution were stirred and poured within a glass bangle placed on mercury surface in a petridish. The rate of evaporation of the solvent was controlled by inverting funnel over the petridish. After 24hrs, the dried film was taken out and stored in a desiccator for further study.
Table 1: The detail formulae of different monolithic transdermal system containing candesartan celexitil
INGRIDIENTS F1 F2 F3 F4 F5 F6 F7 F8 F9 F10 F11 F12 F13
Plasticizer glycerine
(%w/w) 50 50 50 50 50 50 50 50 50 50 50 50 50
Drug: Polymer 1:2 1:4 1:6 1:8 1:10 1:4 1:4 1:4 1:4 1:4 1:4 1:4 1:4
Urea - - - - - 1% 2% 3% 4% 1% 2% 3% 4%
Oleic acid - - - - - 1% 2% 3% 4% 1% 2% 3% 4%
Casting Solvent 2:2:1 2:2:1 2:2:1 2:2:1 2:2:1 2:2:1 2:2:1 2:2:1 2:2:1 2:2:1 2:2:1 2:2:1 2:2:1
Optimization:
Preformulation studies
Preformulation study is defined as the process of optimizing the delivery of drug through determination of physicochemical properties of the active compound that could affect drug performance and development of an efficacious, stable and safe dosage form. It describes the process of optimizing the delivery of drug through
determination of physical, chemical properties of drug 6.
Physical Appearance
Physical appearance of drug was noted by visual observation.
Fourier Transform Infra-Red Spectroscopy (IR)
IR study was performed for identification and structural analysis of the procured drug using Perkin Elmer Fourier
transformed infrared spectroscopy 7. The potassium bromide
(KBr) disk technique was employed using 100mg of spectroscopy grade dried KBr. KBr was ground into fine powder using a mortar/ pestle and compressed into disc under a hydraulic pressure at 10,000psi. Candesartan was placed on the KBr disc with the help of capillary tube. Each
KBr disc was scanned 32 times in the region of 4000-400cm-1
and characteristic bands were recorded.
Absorption maxima ( max)
A UV absorption maxima of drug was determined by
scanning (10 g/ ml) solution of drug in 7.4 phosphate buffer
between 200-400nm.
Standard curve of Candesartan Celexitil
Candesartan Celexitil (50mg) was dissolved in 10 ml of 7.4 phosphate buffer in a 50 ml volumetric flask and the volume was making up to 50ml with the same to obtain a stock
solution of 1000 g/ml. 25ml of this solution was diluted to
100ml with 7.4 phosphate buffer in 100ml volumetric flask
to obtain stock solution of 250 g/ml. From this stock
solution, aliquots of 1, 2, 3, 4, 5, 6, 7, 8, 9, 10 ml were taken and transferred to 10ml volumetric flasks and volume was made up to 10ml with 7.4 phosphate buffer. The absorbance of this solution was measured at 254nm using 7.4 phosphate buffer as blank. The calibration curve was plotted between concentration and absorbance.
Partition coefficient
Partition coefficient is an indicator of lipophilic or hydrophobic nature of drug molecule. The partition coefficient of a substance between n-octanol and water is
referred to as Po/w, which corresponds to the negative
logarithm of the ration of the concentration of the substance ninth aqueous and hydrophobic phase. Log P is the ratio of drug dissolved into immiscible solvent s, most commonly water and n-octanol that are in equilibrium. Log P is
applicable to unionized compound 8.
Differential scanning calorimetry (DSC)
DSC thermograms of pure drug (candesartan celexitil) and its physical mixture with additives (HPMC and PVP K-30) were carried out to investigate any possible interaction between the drug and the utilized additives. The selected heating rate was from 50℃ to 300℃ at an increase of 5℃ per
minute using Perkin Elmer 6 DSC 9.
Evaluation of Prepared Transdermal Patch
Physical appearance
All the transdermal films were visually inspected for color,
clarity, flexibility and smoothness 10.
Weight uniformity
The dried film was weighed on Afcoset digital balance. The
Thickness uniformity
Film thickness was measured by screw guage (Mituttoyo Japan) at five different random points on the film. The
average of five observations was taken 12.
Folding Endurance
The folding endurance was expressed as the number of folds or number of times the film was folded at the same place either to develop visible cracks or to develop visible cracks. This was important to check the ability of sample to withstand folding. This also gives an indication of brittleness
13.
Drug content uniformity
Candesartan Celexitil film of 1 sq.cm was cut into small pieces and transferred into 100ml volumetric flask. 25ml of methanol was added and shaken for 4 hrs to extract the drug .Finally, suitable dilution were made using phosphate buffer of pH 7.4 and the absorbance was measured at 254 nm using
UV spectrophotometer 14.
Percentage moisture content
Individually weighed patches are kept in the desiccator having fused calcium chloride at room temperature for 24 hrs. After 24 hrs the patches are to be reweighed and percentage moisture content is calculated by the formula:
% Moisture content
In vitro permeation through the goat skin:
Prepration of the goat skin
The experiment was carried out by using goat abdominal skin obtained from the local slaughter house and stored at -20℃. The hair of test animal were carefully trimmed short with the pair of scissors and to remove any skin content skin was shaved using a hard razor to removed subcutaneous
tissue. The epidermis was washed with water and used 15, 16.
Permeation studies
In vitro release studies were performed in a modified Franz diffusion cell over a period of time 24hrs. The above skin was mounted on the diffusion cell and receiver compartment was filled with 20 ml phosphate buffer of ph 7.4 and the temperature was maintained 37℃ with the help of circulating water bath. The samples were withdrawn at appropriate time interval (replaced with 2 ml of fresh buffer to maintain sink condition) and their concentration were
measured at 254 nm using UV-spectrophotometer 17.
Kinetics Modeling of Drug Dissolution Profiles
To analysis the in vitro release data various kinetic models were used to describe the release kinetic. The dissolution profile of the all formulations was fitted to higuchi and Korsmeyer – Peppa’s model to ascertain the kinetic modeling
of the drug release and mechanism of drug release 18.
Zero Oder kinetics (Constant rate process)
Drug dissolution from pharmaceutical dosage forms that do not disaggregate and release the drug slowly can be represented by following equation.
Ft= Kot
Where ft is the fraction of drug dissolved in time t and Ko is
zero order release constant.
Pharmaceutical dosage form following this profile release the same amount of drug by unit of time and this is ideal method of drug release in order to achieve a pharmacological prolonged action. The following relation can in a simple way express this model.
Qt= Qo + Kot
Where, Qt is the amount o drug dissolved in time t, Qo is
initial amount of drug in solution and Ko is zero order release
rate constant. Most of the time Qo = 0.
First order kinetics (Linear kinetics)
Rate is directly proportional to the concentration, of drug undergoing reaction i.e. greater the concentration, faster the reaction. The drug dissolution study was first proposed by Gibaldi and Feldman in 1967. The following relation in a simple way can be expressed as
In (Qt/Qo) = K1t
or in decimal logarithm.
Log Qt= log Qo- K1t/2.303
Where, Q1 is amount of drug dissolved in the time t, Qo is
initial amount of drug in solution and K1 is first order release
rate constant. In this way a graphic of decimal logarithm of the release amount of drug versus time will be linear.
Higuchi model
Higuchi described the release of drug insoluble matrix as a square root of time dependent processes based on Fickian diffusion. A large number of modified release dosage form contain some sort of matrix system. In such instance, the drug dissolved from the matrix. The dissolution pattern of the drug is dictated by water penetration rate (diffusion controlled). In higuchi model, a plot of % drug release versus square root of time is linear.
Q= Kh t1/2
Where, Kh is constant, t is time.
Korsmeyer- Peppas model
To find the mechanism of drug release, drug release data was fitted in Korsmeyer –Peppas model, log of % cumulative drug release versus log of time.
Mt/M∞= Ktn
Where, Mt/M∞ is fraction of drug released at time t and K is rate constant, n is release exponent.
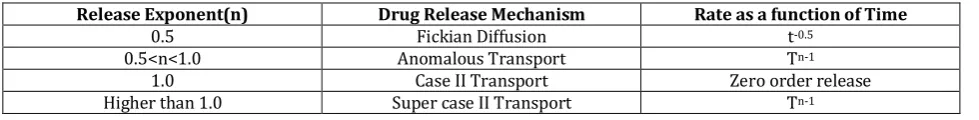
Table 2: Interpretation of diffusion release mechanism from polymeric film
Release Exponent(n) Drug Release Mechanism Rate as a function of Time
0.5 Fickian Diffusion t-0.5
0.5<n<1.0 Anomalous Transport Tn-1
1.0 Case II Transport Zero order release
RESULT AND DISCUSSION
Physical Appearance and Melting point
Sample of Candesartan Cilexetil was white to off white to off white powder with a melting point of 170℃± 0.5℃ which
was accordance with the literature value and this was also confirmed by DSC (shown in figure 1,2) also. This confirm the authentically and purity of drug.
Fig1: DSC of pure drug (Candesartan Celexitil)
Fig 2: DSC of drug with exciepient
Fourier Transform Infra-Red Spectroscopy
The FT-IR spectrum of drug and drug with excipient was showed in Figure- 3, Figure- 4.
Figure 4: FT-IR spectrum of drug with exciepient.
Absorption maxima ( max)
The absorption maximum ( max)Candesartan Cilexetil was
found to be 272nm (fig. 5) and the spectrum has been found shown in fig.6. In the UV analysis, we considered the broad peak with maximum absorbance.
Figure 5: UVSpectrum of Candesartan Cilexetil
Figure 6: Representative max of Candesartan Celexitil
Standard curve of Candesartan Cilexetil in Phosphate buffer
Figure 7shows the calibration curve of Candesartan Cilexetil
in 7.4 phosphate buffer at 254nm ( . Linearitywas
obtained in a range from 1-10 g/ml with R2 value of 0.982.
Figure 7: UV Spectrum of Candesartan Cilexetil Partition coefficient
A drug solution of 1mg/ml was prepared in n-octanol. It was in a separating funnel and shaken with an equal volume of water (aqueous phase) for 10 min and allowed to stand for two hrs. Then aqueous phase and organic phase were collected separately and centrifuged at 2000rpm. Both the phase was analyzed for the drug concentration using U.V. spectrophotometer. Partition coefficient was calculated by taking the ration of the drug concentration in n-octanol to the drug concentration I aqueous phase. Average of triplicate reading was taken. The partition coefficient of CC was found to be 3.96.
Physical appearance
The prepared patches were found to be uniform flexible, smooth and homogenous.
Weight uniformity
The mean weight of all the prepared batches in the ranges of 0.234- 0.917.
Thickness uniformity
The thickness of the prepared batch are in the range of 0.12- 0.29.
Folding Endurance
The folding endurance of CC patches are 276- 301.
Drug content uniformity
All the patches were found to have the drug content in the range of 66%- 96%.
y = 0.0178x + 0.0574
R² = 0.982
0 0.05 0.1 0.15 0.2 0.25
0 2 4 6 8 10 12
Ab
so
rb
an
ce
Concentration (µg/ml)
Standard curve of candesartan celexitil
Table 3: Evaluation of Prepared Transdermal Patch Formulation
Code Weight (gm) Thickness (mm) moisture content Percentage endurance Folding Drug Content (%)
F1 0.234 0.25 1.47 282 72%
F2 0.255 0.22 1.92 291 79%
F3 0.294 0.20 2.01 276 64%
F4 0.335 0.29 2.51 295 68%
F5 0.338 0.29 2.73 301 66%
F6 0.905 0.21 0.29 292 87%
F7 0.911 0.19 0.43 304 82%
F8 0.902 0.17 0.58 290 85%
F9 0.907 0.18 0.82 285 88%
F10 0.915 0.12 0.32 298 83%
F11 0.899 0.19 0.52 287 89%
F12 0.914 0.20 0.38 292 92%
F13 0.917 0.15 0.24 289 96%
Zero Oder kinetics (Constant rate process)
Zero order plot of Formulation F10- F13 shown in figure -8.
Figure 8: Plot of Cumulative Percent Drug Permeated versus Time for formulation F10-F1
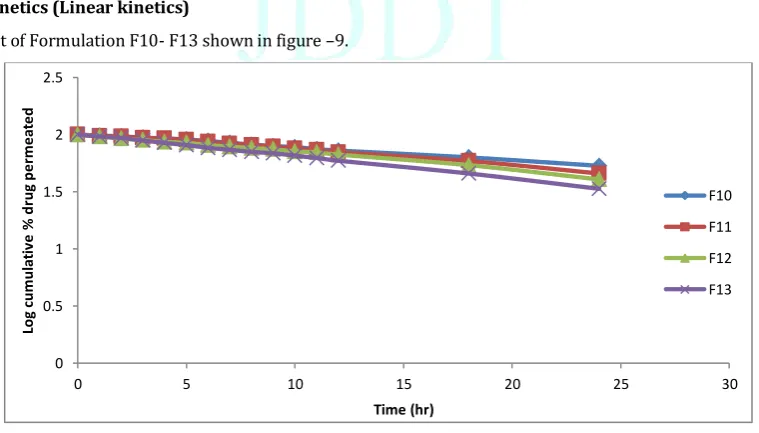
First order kinetics (Linear kinetics)
First order plot of Formulation F10- F13 shown in figure –9.
Figure 9: Plot of Log Cumulative Percent Drug Permeated versus Time for formulation F10-F13 0
10 20 30 40 50 60 70 80 90 100
0 5 10 15 20 25 30
C
u
m
u
la
ti
ve
%
d
ru
g
p
e
rm
e
at
e
d
Time (hr)
F10
F11
F12
F13
0 0.5 1 1.5 2 2.5
0 5 10 15 20 25 30
Lo
g
cu
m
u
la
ti
ve
%
d
ru
g
p
e
rm
e
at
e
d
Time (hr)
F10
F11
F12
Higuchi model
Higuchi model plot of Formulation F10- F13 shown in figure- 10.
Figure 10: Plot of Cumulative Percent Drug Permeated versus Square root time for Formulation F10-F13
Korsmeyer- Peppas model
Korsmeyar – Peppas model plot of Formulation F10- F13 shown in figure- 11.
Figure 11: Plot of Log Cumulative Percent Drug Permeated versus Log time for Formulation F10-F13
CONCLUSION
From the study it was concluded that the formulation F13 which contained Oleic acid as permeation enhancer showed best result as compared to urea as permeation enhancer as there was an increase in the drug release to maximum extent in the final formulation (F13) containing Oleic acid. Physicochemical parameters of all the 13 formulation remained uniform with low SD values. High folding endurance revealed that the prepared patch have good flexibility. All the formulation were analyzed quantitatively to describe kinetics of drug release from patches using zero order, First order, Higuchi, Korsmeyar- Peppas model to determine the release profile and release mechanism. It was
observed from the R2 values for the release of drug from this
formulation was governed by diffusion controlled process. Further, it was ascertained that the drug release from formulation could follow zero order kinetics. In order o confirm the exact mechanism of drug release from the patches, the data were computed and graphed according to Korsmeyer equation. Diffusion exponents of release process controlled by Non- Fickian diffusion, n values of Korsmeyer-
Peppas model shows a combination of diffusion and dissolution mechanism indicated the drug release from the formulation was controlled by more the one process. All the
R2 values of Peppas model confirmed that the drug transport
mechanism was Non- Fickian Super case II transport. Stability studies on optimized batch i.e. F13 were performed at Accelerated (40℃/75% RH) conditions. The physical stability of Candesartan Celexitil patches proved to be unchanged after storage up to 2 months under accelerated condition at 40℃/75% RH. This dosage form also shows improves patient compliance due to simplified therapeutic regimen and comfort via non- invasive, painless and simple application.
ACKNOWLEDMENT
The authors are thankful to the Shivalik College of Pharmacy for providing the good guidelines and support for work.
CONFLICT OF INTEREST
The authors report no conflicts of interest.
0 10 20 30 40 50 60 70 80 90 100
0 1 2 3 4 5 6
C
u
mu
la
ti
ve
%
d
ru
g
p
e
rme
at
e
d
Sq root of Time (hr0
F10
F11
F12
F13
0 0.5 1 1.5 2 2.5
-0.2 0 0.2 0.4 0.6 0.8 1 1.2 1.4 1.6
Lo
g
cu
m
u
la
ti
cv
e
%
d
ru
g
p
e
rm
e
at
e
d
Log Time
F10
F11
F12
REFERENCES
1. Jain DK, Darwhekar GN, Chaurasia S. Formulation and development and Evaluation of Transdermal Patches of Losartan. Int. J. Pharm Tech Res. 2012; 4(2):757-764.
2. Hardainiyan S, Nandy BC, Jasuja ND, Vyas P, Raghav PK. A Review; on the recent innovation in transdermal drug delivery for Herbal therapy. J. of Bio. And Pharm. Res. 2014; 3(3):88-101. 3. Ahmed A, Karki N, Charde R, Charde M , Ganghare B. Transdermal drug delivery system an Overview. Int. J. Biomed. Adv. Res. 2011; 38-56.
4. Patel A, Visht S, Sharma PK. Transdermal Drug Delivery system, Next Generation Patches . J. Drug discov. Del. 1:43-65.
5. Tripathi KD. Essentail of medical pharmacology. 7th ed., New
Delhi. Jaypee Publisher Ltd. 2008:639.
6. Allen LV. Dosage form design and development. Clinical Therapy. 2008; 30(11):2102-2111.
7. Samanta MK, Dube R, Suresh B. Transdermal drug delivery system of haloperidol to overcome self induced extrapyramidal syndrome. Drug Dev. Ind. Pharm. 2003; 29:405-415.
8. Leeson PD, Springthore B. The influence of drug- like concepts on decision-making in medical chemistry. Nature Rev. Drug Discov. 2007; 6:881-890.
9. James EF Reynolds. Martindle the extra pharmacopoeia. 28th ed.
London: The Pharmaceutical Press; 1982.
10. Longanathan V, Senthilkumar B, Reddy MVS, Sreekanth N, Ubaidulla U. Compatibility studies between oflaxacin tablet excipinet through differential scanning calorimetry. Int. J. Pharm. Excip.2003; 2(3,4):661-64.
11. Kalvimoorthi V, Rajeshkaran M, Rajan VS, Balasubramani KP, Kumar PS. Transdermal drug delivery system: An over review. Int. J. Pharm. Chem. Sci. 2015; 4(1):89-101.
12. Samanta MK, Dube R, Suresh B. Transdermal drug delivery system of haloperidol to overcome self induced extrapyramidal syndrome. Drug Dev. Ind. Pharm. 2003; 29:405-415.
13. Jamakandi VG, Mulla JS, Vinay BL, Shivakumara HN. Formulation characterization and evaluation of matrix - type transdermal patch of model antihypertensive drug. Asian J. Pharm. 2009; 3(1):59-64.
14. Raghavendra K, Ali M, Doddayya H, Dr. Marshal SC, Patil CC, Habbu PV. Comparitive evaluation of polymeric films for transdermal application. The Eastern Pharmacist 2000; XLIII (516):109-111.
15. Patel NB, Sonapal RN, Mohan S, Selvaraj S. Formulation and evaluation of Intophoretic transdermal delivery of Diltiazam Hydrochloride. Int. J. Res. Pharm. Sci. 2010; 1(3):338-344. 16. Kusam DV, Saisivam S, Maria GR, Deepti PU. Design and
evaluation of matrix diffusion controlled transdermal patches of verapamil hydrochloride. Drug Dev. Ind. Pharm. 2003; 29(5):495-503.
17. Flynn GL, Durrhein H, Huguchi WI. Permeation through hairless mouse skin II: membrane sectioning techniques and influence on alkanols permeabilities. J. Pharm. Sci. 2003; 70(1):52-56. 18. Singh S, Bakshi M. Guidence on the conduct of stress tests to