Bampouras, Theodoros, Marrin, Kelly, Sankey, Sean P. and Jones, Paul A. (2014) Test-retest reliability and sensitivity of the Concept2 Dyno dynamometer: practical applications. Journal of Strength and Conditioning Research, 28 (5). pp. 1381-1385.
Downloaded from: http://insight.cumbria.ac.uk/id/eprint/1647/
Usage of any items from the University of Cumbria’s institutional repository ‘Insight’ must conform to the following fair usage guidelines.
Any item and its associated metadata held in the University of Cumbria’s institutional repository Insight (unless stated otherwise on the metadata record) may be copied, displayed or performed, and stored in line with the JISC fair dealing guidelines (available here) for educational and not-for-profit activities
provided that
• the authors, title and full bibliographic details of the item are cited clearly when any part of the work is referred to verbally or in the written form
• a hyperlink/URL to the original Insight record of that item is included in any citations of the work
• the content is not changed in any way
• all files required for usage of the item are kept together with the main item file.
You may not
• sell any part of an item
• refer to any part of an item without citation
• amend any item or contextualise it in a way that will impugn the creator’s reputation
• remove or alter the copyright statement on an item.
The full policy can be found here.
1
Manuscript number: R- 347412
Revision 1
TITLE PAGE
Title:
Test-retest reliability and sensitivity of the Concept2 Dyno® dynamometer: practical
applications
Brief running Head:
Test-retest reliability of Concept2 Dyno
Authors:
Theodoros M. Bampouras, MSc1 , Kelly Marrin, MSc, PhD2, Sean P. Sankey, MSc, CSCS3,
and Paul A. Jones, MSc, CSCS4
Departments:
1 Faculty of Health and Wellbeing, Sport and Physical Activity
2 Department of Sport and Physical Activity
3 Faculty of Advanced Engineering and Sciences
4 Centre for Rehabilitation and Human Performance Research
Institutions
1 University of Cumbria
2 Edge Hill University
3 University of Bolton
4 University of Salford
Corresponding author: Theodoros M. Bampouras, Faculty of Health and Wellbeing, Sport
and Physical Activity, University of Cumbria, Bowerham Road, Lancaster, LA1 3JD, United
2
BLIND TITLE PAGE
Title:
Test-retest reliability and sensitivity of the Concept2 Dyno® dynamometer: practical
3
ABSTRACT
Strength assessment is often part of the objective periodical observation of teams, squads or
large groups of athletes. Equipment that provides assessment that is mobile and is easy to use
will reduce the impact on the athletes training and competitive calendar. However, any
equipment used must be reliable to allow accurate monitoring of performance. The aim of
this study was to examine the reliability of the Concept2 Dyno® dynamometer. Forty-six
competitive athletes (males: n=36, age 23.3±6.8 years, height 1.80±0.09 m, body mass
82.3±15.6 kg; females, n=10, age 20.7±1.4 years, height 1.65±0.09 m, body mass 62.7±11.8
kg), with a strength training background of more than 2 years, performed a familiarisation
session and three experimental sessions with one week intervening each. Each experimental
session consisted of three maximal efforts of seated chest press (CPress), seated row (SRow),
and seated leg press (LPress) exercises. Reliability was assessed examining systematic bias,
intraclass correlation coefficient (ICC), coefficient of variation (CV) and 95% limits of
agreement (95%LoA) between sessions. No systematic bias was found for any of the
exercises. ICC were high (0.89–0.98) with relatively low CV (6.2%-4.3%). Finally, 95%LoA
indicated that subsequent testing could underestimate by a factor of 0.87 or overestimate by a
factor of 1.17, on average. These results indicate that Concept2 Dyno® dynamometer is
reliable and can be used in the field to efficiently monitor strength performance. Coaches and
researchers should use ‘analytical goals’ to help decide as to the use of Concept2 Dyno® for
their purposes.
4
INTRODUCTION
Strength testing is a commonly utilised procedure to monitor adaptations to training
interventions (7,9,13,18) or to provide an indication of any muscular weaknesses (7,11).
Various methods have been used to assess strength, including isokinetic dynamometers (e.g.
11), force platforms (e.g. 18) or weights (e.g. 9). Technological developments have resulted
in portable dynamometers, enabling strength testing to be conducted in the field, allowing
higher test efficiency and functionality (3,15,21).
One portable dynamometer that allows assessment of three common multi-joint exercises
(chest press, seated row and leg press) is the Concept2 Dyno®. The Concept2 Dyno® consists
of an air-resisted flywheel, which responds to the user’s efforts. The resistance can be
manipulated by eight damper levers which control the air flow and increase the air resistance
with more dampers open. The user adapts a seated position for all three exercises with their
back (for the leg and chest press) and chest (for the seated row) supported. These positions
mimic the position an individual would adapt to perform the abovementioned exercises in the
respective exercise equipment.
The portability of the equipment, the familiarity of the design as well as the familiarity of the
three exercises for people that do some resistance exercise, makes Concept2 Dyno® an
appealing solution for strength assessment in the athletes own space. Indeed, this
commercially available dynamometer is widely used by athletic clubs and the police force as
5 However, in order for any strength testing to provide accurate and useful information, any
assessment tool must demonstrate valid and reliable measures, additionally ensuring that
changes in performance will be able to be detected (10). A number of studies have examined
the reliability of portable strength testing devices comprising portable force platform (21) and
wireless accelerometer (3), in order to allow for more sport-specific and efficient testing that
would yield more informative results for athletes and coaches (15).
Notwithstanding the wide application of Concept2 Dyno®, such data does not exist for it.
Although the exercises offered by Concept2 Dyno® have logical validity (as they have close
resemblance with established respective exercises), the reliability and sensitivity of these
exercises on Concept2 Dyno® should be examined to offer practical recommendations for
strength assessment. Therefore, the aim of the present paper was to examine the reliability
and sensitivity of the Concept2 Dyno®.
METHODS
Experimental approach to the problem
The reliability and sensitivity of the Concept2 Dyno® was assessed using a repeated measures
design. All subjects were familiar with the exercises (chest press, seated row, leg press)
allowed by the Concept2 Dyno®. All the exercises were performed on three sessions, one
week apart each, following manufacturer’s guidelines and ensuring strict adherence to form.
In addition, a sub-sample consisting of the individuals who were performing the exercises
with maximum resistance, was also analysed in the same way to enable inferences for using
6 differences, intraclass correlation coefficient, coefficient of variation and 95% limits of
agreement between sessions while sensitivity was assessed with the standard error of
measurement.
Subjects
46 competitive athletes (males: n=36, age 23.3 ± 6.8 years, height 1.80 ± 0.09 m, body mass
82.3 ± 15.6 kg; females, n=10, age 20.7 ± 1.4 years, height 1.65 ± 0.09 m, body mass 62.7 ±
11.8 kg) free of any medical conditions or injuries in the 6 months prior to the investigation,
agreed to participate in the study. The subjects competed in sports or events where strength
and power was a significant aspect of successful performance. All subjects trained regularly
with resistance (2-3 times per week) as part of their sport training programme for at least 2
years prior to the experiment. Although not specifically training using the Concept2 Dyno®,
subjects were familiar and have been using the three exercises in their training programmes.
Institutional ethical approval was granted and detailed information regarding the nature and
purpose of the study was provided to prospective participants before they completed
informed consent forms.
Procedures
A repeated measures design was employed to determine the reliability and sensitivity of the
Concept2 Dyno®. Participants attended the laboratory on four separate sessions. The first
session ensured that subjects were familiar with the testing procedures and were able to
maintain safe and controlled technique. The resistance level for each subject for each exercise
7 subject could move without any obvious fluctuations in velocity. Height was recorded to the
nearest 0.01 m using a stadiometer (Harpenden, Burgess Hill, UK) and body mass was
measured to the nearest 0.1 kg utilising calibrated balance scales (Seca, Birmingham, UK).
The three experimental sessions comprised of performing all three exercises of seated chest
press (CPress), seated row (SRow), and seated leg press (LPress). The order of the exercises
and the resistance level for each exercise were maintained the same for all sessions for each
subject. For each exercise, the subjects performed three low-intensity repetitions and,
immediately after, three maximal effort repetitions, according to manufacturer’s guidelines.
Execution form was maintained throughout. For the CPress, the subjects sat in the
dynamometer seat with their back straight and the legs in a comfortable position. The handle
bar was set at the same height as the subject’s sternum. For the SRow, the subject sat in the
dynamometer seat with their back straight and the anterior upper body touching the seat
backrest. The height of the bar was the same as in the CPress. Finally, for the LPress, the
subjects adopted a similar position as in the CPress, with the difference that they held their
body stable by holding handles below the seat. For each effort, the weight ‘pushed’ or
‘pulled’ (in kg) was displayed on the equipment’s screen (Dyno II, Nottingham, UK). The
best score from the maximal effort repetitions was recorded and used for subsequent analysis.
The testing sessions were conducted at similar times of day (± 2hrs) and under similar
environmental conditions, to mediate the confounding effects of circadian rhythms and
environmental influences on performance (2). All testing sessions for each subject took part
within the same training phase. Subjects were instructed to refrain from strenuous exercise in
the 48 hours preceding testing, and to ensure they were adequately hydrated and consumed
8 influence of extraneous variables on their strength performance, thus, enhancing this study’s
internal validity and reliability. One week intervened each experimental session.
Statistical analyses
Descriptive statistics are reported as mean ± SD unless otherwise stated. Normality of data
was examined using the Shapiro-Wilk test and subsequently confirmed. Homoscedasticity of
data was examined and found present for the LPress data, therefore all data was
logarithmically transformed for consistency. Reliability was assessed according to
suggestions by Atkinson and Nevill (1). A repeated measures analysis of variance (ANOVA)
was used to assess systematic bias between the three testing occasions. The intraclass
correlation coefficient (ICC3,1) was calculated from ANOVA statistics (19) as a measure of
relative reliability (the degree at which the subjects maintain their rank in the sample). ICC3,1
was calculated between the first and subsequent sessions to examine whether reliability
improved with more sessions (i.e. session 1 to 2 and session 2 to 3). In addition, coefficient of
variation (CV) and 95% limits of agreement (95%LoA; 4) were calculated as measures of
absolute reliability (the degree of variability in the repeated measures for each individual).
CV was calculated as standard deviation / mean (17) and antilog was taken. Similar to the
ICC3,1, CV and 95%LoA were calculated between the first and subsequent sessions. Finally,
standard error of measurement (SEM) was calculated as standard deviation x square root
(1-ICC) (20).
In addition, the same statistical analysis took place for a sub-sample of subjects (CPress, n =
28; SRow, n = 27; LPress, n = 37) that were able to execute the exercises with the maximum
9 statistical package for social sciences version 16.0 (SPSS Inc, USA). Significance level was
set at P ≤ 0.05.
RESULTS
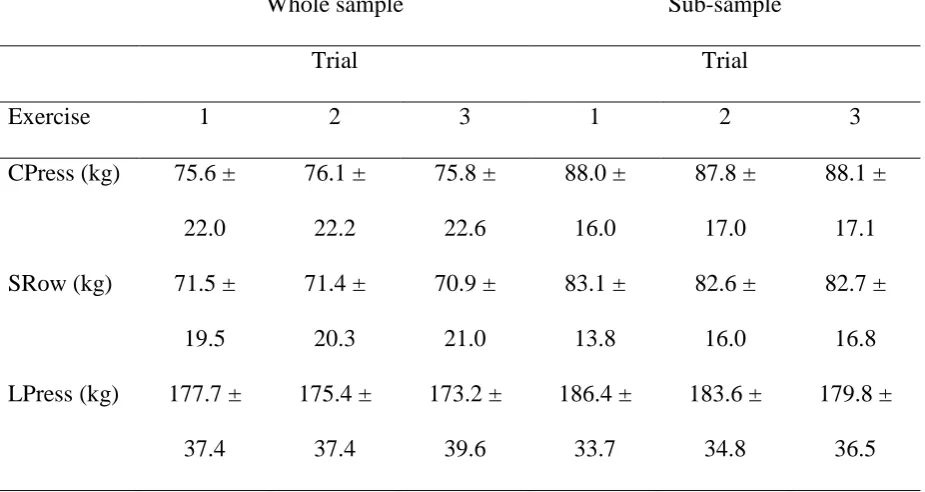
Descriptive statistics of all three exercises and trials for both full and sub-sample can be
found in Table 1. There was no systematic bias present between trials for the logarithmically
transformed CPress (P = 0.784), SRow (P = 0.464) or LPress (P = 0.195) when the whole
sample was considered. Similarly, no systematic bias was present for the sub-sample between
trials for CPress (P = 0.955), SRow (P = 0.799) or LPress (P = 0.61).
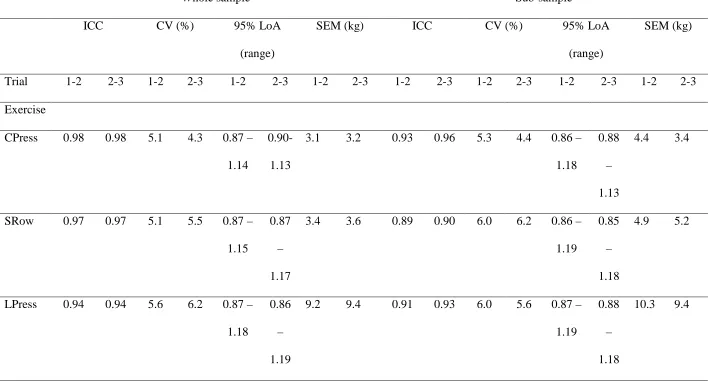
High ICC3,1 (0.89 – 0.98) and low CV (6.2% - 4.3%) values indicated reliable repetition of
performance for all exercises and both sample. 95%LoA ranged was from -15% to 19%.
Finally, SEM values for all exercises indicated reasonable sensitivity for both samples. All
statistics for ICC3,1, CV, 95%LoA and SEM for the whole and sub-samples can be found in
Table 2.
DISCUSSION
The novel finding of the current study was that the Concept2 Dyno® produced acceptably
reliable results on the seated chest press (CPress), seated row (SRow), and seated leg press
(LPress) as indicated by the high ICC for both the whole and the sub-sample (subjects that
utilised maximum resistance). Acceptable sensitivity was demonstrated with both the whole
sample and the sub-sample, with the values produced indicated a small SEM.
10 The ability to assess strength in the field is important as it can be used to evaluate and
monitor progress and subsequently inform training. An important aspect of any
performance-measuring equipment is the ability to reproduce results under the same testing conditions,
thus allowing attributing any observed changes to the training progress. The results of the
current study showed that the Concept2 Dyno® produced similar scores on all three trials for
all exercises for both samples examined in the study, as no bias was present in any of the
above scores.
Various suggestions have been made for the value of ICC that indicates good reliability,
making interpretation of ICC challenging. For example, Fleiss (6) proposed ‘excellent’
reliability with an ICC > 0.75, while Vincent and Weir (20) suggested ‘high’ reliability with
an ICC > 0.90. The results of the current study produced a range of ICC of 0.89 – 0.98,
indicating good to high reliability for all exercises. As with the CV, these high ICC are
comparable with those found for field tests such as the 1 repetition maximum with
chain-loaded bars (ICC 0.93-0.99; 14).
A CV value of 10% has been routinely used as a threshold for consistency in reliability
studies, with lower CV values considered to indicate ‘low’ variability; however, there is a
lack of justification for the use of this value (1). Variability of test-retest with the Concept2
Dyno® dynamometer yielded CV values ranging from 4.3% to 6.2%. These values are
slightly higher than other methods of measuring strength in the field, such as 1 repetition
maximum with chain-loaded bars (CV 2.5%; 14) or an accelerometer to assess loaded squat
jumps (CV 1.8%-3.2%; 3). However, they are still sufficiently low to detect performance
11 antilogs. Although this conversion results in a ratio value, the ratios were sufficiently small to
be presented as percentages, and hence be easier to interpret.
Suggestions towards more sport-specific performance testing have been made (15,17) to
allow for greater similarity to actual performance, and therefore, achieve more meaningful
results (11,15). Notwithstanding the efficiency or specificity of a test, in order to be
meaningful, its sensitivity is a crucial factor (10). Indeed, the ability of muscular function
tests to detect performance changes has been questioned (16). The 95% LoA indicated that
subsequent testing sessions can underestimate, on average, by a factor of 0.87 or
overestimate, on average, by a factor of 1.17 (Table 2). Therefore, any changes in
performance must be outside these limits to indicate progression, or indeed, decrease in
performance. The use of ‘analytical goals’ (1) would help practitioners and researchers in
making decisions as to the use of Concept2 Dyno® for their purposes.
In addition to the above, the SEM scores provide a threshold at which any change in
performance score below the SEM cannot be interpreted as a real change, but rather, as
random variation (e.g. from biological variation) of the test, assisting the coach in making
informed decisions about the an athlete’s improvement. The SEM values identified for both
samples are sufficiently small to make the exercises sensitive enough to detect real changes in
performance. For example, following a 4-week traditional resistance exercise programme,
strength was significantly improved by 23.7% for chest press, 25% for seated row and 25.4%
for leg press (12). These improvements compare favourably with the percent the SEM scores
represent for each exercise (~4% - 4.5% for CPress, ~5% - 6% for SRow, and ~5% - 5.5% for
12 It has been well established that familiarisation of the subjects with the testing procedure, in
order to avoid any variation in performance due to motivation or learning effects, is vital
during any performance testing (10). Indeed, a review of 17 studies with three trials or more
revealed that the CV can be as high as 1.3 times the CV obtained from comparing the
subsequent trials (10). The ratio CV of the raw data (CV of trial 1-2 / CV of trial 2-3)
obtained for the whole sample for CPress, SRow and LPress were 1.2, 0.9 and 0.90,
respectively. Further, the ratio CV for the sub-sample CPress, SRow and LPress were 1.2, 0.
96 and 1.07, respectively. As subjects underwent a familiarisation trial, it appears that a
single session was sufficient to ensure consistent performance between trials. Therefore, we
suggest that one familiarisation trial should be allowed before any assessment takes place in
athletes.
The ability of the athlete to select the resistance level that is most appropriate for them prior
to each exercise must be considered in relation to the practical implications it has. As the
athlete’s ability to generate force changes with training, it is possible that the resistance level
would also need to change, to accommodate increases in strength or power development. For
power development, in particular, the wide range of loads used to produce optimal power (5)
may present another implication to the use of the dynamometer. It is suggested that changes
in performance when using the dynamometer are assessed by comparing results using the
same resistance level.
The exercises used (chest press, seated row, leg press) are common exercises performed by
athletes in various training facilities, hence the close resemblance to these moves and the fact
13 include any validity assessment of the Concept2 Dyno®. As a result, the findings of the
present study relate to performance measurements obtained by the Concept2 Dyno® only and
the performance scores form it cannot be compared to other isoinertial strength measures
using e.g. free weights.
PRACTICAL APPLICATIONS
Concept2 Dyno® is a reliable strength testing equipment for competitive athletes who utilise
strength training as part of their programme. All three exercises were found to have good
reliability (high ICC and low CV) and acceptable sensitivity, making the dynamometer
sufficiently sensitive to detect small changes in athletes’ performance. Performance in leg
press should be assessed using the coefficient of variation rather the raw score. In addition,
care needs to be given to maintaining execution form throughout performance as well as
maintaining the same execution form for repeat performances. From knowledge of the
mechanics behind the Concept2 Dyno®, i.e. fluid resistance, validity may develop in sports
that involve motion that is loaded in a similar manner (i.e. swimming, water polo). However,
there may also be benefits for athletes over a broader spectrum of sports where such
14
REFERENCES
1. Atkinson, G, and Nevill, AM. Statistical methods for assessing measurement error
(reliability) in variables relevant to sports medicine. Sports Med 26: 217-238, 1998.
2. Atkinson, G, and Reilly, T. Circadian variation in sports performance. Sports Med 21:
292-312, 1996.
3. Bampouras, TM, Relph, NS, Orme, D, and Esformes, JI. Validity and reliability of the
Myotest Pro wireless accelerometer in squat jumps. Isokinetics and Exercise Science, 21:
101-105, 2013.
4. Bland, JM, and Altman, DG. Measuring agreement in method comparison studies. Stat
Methods Med Res 8: 135-160, 1999.
5. Cormie, P, McBride, JM, and McCaulley, GO. Power-time, force-time, and velocity-time
curve analysis during the jumps squat: impact of load. J Appl Biomech 24: 112-120,
2008.
6. Fleiss, JL. Design and analysis of clinical experiments. New York, NY: John Wiley &
Sons, 1986.
7. Gioftsidou, A, Ispirlidis, I, Pafis, G, Malliou, P, Bikos, C, and Godolias, G. Isokinetic
strength training program for muscular imbalances in professional soccer players. Sport
Sci Health 2:101-105, 2008.
8. Graham-Smith, P, Burgess, K, and Ridler, A. The relationship between strength, power,
flexibility, anthropometry and technique and 2000 m and 5000 m rowing ergometer
performance. In: Kinanthropometry X. Marfell-Jones, M., and Olds, T, eds. New York:
Routledge, 2007. pp. 135-150.
9. Hoffman, JR, Kang, J. Strength changes during an in-season resistance-training program
15 10.Hopkins, WG, Schabort, EJ, and Hawley, JA. Reliability of power in physical
performance tests. Sports Med 31: 211-234, 2001.
11.Jones, P, and Bampouras, TM. A comparison of isokinetic and functional methods of
assessing bilateral strength imbalance. J Strength Cond Res 24: 1553–1558, 2010.
12.Kim E, Dear A, Ferguson SL, Seo D, Bemben MG. Effects of 4 weeks of traditional
resistance training vs. superslow strength training on early phase adaptations in strength,
flexibility, and aerobic capacity in college-aged women. J Strength Cond Res. 25(11):
3006-3013, 2011.
13.Marrin, K, Bampouras, TM. Anthropometric and physiological changes in
elite female water polo players during a training year. Serbian J Sports Sci 2: 75–84,
2008.
14.McCurdy, K, Langford, G, Jenkerson, D, and Doscher, M. The validity and reliability of
the 1RM bench press using chain-loaded resistance. J Strength Cond Res 22: 678-683,
2008.
15.Muller, E, Benko, U, Raschner, C, and Schwameder, H. Specific fitness training and
testing in competitive sports. Med Sci Sports Exerc 32: 216–220, 2000.
16.Murphy, AJ, and Wilson, GJ. The ability of tests of muscular function to reflect
training-induced changes in performance. J Sports Sci 15: 191–200, 1997.
17.Sale, DG. Testing strength and power. In: MacDougall JD, Wenger HA, Green HJ, eds.
Physiological Testing of the High Performance Athlete. 2nd ed. Champaign, IL: Human
Kinetics, 1991. pp. 21 – 106.
18.Sankey, SP, Jones, PA, Bampouras, TM. Effects of two plyometric training programmes
of different intensity on vertical jump performance in high school athletes. Serbian J
16 19.Shrout, PE, and Fleiss, JP. Intraclass correlations: uses in assessing rater reliability.
Psychol Bull 86: 420-428, 1979.
20.Vincent, WJ, and Weir, JP. Statistics in Kinesiology. Champaign, IL: Human Kinetics
Books, 2012.
21.Walsh, MS, Ford, KR, Bangen, KJ, Myer, GD, and Hewett, TE. The validation of a
portable force plate for measuring force-time data during jumping and landing tasks. J
17
Tables Legends
Table 1. Descriptive statistics (mean ± SD) for the seated bench press (CPress), seated bench
pull (SRow), and seated leg press (LPress) from the three trials for both the whole and
sub-sample. The sub-sample descriptives refer to the subjects that executed the exercises with
maximum resistance on the dynamometer.
Table 2. Reliability and sensitivity statistics (intraclass correlation coefficient, ICC3,1;
coefficient of variation, CV; range of 95% limits of agreement, 95% LoA (range); standard
error of measurement (SEM)) for all exercises between trials, for both the whole and
sub-samples. The sub-sample statistics refer to the subjects that executed the exercises with
18 Table 1.
Whole sample Sub-sample
Trial Trial
Exercise 1 2 3 1 2 3
CPress (kg) 75.6 ±
22.0 76.1 ± 22.2 75.8 ± 22.6 88.0 ± 16.0 87.8 ± 17.0 88.1 ± 17.1
SRow (kg) 71.5 ±
19.5 71.4 ± 20.3 70.9 ± 21.0 83.1 ± 13.8 82.6 ± 16.0 82.7 ± 16.8
LPress (kg) 177.7 ±
19 Table 2.
Whole sample Sub-sample
ICC CV (%) 95% LoA
(range)
SEM (kg) ICC CV (%) 95% LoA
(range)
SEM (kg)
Trial 1-2 2-3 1-2 2-3 1-2 2-3 1-2 2-3 1-2 2-3 1-2 2-3 1-2 2-3 1-2 2-3
Exercise
CPress 0.98 0.98 5.1 4.3 0.87 –
1.14
0.90-
1.13
3.1 3.2 0.93 0.96 5.3 4.4 0.86 –
1.18
0.88
–
1.13
4.4 3.4
SRow 0.97 0.97 5.1 5.5 0.87 –
1.15
0.87
–
1.17
3.4 3.6 0.89 0.90 6.0 6.2 0.86 –
1.19
0.85
–
1.18
4.9 5.2
LPress 0.94 0.94 5.6 6.2 0.87 –
1.18
0.86
–
1.19
9.2 9.4 0.91 0.93 6.0 5.6 0.87 –
1.19
0.88
–
1.18