A Genome-Wide Association Study Identifies A New Ovarian Cancer Susceptibility Locus On 9p22.2
Honglin Song1**, Susan J. Ramus2**, Jonathan Tyrer1, Kelly L. Bolton1, 17, Aleksandra Gentry-Maharaj2, Eva Wozniak2, Hoda Anton-Culver3, Jenny Chang-Claude4, Daniel W. Cramer5, Richard DiCioccio6, Thilo Dörk7, Ellen L. Goode8, Marc T Goodman9, Joellen M
Schildkraut10, Thomas Sellers11, Laura Baglietto12, 13, Matthias W. Beckmann14, Jonathan Beesley15, Jan Blaakaer16, Michael E Carney9, Stephen Chanock17,Zhihua Chen11, Julie M. Cunningham8, Ed Dicks1, Jennifer A. Doherty18, Matthias Dürst19, Arif B. Ekici20, David Fenstermacher11, Brooke L. Fridley8, Graham Giles12,13, Martin E. Gore21, Immaculata De Vivo22, Peter Hillemanns7, Claus Hogdall23, Estrid Hogdall24, Edwin S Iversen25, Ian J Jacobs2, Anna Jakubowska26, Dong Li3, Jolanta Lissowska27, Jan Lubiński26, Galina Lurie9, Valerie McGuire28, John McLaughlin29, Krzysztof Mędrek26, Patricia G. Moorman10, Kirsten Moysich30, Steven Narod31, Catherine Phelan11, Carole Pye1, Harvey Risch32, Ingo B
Runnebaum19, Gianluca Severi12,13, Melissa Southey33, Daniel O. Stram34, Falk C. Thiel14, Kathryn L. Terry5, Ya-Yu Tsai11, Shelley S. Tworoger22, David J. Van Den Berg34, Robert A. Vierkant8, Shan Wang-Gohrke35, Penelope M. Webb15, Lynne R. Wilkens9, Anna H Wu34, Hannah Yang17, Wendy Brewster36, Argyrios Ziogas3, Australian Cancer (Ovarian) Study37, The Australian Ovarian Cancer Study Group37, The Ovarian Cancer Association Consortium, Richard Houlston38, Ian Tomlinson39, Alice S Whittemore28, Mary Anne Rossing18, Bruce A.J. Ponder1, Celeste Leigh Pearce34, Roberta B, Ness40, Usha Menon2, Susanne Krüger Kjaer24, Jacek Gronwald26, Montserrat Garcia-Closas17, Peter A. Fasching14,41, Douglas F Easton42, Georgia Chenevix-Trench15, Andrew Berchuck10, Paul D.P. Pharoah1* and Simon A. Gayther2
1 CR-UK Department of Oncology, University of Cambridge, Strangeways Research Laboratory, Cambridge, UK
3 Department of Epidemiology, University of California Irvine, USA
4 Division of Cancer Epidemiology, German Cancer Research Center, Heidelberg, Germany 5 Obstetrics and Gynecology Epidemiology Center, Brigham and Women's Hospital, Boston, MA
6 Department of Cancer Genetics and the Gilda Radner Familial Ovarian Cancer Registry
Buffalo, NY, USA
7 Clinics of Obstetrics and Gynaecology, Hannover Medical School, Hannover, Germany 8 Mayo Clinic College of Medicine, Rochester, MN, USA
9 Epidemiology Program, Cancer Research Center of Hawaii, University of Hawaii, USA
10.The Comprehensive Cancer Center, Duke University Medical Center, Durham, NC, USA 11Moffitt Cancer Center, 12902 Magnolia Drive, Tampa, FL, USA
12 Cancer Epidemiology Centre, The Cancer Council Victoria, Rathdowne Street, Carlton VIC 3053, Australia
13 Centre for Molecular, Environmental, Genetic and Analytic Epidemiology, University of Melbourne, Swanston Street, Carlton VIC 3053, Australia
14 University Hospital Erlangen, Department of Gynecology and Obstetrics, Germany 15.The Queensland Institute of Medical Research, Post Office Royal Brisbane Hospital, Australia
16 Department of Gynaecological and Obstetrics, Skejby University Hospital, Århus 17 Division of Cancer Epidemiology and Genetics, National Cancer Institute, Rockville, Maryland, USA
20 Institute of Human Genetics, Friedrich Alexander University Erlangen-Nuremberg, Erlangen, Germany
21 The Royal Marsden Hospital, Gynecological Oncology Unit, London, UK
22 Channing Laboratory, Department of Medicine, Brigham and Women's Hospital & Harvard Medical School, Boston, MA
23 The Gyneacologic Clinic, The Juliane Marie Centre, Rigshospitalet, Copenhagen, Denmark 24 Department of Viruses, Hormones and Cancer, Institute of Cancer Epidemiology, Danish Cancer Society, Copenhagen, Denmark
25 Department of Statistical Science, Duke University
26 International Hereditary Cancer Center, Department Of Genetics and Pathology, Pomeranian Medical University, Szczecin, Poland
27 Department of Cancer Epidemiology and Prevention, M. Sklodowska-Curie Cancer Centre and Institute of Oncology, Warsaw, Poland
28 Department of Health Research and Policy, Stanford University School of Medicine, Stanford, USA
29 Samuel Lunenfeld Research Institute, 60 Murray Street, Toronto, ON, Canada 30 Roswell Park Cancer Centre, Buffalo, NY, USA
31 Center for Research in Women's Health, 790 Bay St., Toronto, ON, Canada 32 Yale University, 60 College Street, New Haven, CT, USA
33 Genetic Epidemiology Laboratory, Department of Pathology, The University of Melbourne, VIC 3010, Australia
34 University of Southern California, Keck School of Medicine, Los Angeles, California, USA
36 Department of Obstetrics and Gynecology, University North Carolina, Chapel Hill, North Carolina, USA
37 Queensland Institute of Medical Research and Peter MacCallum Cancer Center 38 Section of Cancer Genetics, Institute of Cancer Research, Sutton, UK
39 Population and Functional Genetics Lab, Wellcome Trust Centre for Human Genetics, Oxford, UK
40 The University of Texas, School of Public Health, Houston, TX, USA
41 University of California at Los Angeles, David Geffen School of Medicine, Division of Hematology and Oncology
42 CR-UK Genetic Epidemiology Unit, University of Cambridge, Strangeways Research Laboratory, Cambridge, UK
** Contributed equally to the study.
*To whom correspondence should be addressed:
Dr. Paul Pharoah, CR-UK Department of Oncology, University of Cambridge, Strangeways Research Laboratory, Cambridge, UK.
Email:paul1@srl.cam.ac.uk
Epithelial ovarian cancer has a major heritable component, but the known susceptibility genes explain less than half the excess familial risk1. We performed a genome wide association study (GWAS) to identify common ovarian cancer susceptibility alleles. We evaluated 507,094 SNPs genotyped in 1,817 cases and 2,353 controls from the UK and ~2 million imputed SNPs. We genotyped the 22,790 top ranked SNPs in 4,274 cases and 4,809 controls of European ancestry from Europe, USA and Australia. We identified 12 SNPs at 9p22 associated with disease risk (P<10-8). The most significant SNP
(rs3814113; P = 2.5 x 10⁻¹⁷) was genotyped in a further 2,670 ovarian cancer cases and 4,668 controls confirming its association (combined data odds ratio = 0.82 95% CI 0.79 – 0.86, P-trend = 5.1 x 10⁻¹⁹).
The association differs by histological subtype, being strongest for serous ovarian cancers (OR 0.77 95% CI 0.73- 0.81, Ptrend = 4.1 x 10⁻²¹).
Women with a first-degree relative diagnosed with epithelial ovarian cancer have a three-fold increased risk of developing the disease2. Environmental and genetic factors contribute to this increased risk, but studies of twins suggest that genetic factors are more important. BRCA1 and BRCA2 mutations confer high risk of ovarian cancer and are responsible for most families with three or more ovarian cancer cases. They account for less than half the excess familial risk3, 4 and it is likely that the residual risk is due to a combination of common and/or rare alleles that confer moderate to low penetrance susceptibility5.
Many recent studies have reported the identification of common alleles that confer low-penetrance
genotype frequencies for 1,817 cases were compared with the genotypes of 2,353 UK controls that had been analysed using the similar 550k array on the same genotyping platform as part of a GWAS for other
phenotypes (Supplementary Table 1 online). All the subjects analyzed in stage 1 were of European ancestry. After excluding 80,327 SNPs that were not genotyped on controls or failed to genotype on cases, a total of 507,094 SNPs with a minor allele frequency (MAF) of at least 1% in controls passed genotype quality control criteria. We also evaluated an additional ~ 2million SNPs with genotypes imputed using the phase2 Hapmap data (CEU).
analysis. These additional data reinforced the evidence of association for rs3814113; P-trend = 5.1 x10⁻¹⁹ based on data from all three stages (Table 2).
rs3814113 was associated with a decrease in the risk of ovarian cancer in carriers of the minor allele (per minor allele odds ratio (OR) = 0.82 95% confidence interval (CI) 0.79- 0.86). The effect size was similar in stages 1 and 2, but slightly smaller in stage 3. There was no heterogeneity in the OR estimates amongst studies for any stages (Table 2 and in Figure 1A). Based on an odds ratio of 0.82 and minor allele frequency of 0.32, this locus explains approximately 0.7% of the polygenic component of ovarian cancer risk. This estimate is also based on the assumption that the known high penetrance genes explain 40% of the excess familial risk and the unexplained component is polygenic. There was no significant difference between the risk of ovarian cancer in subjects of European and non-European ancestry (P = 0.83). However, the per-minor allele risk was slightly attenuated and not significant in the subjects of non-European ancestry (OR = 0.89, 95% CI 0.78-1.01, P = 0.077) (Supplementary Table 3 online).
We also evaluated the association for rs3814113 with ovarian cancer risk after stratifying cases by histological subtype. The strength of association increased when serous cases (n = 4,847), the most common histological subtype, were considered alone (OR = 0.77 95% CI 0.73-0.81, P-trend = 4.1x10⁻²¹) (Supplementary Table 4 online and Figure 1B). When the analysis was restricted to serous cases the effects were similar between European and non-European subject (non-European OR = 0.79, 95% CI 0.66-0.94, P = 0.007). We only detected marginal evidence of association for rs3814113 in 1,320 cases diagnosed with endometrioid ovarian cancer (OR = 0.86 95% CI 0.79-0.94, P-trend = 0.001), and no association for patients with mucinous (n = 626) or clear cell (n = 628) ovarian cancer (Supplementary Table 4 online). However, the small numbers of mucinous or clear cell cases limited the power to detect modest effects. Compared to the non-serous subtypes, the ovarian cancer risk in serous cases was significantly lower (P= 7.8x 10⁻⁵). There was also some suggestion of a bigger effect in older women (P-trend = 0.006 for ovarian cancer overall and P-trend = 0.044 for serous type ovarian cancer) (Supplementary Table 5 online). There was no significant difference in genotype frequency for cases reporting a family history of ovarian cancer compared with cases with negative family history of ovarian cancer (P = 0.59)
variant within the region (Figure 2), although it is possible that there are multiple independent SNPs all correlated with the best markers. rs3814113 may be the causal SNP on 9p22.2 or it may be a marker in linkage disequilibrium (LD) with the true functional variant or haplotype. Neither rs3814113 nor the highly correlated SNP, rs4445329, (r2 > 0.99) are located within an open reading frame or an intronic region of any gene. The nearest genes are BNC2 (basonuclin 2),CNTLN (centlein, a centrosomal protein) and hypothetical gene LOC648570. rs3814113 is ~44kb upstream of BNC2, ~128kb upstream of LOC648570 and ~220kb downstream of CNTLN. Eight of the associated SNPs in the region are located within intron 2 of BNC2 (Figure 2). BNC2 encodes DNA-binding zinc-finger protein that is highly conserved across vertebrates suggesting it is an important regulatory protein for DNA transcription15. The gene exhibits extensive transcriptional variability; it has six promoters and has the potential to generate up to 90,000 mRNA isoforms encoding more than 2,000 different proteins16. The Genevar project provides data on gene expression of BNC2 in lymphocyte derived cell lines from the CEU population based on nine probes in the region17. There was no association for any of these probes and genotype at the top 12 SNPs. Also none of the top 12 SNPs appear to be near predictable or known enhancer binding sites or splice sites using PupaSNP (http://www.pupasnp.org/). BNC2 is highly expressed in reproductive tissues (ovary and testis) and may play a role in the differentiation of spermatoza and oocytes18. There is little evidence of a role for
BNC2 in cancer development, although there is a report of 7~9 fold up-regulated expression in basal cell carcinoma compared to normal basal cells19. Resequencing of the 9p22.2 region and further genotyping in ovarian cancer cases and controls will be needed to clarify the likely causal variant(s).
20% suggesting that susceptibility alleles with more modest effects remain to be identified. Furthermore, power to detect less common alleles will be limited unless the effect on risk is greater. For example, we have 90 percent power at genome-wide significance to detect a risk allele with 5 percent frequency that confers a relative risk of 1.44. This would be consistent with the findings for other common cancer types (e.g. breast cancer and prostate cancers)29. In addition, disease heterogeneity may have limited our power to identify additional susceptibility alleles. In the primary analysis, we considered ovarian cancer as a single disease phenotype, but the effects of association for rs3814113 varied when cases were stratified by histological subtype. Different subtypes of ovarian cancer have different biological properties and this finding supports previous studies that suggest susceptibility due to germline genetic variation may be sub-type specific. For example, serous and endometrioid cancer are relatively more common in BRCA1 and BRCA2 mutation carriers whereas mutations in the DNA mismatch repair genes are more frequently associated with mucinous ovarian cancers30-32. Additional ovarian cancer susceptibility loci may exist that are associated with specific histological or molecular subtypes33. However, the power to identify alleles for the rarer subtypes (endometrioid, mucinous and clear cell ovarian cancers) was limited by the numbers of cases in the study. It is likely that pooling of data from multiple ovarian cancer GWAS will enable additional susceptibility alleles for invasive ovarian cancer in general and for specific sub-types to be identified.
has since led the to development of a potential novel therapy for patients deficient in BRCA1/2 function based on inhibition of the poly (ADP-ribose) polymerase PARP DNA repair pathway34,35.
The 9p22.2 region is the first common susceptibility locus for ovarian cancer to be established.
Acknowledgements
We thank all the individuals who took part in this study. We thank all the researchers, clinicians and administrative staff who have enabled the many studies contributing to this work. In particular we thank: Andy Ryan and Jeremy Ford (UKOPS), Jonathan Morrison, SEARCH team, Ursula Eilber and Tanja Koehler (GER), David Bowtell, A. deFazio, D. Gertig, A. Green, (AOCS http://www.aocstudy.org/), A. Green, P. Parsons, N. Hayward, D. Whiteman (ACS); Louise Brinton, Mark Sherman, Aimee Hutchinson, Neonila Szeszenia-Dabrowska, Beata Peplonska , W. Zatonski, Anita Soni, Pei Chao, Michael Stagner (POL1), Natalia Bogdanova, Sabine Haubold, Peter Schürmann, Frauke Kramer, Tjoung-Won Park-Simon and Katrin Beer-Grondke, Dagmar Schmidt (HJOCS).
The genotyping and data analysis for this study was supported by a project grant from Cancer Research UK. We acknowledge the computational resources provided by the University of Cambridge (CamGrid). The Ovarian Cancer Association Consortium is supported by a grant from the Ovarian Cancer Research Fund thanks to generous donations by the family and friends of Kathryn Sladek Smith. DFE is a Principal Research Fellow of Cancer Research UK, PDPP is CRUK Senior Clinical Research Fellow. SJR is supported by the Mermaid/Eve Appeal, GCT and PW are supported by the NHMRC. PAF is funded by the Deutsche Krebshilfe e.V.
Funding of the constituent studies was provided by: The Roswell Park Alliance, The Danish Cancer Society and the National Cancer Institute (CA71766, CA16056, R01 CA61107, R01 CA122443, R01 CA054419, P50 CA105009,R01CA114343, R01 CA87538, R01 CA112523, R01-CA- 58598, CN-55424 and N01-PC-35137, R01-CA-122443, CA-58860, CA-92044), the U.S. Army Medical Research and Material Command (DAMD17-01-1-0729), the Cancer Council Tasmania and Cancer Foundation of Western
Tables and figure legends
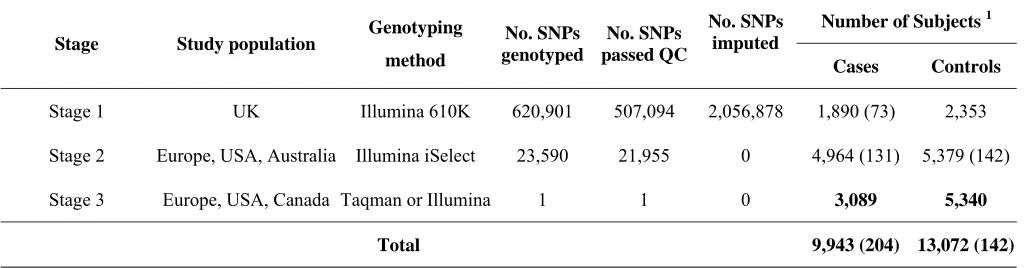
Table 1: Summary of study design.
Table 2. Estimated odds ratios and test of association for rs3814113 at chromosome 9p22.2 based on combined data for subjects of European ancestry.
Figure 1: Genotype-specific risks of SNP rs3814113 for ovarian cancer by stage and by study - (a) all epithelial ovarian cancer cases, (b) serous ovarian cancer cases only. Results are based on analyses restricted to subjects of European ancestry.
Table 1: Summary of study design.
Stage Study population Genotyping method
No. SNPs genotyped
No. SNPs passed QC
No. SNPs imputed
Number of Subjects 1
Cases Controls
Stage 1 UK Illumina 610K 620,901 507,094 2,056,878 1,890 (73) 2,353
Stage 2 Europe, USA, Australia Illumina iSelect 23,590 21,955 0 4,964 (131) 5,379 (142)
Stage 3 Europe, USA, Canada Taqman or Illumina 1 1 0 3,089 5,340
Total 9,943 (204) 13,072 (142)
15 Table 2. Estimated odds ratio and tests of association for rs3814113 at chromosome 9 (9p22.2) based on combined data for subjects of European ancestry.
a. Minor allele frequency in populations with European ancestry in the studies b. Odds ratios (OR) and 95% confidence interval per copy of minor allele c. OR for heterozygotes compared with common homozygotes
d. OR for rare homozygotes compared with common homozygote. Data highlighted with bold text are GWAS significant (P<5.0x10⁻⁸) Tumor
subtype Stage
No. of
Cases/ Controls
MAFa
Case/Control
Per-allele ORb
[95% CI]
Heterozygotec
OR [95% CI]
Homozygoted
OR [95% CI] P-trend
All Cases
Stage 1 1817/2354 0.27/0.32 0.81 (0.74-0.89) 0.76 (0.67-0.86) 0.73 (0.58-0.91) 2.04x10⁻⁵
Stage 2 4274/4809 0.28/0.33 0.79 (0.74-0.84) 0.80 (0.76-0.93) 0.70 (0.63-0.77) 1.98x10⁻¹³
Stage 3 2670/4668 0.29/0.32 0.88 (0.81-0.94) 0.84 (0.77-0.93) 0.80 (0.68-0.95) 4.00x10⁻⁴
Combined 8761/11831 0.28/0.32 0.82 (0.79-0.86) 0.80 (0.75-0.85) 0.70 (0.63-0.77) 5.10x10⁻¹⁹
Serous Cases
Stage 1 837/2354 0.25/0.32 0.71 (0.62-0.81) 0.70 (0.59-0.82) 0.52 (0.38-0.72) 1.44x10⁻⁷
Stage 2 2483/4809 0.27/0.33 0.75 (0.70-0.81) 0.76 (0.68-0.84) 0.57 (0.47-0.68) 5.60x10⁻¹³
Stage 3 1527/4668 0.28/0.32 0.83 (0.76-0.92) 0.81(0.71-0.92) 0.74 (0.60-0.92) 2.07x10⁻⁴
METHODS Study design.
The ovarian cancer case-control studies that participated in stages 1, 2 and 3 are summarized in
Supplementary Table 1 online. Stage 1 comprised invasive epithelial ovarian cancer cases from UK and genotype data of UK controls from GWAS of other phenotypes. Stage 2 comprised 10 studies from the OCAC. Stage 3 comprised 10 additional studies from the OCAC. For all studies we have data on disease status, age at diagnosis and date of blood draw, self-reported ethnic group and histological subtype. All but 5 studies provided information of reported first-degree family history of ovarian cancer.
Genotyping
Genotyping for stage 1 cases was conducted using the Illumina Infinium 610K array at Illumina Corporation. Existing data from two sets of controls, genotyped on the Infinium 550k array, were used in stage 1 analyses: the Welcome Trust Case-Control Consortium 1958 birth cohort 14, and a national colorectal control study36 using Illumina platform Hap550 array. All cases were from the UK and confirmed as invasive epithelial ovarian cancer. Quality control criteria were applied separately to the cases and each control sets because they were genotyped separately. SNPs were excluded if (1) they deviated from hardy-Weinberg equilibiurm (HWE) at P < 10-4 or (2) had a MAF < 1%, or (3) MAF was between 1% and 5% and call rate < 99% or (4) MAF > 5% and call rate < 95%. We also rejected SNPs if a test for trend by genotype between the two control sets was significant at P < 10-4. This led to 33,479 SNPs being excluded and 507,094 SNPs passing QC. Genotyping the 10 studies in stage 2 was conducted using an Illumina iSelect array at Illumina Corportation. We excluded SNPs (n=1,635) for the stage 2 data if the sum of the test statistics for deviation from HWE for the 10 studies was significant at p < 10-5 or if the SNPs had a call rate of <95% or if the MAF < 0.5%. A total of 21,955 SNPs were available for data analysis in stage 2.
studies (TOR, NCO, MAY) genotype data were available from an independent, ongoing GWAS study that is also used the Illumina Infinium 610K platform. Genotyping and QC was performed at Mayo Clinic
genotyping shared resources. For Taqman genotyping quality control, we compared genotype call rates and concordance by study and overall. We used the following criteria as a measure of acceptable genotyping: (1) > 3% sample duplicates included; (2) concordance rate for the duplicates ≥ 98%; (3) overall call rate (by study) > 95%; (4) call rates > 90% for each individual 384-well plate and (5) no deviation from HWE in controls (P>=0.05). Genotyping consistency across laboratories using Taqman was also evaluated by genotyping a common panel of CEPH-Utah trios including 90 individual DNA samples, 5 duplicate samples and 1 negative control (http://ccr.coriell.org/). The concordance of genotyping results between the centres was required to be greater than 98% in order for the genotype data to be included. The genotyping results from all studies in the stage 3 met the above criteria and were included in the final analysis.
Statistics
Population stratification
For the stage 1 samples, we used the program LAMP37 to assign intercontinental ancestry based on the Hapmap (release #22) genotype frequency data for European, African and Asian populations. Samples with less than 90% European ancestry were excluded from the analysis (n=73). For the stage 2 data, 800 SNPs that are known to be predictive of ancestry (“Ancestry Informative Markers”) (AIMs) were genotyped. We again used LAMP and the Hapmap data (release #23) on European (CEU), African American (ASW), East Asian (JPT-CHB-CHD), Mexican (MEX) and Indian (GIH) populations to estimate ancestry. Subjects with less than 90 percent European ancestry were excluded from the main analyses (n= 987). We then used the AIMs to calculate principal components for the subjects of European ancestry. The first principal component explained 0.42 percent of the variability and was included as a covariate in subsequent association analyses. Subsequent principal components were not included as they and explained less variability and there was little difference in their Eigenvalues.
Imputation
failed QA in different sample sets. Secondly, imputing SNPs that have not been genotyped increases genome coverage and may improve power. We used an in-house method that combines the features of fastPHASE 38 and IMPUTE 39 to impute the ungenotyped or missing SNPs, utilising the phase2 Hapmap data (CEU) which contains phased haplotypes for 60 individuals on 2.5 million SNPs. For each imputed genotype the expected number of minor alleles carried was estimated (weights). Genotyped SNPs were assigned weights of 0, 1 or 2 (actual number of minor alleles carried). We estimated the accuracy of imputation by calculating the estimated r2 between the imputed and actual SNP 40. SNPs with r2<0.64 were excluded (n = 152,401) leaving a total of 2,563,972 SNPs for stage 1 analysis.
Statistical Tests of Association
References
1. Pharoah,P.D. & Ponder,B.A. The genetics of ovarian cancer. Best Pract Res Clin Obstet. Gynaecol. 16, 449-468 (2002).
2. Stratton,J.F., Pharoah,P., Smith,S.K., Easton,D., & Ponder,B.A. A systematic review and meta-analysis of family history and risk of ovarian cancer. Br J Obstet. Gynaecol. 105, 493-499 (1998).
3. Antoniou,A.C. & Easton,D.F. Risk prediction models for familial breast cancer. Future. Oncol 2, 257-274 (2006).
4. Gayther,S.A. et al. The contribution of germline BRCA1 and BRCA2 mutations to familial ovarian cancer: no evidence for other ovarian cancer-susceptibility genes. Am J Hum Genet 65, 1021-1029 (1999).
5. Pharoah,P.D., Antoniou,A.C., Easton,D.F., & Ponder,B.A. Polygenes, risk prediction, and targeted prevention of breast cancer. N Engl J Med 358, 2796-2803 (2008).
6. Easton,D.F. et al. Genome-wide association study identifies novel breast cancer susceptibility loci. Nature 447, 1087-1093 (2007).
7. Thomas,G. et al. Multiple loci identified in a genome-wide association study of prostate cancer. Nat Genet 40, 310-315 (2008).
8. Brown,K.M. et al. Common sequence variants on 20q11.22 confer melanoma susceptibility. Nat Genet 40, 838-840 (2008).
9. Eeles,R.A. et al. Multiple newly identified loci associated with prostate cancer susceptibility. Nat Genet 40, 316-321 (2008).
10. Gudbjartsson,D.F. et al. ASIP and TYR pigmentation variants associate with cutaneous melanoma and basal cell carcinoma. Nat Genet 40, 886-891 (2008).
12. Yeager,M. et al. Genome-wide association study of prostate cancer identifies a second risk locus at 8q24. Nat Genet 39, 645-649 (2007).
13 de Bakker,P.I. et al. Practical aspects of imputation-driven meta-analysis of genome-wide association studies. Hum Mol Genet 17, R122-R128 (2008).
14. Wellcome Trust Case Control Consortium Genome-wide association study of 14,000 cases of seven common diseases and 3,000 shared controls. Nature 447, 661-678 (2007).
15. Vanhoutteghem,A. & Djian,P. Basonuclin 2: an extremely conserved homolog of the zinc finger protein basonuclin. Proc. Natl Acad. Sci U. S. A 101, 3468-3473 (2004).
16. Vanhoutteghem,A. & Djian,P. The human basonuclin 2 gene has the potential to generate nearly 90,000 mRNA isoforms encoding over 2000 different proteins. Genomics 89, 44-58 (2007). 17. Stranger,B.E. et al. Population genomics of human gene expression. Nat Genet 39, 1217-1224
(2007).
18. Romano,R.A., Li,H., Tummala,R., Maul,R., & Sinha,S. Identification of Basonuclin2, a DNA-binding zinc-finger protein expressed in germ tissues and skin keratinocytes. Genomics 83, 821-833 (2004).
19. O'Driscoll,L. et al. Investigation of the molecular profile of basal cell carcinoma using whole genome microarrays. Mol Cancer 5, 74 (2006).
20. Song,H. et al. Association between invasive ovarian cancer susceptibility and 11 best candidate SNPs from breast cancer genome-wide association study. Hum Mol Genet 18, 2297-2304 (2009).
21. Quaye,L. et al. The effects of common genetic variants in oncogenes on ovarian cancer survival. Clin Cancer Res 14, 5833-5839 (2008).
22. Pearce,C.L. et al. Validating genetic risk associations for ovarian cancer through the international Ovarian Cancer Association Consortium. Br J Cancer(2009).
24. Ramus,S.J. et al. Consortium analysis of 7 candidate SNPs for ovarian cancer. Int. J Cancer 123, 380-388 (2008).
25. Ghoussaini,M. et al. Multiple Loci with different cancer specificities within the 8q24 gene desert. J Natl Cancer Inst 100, 962-966 (2008).
26. Song,H. et al. Association Study of Prostate Cancer Susceptibility Variants with Risks of Invasive Ovarian, Breast, and Colorectal Cancer. Cancer Res 68, 8837-8842 (2008).
27. Gayther,S.A. et al. Tagging single nucleotide polymorphisms in cell cycle control genes and susceptibility to invasive epithelial ovarian cancer. Cancer Res 67, 3027-3035 (2007).
28. Song,H. et al. Tagging Single Nucleotide Polymorphisms in the BRIP1 Gene and Susceptibility to Breast and Ovarian Cancer. PLoS ONE 2, e268 (2007).
29. Easton,D.F. & Eeles,R.A. Genome-wide association studies in cancer. Hum Mol Genet 17, R109-R115 (2008).
30. Rubin,S.C. et al. Clinical and pathological features of ovarian cancer in women with germ-line mutations of BRCA1. N Engl J Med 335, 1413-1416 (1996).
31. Lakhani,S.R. et al. Pathology of ovarian cancers in BRCA1 and BRCA2 carriers. Clin Cancer Res 10, 2473-2481 (2004).
32. Domanska,K., Malander,S., Masback,A., & Nilbert,M. Ovarian cancer at young age: the contribution of mismatch-repair defects in a population-based series of epithelial ovarian cancer before age 40. Int J Gynecol. Cancer 17, 789-793 (2007).
33. Tothill,R.W. et al. Novel molecular subtypes of serous and endometrioid ovarian cancer linked to clinical outcome. Clin Cancer Res 14, 5198-5208 (2008).
34. Lord,C.J. & Ashworth,A. Targeted therapy for cancer using PARP inhibitors. Curr. Opin. Pharmacol. 8, 363-369 (2008).
36. Houlston,R.S. et al. Meta-analysis of genome-wide association data identifies four new susceptibility loci for colorectal cancer. Nat Genet 40, 1426-1435 (2008).
37 Sankararaman,S., Sridhar,S., Kimmel,G., & Halperin,E. Estimating local ancestry in admixed populations. Am J Hum Genet 82, 290-303 (2008).
38. Scheet,P. & Stephens,M. A fast and flexible statistical model for large-scale population genotype data: applications to inferring missing genotypes and haplotypic phase. Am J Hum Genet 78, 629-644 (2006).
39. Marchini,J., Howie,B., Myers,S., McVean,G., & Donnelly,P. A new multipoint method for genome-wide association studies by imputation of genotypes. Nat Genet 39, 906-913 (2007).