Do w n l o a d e d fr o m : h t t p ://i n si g h t . c u m b r i a . a c . u k /i d/ e p ri n t/ 1 4 1 0 /
U s a g e o f a n y i t e m s f r o m t h e U n i v e r s i t y o f C u m b r i a’ s i n s t i t u t i o n a l r e p o s i t o r y ‘I n s i g h t ’ m u s t c o n f o r m t o t h e f o l l o w i n g f a i r u s a g e g u i d e l i n e s .
Any it e m a n d it s a s s o ci a t e d m e t a d a t a h el d i n t h e U niv e r si ty of C u m b r i a ’s in s ti t u ti o n al r e p o si t o r y I n si g h t ( u nl e s s s t a t e d o t h e r wi s e o n t h e m e t a d a t a r e c o r d ) m a y b e c o pi e d , di s pl ay e d o r p e rf o r m e d , a n d s t o r e d i n li n e wi t h t h e JIS C f ai r d e a li n g g ui d eli n e s ( av ail a bl e h e r e) fo r e d u c a t i o n al a n d n o t-fo r-p r ofi t a c tiviti e s
p r o v i d e d t h a t
• t h e a u t h o r s , ti tl e a n d full bi blio g r a p h i c d e t ail s of t h e it e m a r e ci t e d cl e a rly w h e n a n y p a r t
of t h e w o r k is r ef e r r e d t o v e r b a lly o r i n t h e w ri t t e n fo r m
• a h y p e rli n k/ U RL t o t h e o ri gi n al I n si g h t r e c o r d of t h a t it e m is i n cl u d e d i n a n y ci t a ti o n s of t h e w o r k
• t h e c o n t e n t is n o t c h a n g e d i n a n y w a y
• all fil e s r e q ui r e d fo r u s a g e of t h e it e m a r e k e p t t o g e t h e r wi t h t h e m a i n it e m fil e. Yo u m a y n o t
• s ell a n y p a r t of a n it e m
• r e f e r t o a n y p a r t of a n it e m wi t h o u t ci t a ti o n
• a m e n d a n y it e m o r c o n t e x t u ali s e it i n a w a y t h a t will i m p u g n t h e c r e a t o r ’s r e p u t a t i o n
• r e m ov e o r a l t e r t h e c o py ri g h t s t a t e m e n t o n a n it e m . T h e full p oli cy c a n b e fo u n d h e r e.
15
Citation:
Green,K., Longman, D. (2012) ‘Polling Learning: Modelling the use of technology in
classroom questioning‘Tean Journal 4 (3) October [Online]. Available at:
http://bit.ly/AtMwtr (Accessed 28 October 2012).
Polling learning:
Modelling the use of technology
in classroom questioning
Teacher Education
Network Journal
Copyright © 2012 University of Cumbria Vol 4 (3) page 15-34
Kerie Green, David Longman University of Wales
Abstract
This project used an audience response system to explore its value for providing structured in-class feedback to tutors and learners, with a particular emphasis on supporting a tutor's use of questioning techniques. The research was conducted within a BSc Mathematics programme forming part of an undergraduate initial teacher training course. A key strategic aim for learning and teaching development at the University of Wales Newport is to embed feedback as part of the learning experience. This was achieved with the use of ‘clickers’, a valuable tool that tutors can use occasionally, or frequently to support more effective and satisfying
feedback through question and discussion techniques. An additional element of this project was to model the use of clickers for student teachers in order to encourage their adoption of similar techniques in their own classroom teaching. The findings illustrate the impact on teaching in both diagnostic aspects and in social, classroom aspects.
Keywords
Technology enhanced teaching; mathematics education; audience response systems; formative assessment; teacher education; questioning.
Introduction
This project evaluated the effectiveness of an audience response system (referred to in this paper as ‘clickers’) for university-based classroom teaching. The devices were used to support structured questioning and discussion between the tutor and student teachers, an essential element of interactive teaching and one part of an effective formative feedback strategy. The 2012 TEAN conference theme, ‘creating effective teachers’ (TEAN, 2012), invited a focus on modelling the effective use of technology as a formative assessment tool in order to promote effective practice in student teachers’ own classroom teaching.
16
Citation:
Green,K., Longman, D. (2012) ‘Polling Learning: Modelling the use of technology in
classroom questioning‘Tean Journal 4 (3) October [Online]. Available at:
http://bit.ly/AtMwtr (Accessed 28 October 2012).
pad and the responses are instantly tallied and displayed on screen’ (Latessa and Mouw, 2005; see also Retkute, 2009).
There has been extensive work with clickers in various types of classrooms and subject domains over nearly a decade. Many reports and classroom experiments have emphasised the benefits to student engagement and attendance although there is less direct evidence of improvement in outcome grades. Evidence on the practices and experiences of HE teachers is more limited, principally because much of the research has been associated with technology adoption where participants are new to the technology and are learning how to manage it effectively.
This project aimed to re-visit the benefits of ‘clickers’ to student learning during a series of mathematics workshops and, for the teacher, to look at the value of the data generated by the response software. Our results reinforced some findings in the literature about important shifts in classroom pedagogy. We also wished to model the usefulness of this simple technology for the student teachers so that they might take this experience forward into their own teaching.
Background
The project was conducted with a group of 25 year one student teachers on a two-year BSc Mathematics initial teacher training programme. The taught module was a ten week mathematics major covering statistical inference (five sessions) and matrix algebra (five sessions).
The BSc Secondary Mathematics programme at the University of Wales, Newport is unique in Wales and is designed to recruit non-traditional entrants into teacher training. Students tend to be more mature, to be drawn from diverse occupational backgrounds, often have had discontinuous education histories and are mostly drawn from a relatively disadvantaged area of South Wales. It is thus important that our learning, teaching and assessment approaches strive to meet their needs. As the University's learning and teaching strategy notes: ‘... a widening access strategy ... will include a stronger focus on helping those who access higher education to successfully complete their learning objectives’.
The principal teaching mode is guided instruction, i.e. a mathematical idea or procedure is described and explained, followed by worked examples produced by the student and complemented with question and answer episodes. In guided instruction, it is essential to make use of question-answer techniques to check and counter-check students' progress with the module content. The use of the clickers lends itself quickly and almost seamlessly to this aspect of teaching.
17
Citation:
Green,K., Longman, D. (2012) ‘Polling Learning: Modelling the use of technology in
classroom questioning‘Tean Journal 4 (3) October [Online]. Available at:
http://bit.ly/AtMwtr (Accessed 28 October 2012).
learner to do cognitive work’. The student may gradually appropriate knowledge and the capability for learning through this process of scaffolding. The use of the clickers embedded in the workshop resources and pedagogy represents a practical exercise in scaffolding.
Typically for degree level mathematics, students should gain a conceptual
understanding of the content and not merely an operational level of understanding. It is particularly important for student teachers to learn to think mathematically rather than to operate arithmetically in order to be capable of providing effective
learning support to young learners in secondary schools. Guided instruction must aim to maintain an open-ended approach to questioning in order to engage
students in the reflective application of mathematical ideas within the framework of taught sessions. This was achieved through the use of discussion and question stimulated by whole-class clicker responses to structured questions.
Literature review
An overview of the research is available in Retkute (2009), Caldwell (2007) and specifically for mathematics teaching, Robinson and King (2009).
‘Although much research remains to be done to elucidate the reasons why clickers are effective, they do seem to enhance students' active learning, participation, and enjoyment of classes. When used during lectures, clickers have either neutral or positive effects and a more strongly positive effect on learning outcomes when combined with peer or cooperative learning. … They simulate a one-to-many dialogue and make it easier for both instructors and students to receive prompt feedback’ (Caldwell, 2007).
Robinson and King (2009) asked the students in their sample to rank seven statements describing the positive effects of clickers:
1st: (most important): Checks whether I’m understanding course material as I
thought I was
2nd: Allows me to identify problem areas
3rd: It makes lectures more interactive
4th: Makes me think more about the course material during lectures
5th: Gives me an idea of how well everyone else is doing
6th: Allows me to answer privately without others knowing how I voted
7th: It’s fun.
When interviewed the students offered some observations about the use of clickers:
18
Citation:
Green,K., Longman, D. (2012) ‘Polling Learning: Modelling the use of technology in
classroom questioning‘Tean Journal 4 (3) October [Online]. Available at:
http://bit.ly/AtMwtr (Accessed 28 October 2012).
Problem identification:
‘Allows lecturer to know if students are understanding material and hence what to re-cover’.
Engagement/Interactivity:
‘Keeps people awake and attentive during lectures’.
Participation: ‘Gets you involved with the lecture’; ‘You’re [i.e. you are] not afraid to give an
answer.’
The difficulty with much of the research is that inconsistent measures are used. Measurement is strongly context specific, dependent on a variety of other influences and factors. For example, while Robinson and King’s students ranked ‘fun’ as the least important benefit, the students in study Latessa & Mouw (2004) ranked ‘fun’ very highly:
Table 1
. Response data. Adapted from (Latessa & Mouw, 2004).
A Lot Some Little None
To what degree did the ARS make this lecture more fun that
traditional lecture formats? 84% 16% To what degree did the ARS
make you more attentive than
traditional lecture formats? 67% 33% To what degree did the ARS
help you learn more than
traditional lecture formats? 22% 63% 15%
Financial considerations aside, how likely are you to consider using the ARS in your work?
44% 33% 15% 8%
The positive effects on student motivation and attitudes to learning, which can encourage a more active approach to learning, are clear from a number of studies. Retkute (2009) includes a summary of a range of approaches to the use of clickers in teaching. In some cases there was a strong link to required coursework where participation in clicker-based sessions accounted for at least part of the course grade; in other examples the clickers were used formatively, to encourage
19
Citation:
Green,K., Longman, D. (2012) ‘Polling Learning: Modelling the use of technology in
classroom questioning‘Tean Journal 4 (3) October [Online]. Available at:
http://bit.ly/AtMwtr (Accessed 28 October 2012).
Throughout the studies to date there are many striking examples of how the use of clickers can bring new insights and attitudes into learning for both students and experienced teachers. Wood (2004) illustrates this with a reflective observation by a biology instructor when, on using clickers with a series of in-class questions, he discovered that although the recall knowledge of a rule about genetics was
understood (90% of the class) only 48% of students were able to apply the rule:
‘For me, this was a moment of revelation. … for the first time in over 20 years of lecturing I knew… that over half the class didn't ‘get it’…. Because I had already explained the phenomenon as clearly as I could, I simply asked the students to debate briefly with their neighbours and see who could convince whom about which answer was correct. The class erupted into animated conversation. After a few minutes, I asked for a revote, and now over 90% gave the correct answer…’ (cited in Caldwell, 2007).
It might seem obvious that, after such long experience, a teacher would appreciate the difference between students knowing a rule and students knowing how to apply a rule. However, it is clear that relatively slight changes in the format of an
interaction can lead to such revelations. The technology can influence the
underlying social rules of teacher-student and student-student interaction. Our data provides examples of such ‘teacher effects’ as insights into the causes of students’ mathematical misunderstandings. For students too, subtle but important changes in the balance of classroom interaction are evident; for example, anonymous responses affect student self-evaluation of their own learning.
Methods
The clickers were deployed in ten three-hour teaching sessions during September-December 2011. Five sessions covered statistical inference and five sessions covered matrix algebra. In order to familiarise the students with the technique and to test the basic operation of the TurningPoint (2010) software and clickers, two quick quizzes were developed to trial the resource.
The TurningPoint software offers a wide range of options and tools for designing, presenting and collecting responses to questions. A multiple-choice question format was employed as an effective way to explore common misunderstandings. The mathematics tutor designed questions to include this pedagogical strategy in the teaching resource, a PowerPoint slide stack with the TurningPoint questions embedded within it.
The dataset generated by the project has three components:
(i) a measure of the effectiveness of teaching in relation to learning outcomes in the weekly lectures based on percentage of correct answers to
20
Citation:
Green,K., Longman, D. (2012) ‘Polling Learning: Modelling the use of technology in
classroom questioning‘Tean Journal 4 (3) October [Online]. Available at:
http://bit.ly/AtMwtr (Accessed 28 October 2012).
(iii)a formative measure of the effectiveness of teaching based on correlations between teaching and learner response, supported by observation;
(iv)the results of a group survey following the end of module examination.
Design of teaching materials and clicker resources
The hardware and software were straightforward to use although the preparation, use, and post-session data processing does require some skill with more advanced features of PowerPoint and Excel. While TurningPoint provides a very useful array of tools and techniques, it might need some development in order to become more main stream.
The teaching consisted of discrete 'episodes' of activity. Every teaching session deployed these episodes in varying combinations and duration:
review;
explaining content (new or revised);
working shared examples between teacher and group; individuals/small groups practice examples;
question and answer/teacher-group discussion.
The clickers were used in 'review' and 'question-and-answer'. Review questions at the beginning of each session were repeats of, or close variations of, one or two questions from the previous session.
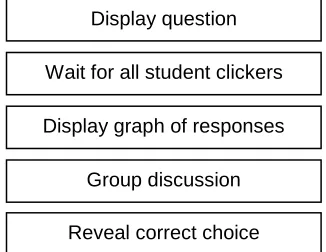
Question and answer episodes were structured as illustrated in Figure 1. The group discussion always followed the collection and display of responses but preceded the 'reveal', the moment when the teacher advances the display to show the correct answer. Up to this point students are not sure which option is correct; thus the preceding discussion is inherently exploratory in nature: ‘Oh, look’, says the teacher, ‘some of you think it's 'B', some of you think 'A'. Who's right?’
Figure 1
. The structured question-discussion sequence.
Display question
Wait for all student clickers
Display graph of responses
Group discussion
21
Citation:
Green,K., Longman, D. (2012) ‘Polling Learning: Modelling the use of technology in
classroom questioning‘Tean Journal 4 (3) October [Online]. Available at:
http://bit.ly/AtMwtr (Accessed 28 October 2012).
Post-session, each student's results were tabulated individually and emailed to them with a copy of the session questions. In this way, students were able, if they so wished, to review their responses.
Multiple-choice questions were designed that offered one correct solution and three plausible alternatives. The next table shows an example from the statistical
inference material. If the student is not clear on the definition of terms or the use of statistical tables he/she could select the incorrect solution:
Table 2.
An example of a multiple-choice question with a rationale for each
option.
A line of numbers from the National Lottery was: 2, 3, 21, 24, 35, 39. It
is known that the population had a standard deviation of 14.3. What is
the 95% confidence interval for the mean of the population?
(a)
The correct solution; student must recognise
use of population standard deviation.
(b)
A common misconception; student uses the
sample standard deviation instead of the
population.
(c)
Student uses the statistical tables incorrectly.
(d)
Student uses the statistical tables incorrectly
and uses the sample standard deviation.
A well designed question should force the application of knowledge to discriminate
between the choices.
Plausible alternatives should be designed so that selection canhelp to reveal common misunderstandings. In Table 2. if a majority selected option (b) the tutor knows that there is an issue with the students’ understanding of this concept because the option is both plausible but based on a definable error.
Discussion is important, however, because sometimes misunderstandings can arise for unexpected reasons, as our data below suggest.
Observational notes
22
Citation:
Green,K., Longman, D. (2012) ‘Polling Learning: Modelling the use of technology in
classroom questioning‘Tean Journal 4 (3) October [Online]. Available at:
http://bit.ly/AtMwtr (Accessed 28 October 2012).
Some key themes are apparent in these observations. Whereas we expected to find in the clicker data clear implications for guiding the teaching, it was more subtle than that. There were distinct changes in the interactive elements of the teaching from the outset, for example the use of ‘question-and-delayed-answer’ as a tool of formative feedback was rendered more effective because more thinking time was introduced into the students' consideration of their responses. The structuring effects of the clicker questions induced a 'whole-class' level of engagement and the students visibly applied more extended thought and consideration to their choices. As noted in the group survey (see below), it is easy to see why this happens. In less structured situations engagement is achieved more selectively and more often under the control of the teacher such as when a teacher asks for ‘hands up’. In these circumstances a division quickly emerges - only some of the class routinely answer or are asked to answer the question, so the majority turn off. Moreover, research and practice suggests that it is usually the same subset of the class who participate in these teacher-led question-answer episodes (see Wiliam, 2010 for an interesting case study).
This engagement effect was dramatic and noticeable although early on there was a distinct reluctance to engage:
26 Sep 2011: The opening question of this first session ‘What do you understand by
statistical inference?’ was met with complete silence! With some coaxing T was able to draw out some hesitant responses. S are reluctant, palpably shrinking from the obvious risks associated with answering an open-ended question about a new topic! Later in the same session after the first few clicker questions had been tried:
26 Sep 2011: T: ‘Clickers at the ready ...’ S: ‘Oh god, I was relaxed until then ...’
However, a more critical engagement with the subject matter soon emerged; reflection and engagement increased when the clickers were in play:
03 Oct 2011: By deliberately engaging everyone in giving an answer, the spread of
understanding across the group is quickly displayed.
For the teacher the graphical display of the responses is a win-win situation: if the results are varied or the majority have chosen the wrong answer, the opportunity for analytical discussion is great but even if 100% of the group have chosen the correct option, exploratory discussion is still possible: ‘why did you all choose this?’ An emergent aspect of these discussions was the importance of language use and how this affected understanding. While this is a well-known phenomenon in
23
Citation:
Green,K., Longman, D. (2012) ‘Polling Learning: Modelling the use of technology in
classroom questioning‘Tean Journal 4 (3) October [Online]. Available at:
http://bit.ly/AtMwtr (Accessed 28 October 2012).
17Oct2011: Discussing the answers is very constructive; it is also low risk since all
can join in without feeling either isolated or exposed. Discussion about question seven raised issues about language - e.g. the use of the phrase ‘two samples’ - the language is deceptive and needs careful interpretation.
The integration of the clickers into the fabric of the workshop sessions was
straightforward yet very effective in changing in subtle ways the participation of the students and, importantly, in enhancing the focus of teaching time spent on higher order mathematical discussion.
Summary of response data
The software supplied as part of the clickers package (TurningPoint, 2010)
facilitates a wide range of question presentation formats and procedures and in turn many and various data tables are generated by the software. Some of these tables were used to create individual reports which were sent via mail merge to each student
The data can also be used to provide more detailed feedback to the tutor about the relation between tutor input and student learning. The following table displays the overall results for the five sessions on Statistical Inference:
Table 3.
The overall results for the first five sessions (10 questions per session).
Session
1
2
3
4
5
Mean
87.3% 54.17% 85.46% 77.3% 79.0%
SD
21.3
28.3
13.1
29.0
14.6
24
Citation:
Green,K., Longman, D. (2012) ‘Polling Learning: Modelling the use of technology in
classroom questioning‘Tean Journal 4 (3) October [Online]. Available at:
http://bit.ly/AtMwtr (Accessed 28 October 2012).
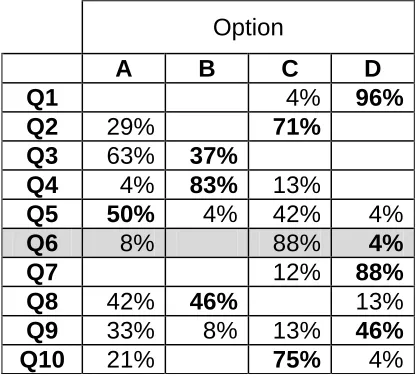
Table 4.
Results for one session. Correct responses in bold. Q6 is an outlier.
Option
A
B
C
D
Q1
4%
96%
Q2
29%
71%
Q3
63%
37%
Q4
4%
83%
13%
Q5
50%
4%
42%
4%
Q6
8%
88%
4%
Q7
12%
88%
Q8
42%
46%
13%
Q9
33%
8%
13%
46%
Q10
21%
75%
4%
Question six was:
‘Anxiety influences performance in examinations’. Of what is this an example?’ The prescribed correct option was ‘Not a hypothesis’ (option (d)). However, the majority of the cohort selected option (c) 'Alternative Hypothesis'. In designing the question the tutor had reasoned correctly that anxiety cannot be meaningfully measured, therefore the statement 'Anxiety influences performance in
examinations' cannot be a hypothesis. In selecting option (c) many students clearly did not read the question item in a critical manner by considering the terms of the question. They may have dealt with the question in logical rather than empirical terms, e.g. the logically similar statement 'Age influences performance in
examinations' is a hypothesis because ‘age’ is readily measured, ‘anxiety’ is not.
Student Feedback
An online feedback survey was undertaken at the end of the module. This invited open-ended responses that focussed on the learning, the teaching, and the use and effectiveness of the clickers. As outlined in the introduction, the particular
characteristics of the students in this case study can render degree level
mathematics particularly challenging. Questions one and seven addressed issues of learner confidence; questions six and seven addressed specific aspects of revision and retention; two, three and five focussed on issues of concept learning and the language of mathematical discourse, while question four invited comments about perceivable differences in the teaching style adopted for the sessions.
25
Citation:
Green,K., Longman, D. (2012) ‘Polling Learning: Modelling the use of technology in
classroom questioning‘Tean Journal 4 (3) October [Online]. Available at:
http://bit.ly/AtMwtr (Accessed 28 October 2012).
‘My confidence to begin with was low, and I was nervous to answer questions in case it was incorrect. As time went on I was happy to use the clickers and was quite shocked to find out that I understood more than I thought I understood.’ ‘ ... By the end I felt very relaxed in answering questions, even when I got them wrong, ... the tool actually increased my confidence in lectures knowing that I was on the right track, or just shifting me slightly if I was not!’
Some highlighted the way in which correct versus incorrect answers became less important with the focus shifting to discussion about the reasons why some answers were correct:
‘... you [did not stand out] during the lesson if you got the answer wrong, but ... the discussion as to why you chose that question ... explained [why you got it wrong].’
An interesting and important observation, repeated several times, was the way in which the clickers encouraged wider participation in engagement with formative questions:
‘It gave everyone [a] chance to answer, in many lessons the same people answer repeatedly which is very off putting to others.’
Question seven asked about student confidence in approaching the end of module examination. Students were positive and, given the high stakes character of examinations, such shifts in confidence are important to the quality of the student learning experience:
‘Yes the use of clickers was a positive outcome. I was more confident during lectures therefore I entered the exams with more confidence.’
‘It made me more confident because I had addressed my problems in the lesson, rather than stewing about them afterwards and getting the wrong end of the stick.’
The importance of language in mathematics became clear, particularly during the classes on statistical inference. Much in-class discussion focussed on the meaning of the words used to express a statistical idea. Question two asked for responses on this point:
‘...it soon became apparent that 'English' was the most difficult thing about maths.’ ‘It was an excellent way of identifying how to read the questions as quite often it was the wording that threw a lot of people and not the maths! It definitely has made me more aware during exams of how to read a question thoroughly e.g. matrices questions relating to which order you do the transformations.’
Questions three and five addressed the issue of learning mathematics and
26
Citation:
Green,K., Longman, D. (2012) ‘Polling Learning: Modelling the use of technology in
classroom questioning‘Tean Journal 4 (3) October [Online]. Available at:
http://bit.ly/AtMwtr (Accessed 28 October 2012).
‘... where answers were very similar ... misconceptions would lead you to the wrong answer. This would lead to discussion to iron out those misconceptions if needed.’ This remark also indicates that the design of the multiple-choice questions worked well to ensure that students were presented with choices that required active discrimination.
Two key aspects that made this possible was the public and shared discussion about the reasons why some answers were incorrect and also that
misunderstandings were exposed to the individual immediately (but anonymously): ‘... having a definite answer immediately which was discussed afterwards help to nip any misconceptions in the bud before they had chance to fester!’
‘The real time feedback ensured that I understood the topics as we went along rather than having a misconception and continuing through the lesson getting further confused.’
It was also noted that this helps the tutor too:
‘... it was a great opportunity for the lecturer ... to find out why so many of us got it wrong and how to stop this from happening again ...’
‘... it [gave] the lecturer the ability to access where the weak areas were. ... all answers were covered and explained, showing right [from] wrong, ... and why they were different.’
An interesting set of comments emerged in response to question four about
perceived changes in the teaching approach taken in the sessions and particularly the way it involved the whole group:
‘Sometimes it is all too easy to wait for our peers to answer a question ... having a clicker meant that we had ... to consider what we would put as an answer and not ... wait for a peer to respond.’
‘... the clickers highlighted areas that the majority of the class were not following, which led to going over the area again, rather than a small minority answering the questions ... and the lesson moving forward with a large majority not sure over an area.’
Conclusion
27
Citation:
Green,K., Longman, D. (2012) ‘Polling Learning: Modelling the use of technology in
classroom questioning‘Tean Journal 4 (3) October [Online]. Available at:
http://bit.ly/AtMwtr (Accessed 28 October 2012).
content where the language used in describing, explaining and discussing mathematical ideas was sometimes a cause of misunderstanding or error.
Kilhamn (2011) explored some of the negative effects of language and
metaphorical models on mathematical learning among primary school children. Kotsopoulos (2007) describes the use of a 'mathematical register' by teachers, which is literally a tone of voice coupled with unfamiliar uses of everyday language, obscure technical vocabulary and, like Kilhamn, inaccessible metaphors. Lee (2006) devotes an entire book to detailed pedagogical guidance on the use of language for mathematics teachers. Haylock (2010), in a section on difficulties in mathematical language, similarly points to the use of unfamiliar technical vocabulary, the use of ordinary English words in unusual ways, and the complexity of the grammatical forms used to express mathematics statements and problems. In a similar vein Fisher-Hoch and Hughes (1996) report their analysis of the complex issues
associated with writing clear and accessible GCSE mathematics questions that can be properly understood by candidates. In reviewing the responses of students to a sample examination, they found that at least one third of all the difficulties they encountered involved the language of the question.
As indicated in the survey responses, the students’ use of the clickers was
overwhelmingly positive because some important shifts in the pedagogical pattern of the classes occurred. Individually, students were afforded more extended
thinking time and, collectively, the group was involved simultaneously in the reflection on mathematical concepts. This helped to reveal both to individuals and to the tutor patterns of misunderstanding and to provide consolidation or
reinforcement of knowledge. For individuals, especially those who did experience difficulty with some of the material, there was a comforting and therefore
productive safety in these changed social conditions of classroom learning. Students were more confident about their incorrect answers and felt more able to consider their misunderstandings constructively.
For the tutor, response data generated by the software proved invaluable in
exploring both particular and general cases. Patterns of responses could be used to focus on areas of difficulty as well as to critique question design. In-class
discussions were more structured and, because the level of participation was so high, these discussions were more focussed on reasoning about why certain answers are correct rather than others (as the example above illustrates).
There are practical, technical issues to be considered. The development of
28
Citation:
Green,K., Longman, D. (2012) ‘Polling Learning: Modelling the use of technology in
classroom questioning‘Tean Journal 4 (3) October [Online]. Available at:
http://bit.ly/AtMwtr (Accessed 28 October 2012).
strategy and policy change frequently and sometimes dramatically. Designing and maintaining effective and topical resources for such domains represents a
potentially significant time overhead.
Similarly, using the response data effectively to show patterns of learning for both individuals and groups requires a commitment of time and skill in simple data processing. While the TurningPoint software could be improved there will always be some areas where staff development would be needed in order to get the best out of the data. While much of the previous research has concentrated on the use of clickers to enhance student engagement in teaching and learning, this project has also emphasised the value of the response data for guiding a lecturer’s formative judgments in directing the teaching towards more effective learning (for similar work see Green et al, 2009).
The key outcomes from this project have been pedagogical not technical. We did not aim to demonstrate the operability of the technology, nor the features of the software. Instead, we set out with positive pedagogical goals to improve the teaching and learning of mathematics for trainee mathematics teachers. These goals were embodied in the design of the main teaching resource as well as in the sequencing of the material. We utilised the quantitative data to guide the teaching, particularly in relation to cohort level patterns of response. What was most striking was the enhancement that was brought to the quality of the discussion phases of the workshops. The student feedback particularly illustrated how, for them, these parts of the workshops improved their confidence in talking about mathematical ideas that in turn helped them to think more constructively about their own misunderstandings. This sharpening of the focus of teacher-student interactions during workshops enhanced the teaching through more fine-grained feedback on the variations in student learning.
References
Caldwell, J.E. (2007). Clickers in the Large Classroom: Current Research and Best-Practice Tips. Life Sciences Education, 6, 1, 9-20, Available online at:
http://www.lifescied.org/cgi/content/full/6/1/9 (Accessed 19 January 2011). Fisher, D. and Frey, N. (2010) Guided Instruction: How to Develop Confident and
Successful Learners. (Alexandria,V.A, Association for Supervision & Curriculum Development).
Fisher-Hoch, H. and Hughes, S. (1996). What Makes Mathematics Exam Questions Difficult?. British Educational Research Association. Available online at: http://www.cambridgeassessment.org.uk/ca/digitalAssets/113963_What_Mak es_Mathematics_Examination_Questions_Difficult.pdf. (Accessed 20 July 2011).
29
Citation:
Green,K., Longman, D. (2012) ‘Polling Learning: Modelling the use of technology in
classroom questioning‘Tean Journal 4 (3) October [Online]. Available at:
http://bit.ly/AtMwtr (Accessed 28 October 2012).
Development in Teacher Education. Paper presented at the 5th Annual
Escalate ITE Conference: Initial Teacher Education -Towards a New Era, May 15.
Haylock, D. and Thangata, F. (2010) Key Concepts in Teaching Primary Mathematics (London, Sage Publications Ltd).
Kilhamn, C. 2011. Making Sense of Negative Numbers. Doctoral Thesis. University of Gothenburg. Available online at:
https://gupea.ub.gu.se/handle/2077/24151 (Accessed 10 August 2012). Kotsopoulos, D. 2007. Mathematics Discourse: It’s Like Hearing a Foreign
Language. Mathematics Teacher 101(4), 301 – 305.
Latessa R and Mouw, MD 2005. Audience Response Systems For Medical Teaching. Family Medicine, 37, 1 (Jan 2005), 12-14. Available on line at:
http://www.audienceresponseinfo.com/use-of-an-audience-response-system-to-augment-interactive-learning/ (Accessed 18 July 2012)
Lee, C. 2006. Language for Learning Mathematics: Assessment for Learning in Practice (New York, McGraw-Hill International).
Retkute, R. 2009. Exploring Technology-Based Continuous Assessment via
Electronic Voting Systems in Mathematics and Statistics. MSOR Connections 9 (1) pp24-28. Available online at:
http://mathstore.ac.uk/headocs/9124_retkute_r_evs.pdf (Accessed 21 May 2012)
Robinson, C. and King S. 2009. Introducing Electronic Voting Systems into the teaching of Mathematics. MSOR Connections 9, (1) pp.29-33. Available online at: http://www.ltsn.gla.ac.uk/headocs/9129_robinson_c_and_king_s_evs.pdf (Accessed 04 February 2011).
TEAN (Teacher Education Advancement Network) (2012) 3rd Teacher Education Advancement Network Annual Conference. Available online at:
http://www.cumbria.ac.uk/AboutUs/Subjects/Education/Research/TEAN/Diary OfEvents/ThirdTEANConference.aspx (Accessed 23 May 2012).
TurningPoint (2010)Home Page. Available online at:
http://www.turningtechnologies.co.uk/ (Accessed 21 January2012).
Wiliam, D. 2010. BBC. The Classroom Experiment. [Video]. Episode 2. Available online at: http://www.bbc.co.uk/programmes/b00txzwp
(Accessed 23 May 2012).