Volume 16 Number 4 pp. 808–815 CThe Authors 2013 doi:10.1017/thg.2013.44
Twin–Singleton Differences in Cognitive Abilities
in a Sample of Africans in Nigeria
Yoon-Mi Hur1and Richard Lynn2
1Mokpo National University, Jeonnam, South Korea 2University of Ulster, Coleraine, Northern Ireland, UK
Recent studies comparing cognitive abilities between contemporary twins and singletons in developed countries have suggested that twin deficits in cognitive abilities no longer exist. We examined cognitive abilities in a sample of twins and singletons born recently in Nigeria to determine whether recent findings can be replicated in developing countries. Our sample consisted of 413 pairs of twins and 280 singletons collected from over 45 public schools in Abuja and its neighboring states in Nigeria. The ages of twins and singletons ranged from 9 to 20 years with a mean (SD) of 14.6 years (2.2 years) for twins and 16.1 years (1.8 years) for singletons. Zygosity of the same-sex twins was determined by analysis of 16 deoxyribonu-cleic acid markers. We asked participants to complete a questionnaire booklet that included Standard Progressive Matrices-Plus Version (SPM+), Mill-Hill Vocabulary Scale (MHV), Family Assets Questionnaire, and demographic questions. The data were corrected for sex and age and then analyzed using maximum likelihood model-fitting analysis. Although twins and singletons were comparable in family social class indicators, singletons did better than twins across all the tests (d=0.10 to 0.35). The average ofd for SPM+total [0.32; equivalent to 4.8 Intelligence Quotient (IQ) points] andd for MHV (0.24; equivalent to 3.6 IQ points) was 0.28 (equivalent to 4.2 IQ points), similar to the twin–singleton gap found in old cohorts in developed countries. We speculate that malnutrition, poor health, and educational systems in Nigeria may explain the persistence of twin deficits in cognitive abilities found in our sample.
Keywords: cognitive abilities, Raven progressive matrices plus, mill hill vocabulary, twin, singleton, Africans
With the rapid growth of twin studies in psychology in recent years (Hur & Craig, 2013), the issue of whether twins differ from singletons in cognitive abilities has become of considerable interest to researchers in the field of cognitive abilities as well as to twin researchers. Studies of twin– singleton differences in cognitive abilities are important in at least two ways. First, the study results can help understand causal factors in the development of cognitive abilities in a population. Second, the results can influence generalization of the findings of twin studies of cognitive abilities to the singleton population as the twin method assumes that the trait under study is similar in twins and singletons.
A recent meta-analysis by Voracek and Haubner (2008), based on comparisons of more than 30,000 twins with about 1.6 million singletons collected from six countries, yielded a conclusion that singletons have 4.2 points (28% of aSD) higher Intelligence Quotient (IQ) than do twins. This dif-ference was significant (p < 10-9) and consistent across sexes, zygosity, and all domains of cognitive abilities,
al-though the conclusion was limited because the majority of the samples included in the meta-analysis were children and adolescents born before 1980. The meta-analysis also found that twin–singleton differences were larger in older birth cohorts (born before 1980) than in more contem-porary birth cohorts (born after 1980). There is a general consensus among researchers that twin–singleton differ-ences in cognitive abilities are largely due to impaired fetal growth and high perinatal risk factors in twins because twin–singleton differences in cognitive abilities tend to be reduced or disappear when the data are corrected for birth weight and gestational age (Calvin et al., 2009; Christensen et al., 2006).
RECEIVED29 April 2013;ACCEPTED18 May 2013.
few studies on twin–singleton differences in cognitive abil-ities have been published. For example, using Norwegian national military conscript data, Eriksen et al. (2012) com-pared intelligence scores between young adult male twins and singletons (age 18-20 years) in the same families. Twins and singletons were born between 1967 and 1984. The au-thors found that the intelligence scores of the singletons were 11% (95% confidence interval: 9–14%) of aSDhigher than those of the twins after correction for birth year, birth order, parental ages at delivery, and parental education lev-els. Eriksen et al. (2012) speculated that the twin–singleton difference in the Norwegian sample was smaller as com-pared to the difference found in the meta-analysis because Norwegian participants were young adults, suggesting that the twin disadvantage in cognitive abilities may become smaller with increasing age.
In a study in Taiwan, Tsou et al. (2008) linked the nation-wide registers of college entrance examination taken at the age of 18 years with the national birth records of 1983 to 1985 and compared the performance level between twins and singletons. The authors found that twins had signifi-cantly (about 5% of aSD) lower mean test scores and a 2.2% lower probability of attending college than did singletons after the data were adjusted for birth weight, gestational age, birth order, sex, and the parental socio-economic charac-teristics. It should be noted that as the participants in the Tsou et al. (2008) study were those who took a college en-trance examination, it is likely that adolescents with very low cognitive abilities were not included in the sample. If low cognitive abilities were more common among twins than among singletons, then the difference in academic perfor-mance between twins and singletons in the study by Tsou’s et al. (2008) could have been an underestimate. Given pre-vious findings that academic performance is influenced by shared family environmental factors (Luo et al., 2003; Petrill & Thompson, 1993), the results of the Tsou et al. study sug-gest that postnatal family environmental factors important for academic performance may be different between twins and singletons in Taiwan.
However, the findings of the Tsou et al. (2008) study are not consistent with those of a similar population-based study conducted in Denmark (Christensen et al., 2006). The Danish study compared academic performance of adoles-cent twins and singletons (age 15 or 16) born between 1986 and 1988 and reported that differences in academic perfor-mance between the two groups were negligible after the data were adjusted for various confounding factors such as birth weight and gestational age. Calvin et al. (2009) examined the scores of cognitive ability tests and national educational at-tainment examinations in a large, population-based sample of 11-year-old twins and singletons attending state schools in England in 2004. In this recent cohort, sample scores of twins were nearly identical to those of singletons across all measures of cognitive abilities and all participants of
Calvin et al. (2009) and Christensen et al. (2006) concluded that a cognitive disadvantage found among twins in old co-horts disappeared in contemporary coco-horts, possibly due to recent improvements in obstetric and pediatric practices.
To investigate the change of twin deficit in cognitive abil-ities during childhood, Webbink et al. (2008) carried out a longitudinal study to compare IQ and academic achieve-ment in twins and singletons who went to primary schools in the Netherlands from 1994 to 2003. Webbink et al. (2008) found that twins were 16% to 17% of aSDlower than sin-gletons in scores of language and arithmetic exams at age 6 years, 2% to 5% of aSDlower at age 8 years, and nearly identical to singletons at ages 10 and 12 years, suggesting that differences in academic achievement between twins and singletons gradually diminish from ages 6 to 12. The IQ test scores were very similar in twins and singletons across all ages, with the largest difference being less than 1 IQ point. In addition to children, Webbink et al. (2008) examined IQ scores in adult twins and singletons and found little difference. These results largely corroborate with the Calvin et al. (2009) study, indicating that in recent cohorts, a catch-up growth in cognitive abilities occurs in twins dur-ing childhood which leads the twin–sdur-ingleton difference to disappear by the end of primary school education. Although Webbink et al. (2008) and Calvin et al. (2009) studies were based on large representative samples of children, neither of these studies actually recruited or tested zygosity of twins.
In summary, the results of prior studies suggest that twin–singleton differences in cognitive abilities observed in old cohorts tend to attenuate in contemporary cohorts, and that while the differences were pronounced during child-hood, they tend to decline with age and become negligible in early adolescence. However, a limitation of prior studies is that all the studies on twin–singleton differences were conducted in highly developed countries where obstetric and pediatric practices are well advanced and qualities of health and educational systems are high. Thus, findings of the studies to date may not generalize to populations living in developing countries. In the present study, we investi-gated twin–singleton differences in cognitive abilities in a sample of Africans in Nigeria. Although participants in our study were children and adolescents born recently (1991 to 2002), we expected that contrary to recent findings from most Western countries, the twin disadvantage in cognitive abilities might be observed.
Methods
Sample
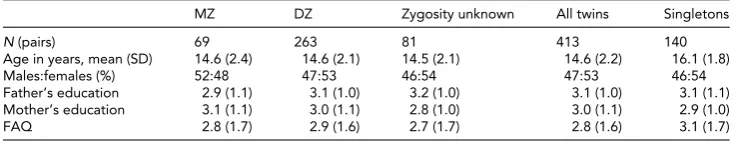
TABLE 1
Demographic Characteristics of the Twin and Singleton Sample
MZ DZ Zygosity unknown All twins Singletons
N (pairs) 69 263 81 413 140
Age in years, mean (SD) 14.6 (2.4) 14.6 (2.1) 14.5 (2.1) 14.6 (2.2) 16.1 (1.8)
Males:females (%) 52:48 47:53 46:54 47:53 46:54
Father’s education 2.9 (1.1) 3.1 (1.0) 3.2 (1.0) 3.1 (1.0) 3.1 (1.1)
Mother’s education 3.1 (1.1) 3.0 (1.1) 2.8 (1.0) 3.0 (1.1) 2.9 (1.0)
FAQ 2.8 (1.7) 2.9 (1.6) 2.7 (1.7) 2.8 (1.6) 3.1 (1.7)
Note: MZ=monozygotic twins; DZ=dizygotic twins; zygosity unknown=twin pairs whose zygosity was not determined
(see the text for further details); FAQ=family assets questionnaire.
Gwagwalada, Kuje, Kwali, and Municipal), and Ekiti, Nas-sarawa, and Benue states in Nigeria (Table 1). We collected the sample mainly from Abuja because the city includes areas from very urban to very rural and the residents consist of immigrants from many places in Nigeria and therefore represent fairly well the Nigerian population.
Singletons were comprised of 140 pairs of full siblings. The ages of twins and singletons at the time of testing ranged from 9 to 20 years with a mean (SD) of 14.6 years (2.2 years) for twins and 16.1 years (1.8 years) for singletons. The pairs of full singletons in our sample were unrelated to twins, but they attended the same school where twins were enrolled at the time of testing, and reported themselves as having the same father and mother. This recruitment strategy enabled us to control for school environment and neighborhood characteristics that were similar in twins and singletons who participated in this study.
Zygosity of the same-sex twins was determined by analy-sis of deoxyribonucleic acid (DNA, 15 microsatellite mark-ers and amelogenin marker) extracted from twins’ saliva or buccal sample. Opposite-sex twins were automatically assigned to DZ twins. The present sample also included 81 pairs of twins whose zygosity was unknown because they refused to give us their saliva sample (mostly for religious reason) or their saliva sample was unusable. The number of DZ twins in our sample was much higher than that of MZ twins. This higher rate of DZ twins as compared to the rate of MZ twins likely reflected the higher rate of DZ twin birth in Nigerians (Bulmer, 1970; MacGillivray, 1986) as well as higher prenatal and infant mortality rates in MZ than in DZ twins (Hall, 2003). Among the Yoroba of Nigeria, the MZ and DZ twin birth rates have been recorded to be, respec-tively, 5 and 49 pairs per 1,000 maternities (MacGillivray, 1986).
A detailed account of the recruitment procedure and the study protocol can be found in Hur et al. (2013). Briefly, with a letter of permission issued by Education Boards in Nige-ria, we visited junior and senior secondary public schools with large enrollment (typically greater than 500 students) in different administrative areas and gave tests and ques-tionnaires to twins and singletons in a library or classroom in the school. Typically, one or two research assistants were
assigned to each testing room to help participants to com-plete cognitive ability tests and questionnaires explained be-low. Teachers were also invited to help administer the tests and questionnaires. Written informed consent was obtained from all participants and/or their guardians.
Measures
Standard progressive matrices-plus version (SPM+).
The SPM+(Raven, 2008) is a non-verbal measure of general (fluid) ability. Because the SPM+is a non-verbal measure, it can be used for participants from diverse populations with different language and cultural backgrounds. It consists of 60 items of non-verbal stimuli that include visual matrix of patterns and shapes, and is useful for children aged seven years and above. Each matrix has one piece missing. Partic-ipants are requested to choose the missing pattern from a choice of six or eight. The 60 items (matrices) are organized into five sets (A, B, C, D,andE) with 12 items each. The five sets are arranged in such a way that they become progres-sively more difficult. One point is assigned for each correct answer; the skipped items receive no points. We encouraged participants to try all items, and when items were skipped, assistants asked the participants to make their best guess. We did not impose a testing time so that participants could show their maximum performance.
In the present sample, the internal consistency reliability of 60 items of the SPM+total as measured by Cronbach’s
␣was 0.90; Cronbach’s␣for subsetsA, B, C, D, andEwere, respectively, 0.77, 0.87, 0.75, 0.53, and 0.33. These results show that the values of Cronbach’s␣are relatively high in the first three easier subsets, whereas they are relatively low in more difficult subsets,Dand E. It is likely that many participants made guesses on subsetsDandEbecause we forced participants to answer all items.
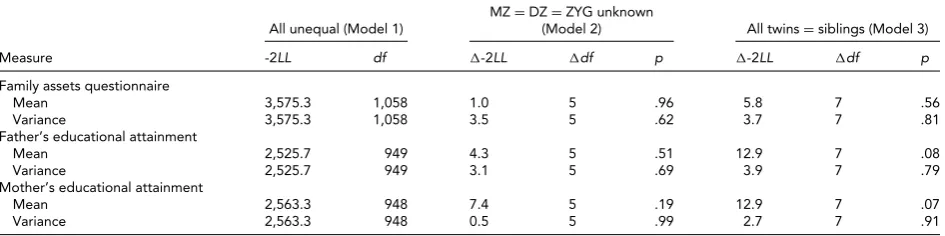
TABLE 2
Results of Fitting Models to Family Socio-economic Background Variables
All unequal (Model 1)
MZ=DZ=ZYG unknown
(Model 2) All twins=siblings (Model 3)
Measure -2LL df -2LL df p -2LL df p
Family assets questionnaire
Mean 3,575.3 1,058 1.0 5 .96 5.8 7 .56
Variance 3,575.3 1,058 3.5 5 .62 3.7 7 .81
Father’s educational attainment
Mean 2,525.7 949 4.3 5 .51 12.9 7 .08
Variance 2,525.7 949 3.1 5 .69 3.9 7 .79
Mother’s educational attainment
Mean 2,563.3 948 7.4 5 .19 12.9 7 .07
Variance 2,563.3 948 0.5 5 .99 2.7 7 .91
Note:df=degrees of freedom; -2LL=twice the negative log-likelihood; MZ=monozygotic twins; DZ=dizygotic twins; ZYG unknown=twin pairs whose
zygosity was not determined.
participants to try all items, and did not limit the testing time. One point is assigned for each correct answer. The internal consistency reliability of 44 items in the present sample was 0.76.
Family assets questionnaire (FAQ). FAQ was a measure of family socio-economic status that comprised eightyes/no
questions on whether they have valuable possessions at home (e.g., car, air conditioner, TV, refrigerator, computer, digital camera, washing machine, and vacuum cleaner). The answers were summed over eight items to obtain a total score.
Parental educational attainment. The questionnaire in-cluded items regarding the educational attainment of the participants’ fathers and mothers. This was coded into five categories as follows: no education (0), primary school graduation (1), junior secondary school graduation (2), senior secondary school graduation (3), and college gradu-ation and above (4).
Statistical Analysis
We performed structural-equation model-fitting analyses to test whether demographic variables such as father’s and mother’s educational attainment, the total scores of FAQ, MHV, and SPM+, and each subset of the SPM+were com-parable between MZ and DZ twins, and between twins and singletons. Using Mx (Neale et al., 2003), we conducted maximum likelihood analysis of raw data. The structural equation model-fitting analysis with Mx was chosen to con-trol dependency in the correlated data within families. Mx calculates twice the negative log-likelihood (-2LL) of the data. To test whether means and variances for the tests were equal between groups, we examined the difference in -2LL
between the full model (Model 1) where the means and vari-ances of the groups were set to vary, and the constrained models (Models 2 and 3) where the means and variances of the groups were set to be equal. The difference in -2LLis2
distributed with degrees of freedom equal to the difference in degrees of freedom. To control main effects of age and
sex, we treated age and sex as covariates for all variables in our model-fitting analyses.
We also computed the standardized effect size of differ-ence (d) to determine the magnitude of differences in SPM+ and MHV between twins and singletons;dwas defined as the absolute difference between group means divided by a pooled estimate of the standard deviation. According to Cohen (1988), an effect size of 0.2 represents a small effect, 0.5 represents a medium effect, and 0.8 represents a large effect.
Results
Demographic Characteristics
Table 1 presents demographic characteristics of twins and singletons. MZ, DZ, and zygosity unknown groups were not significantly different from each other in terms of age. However, singletons were slightly but significantly older than twins. Except for MZ twins, there were more female than male participants. Mother’s and father’s educational attainments were generally similar across all groups. On av-erage, parents of the participants in the present sample had completed senior secondary school (12 years of education). The scores of FAQ were similar across all groups.
Model-Fitting Analyses of Family Socio-Economic Background Variables
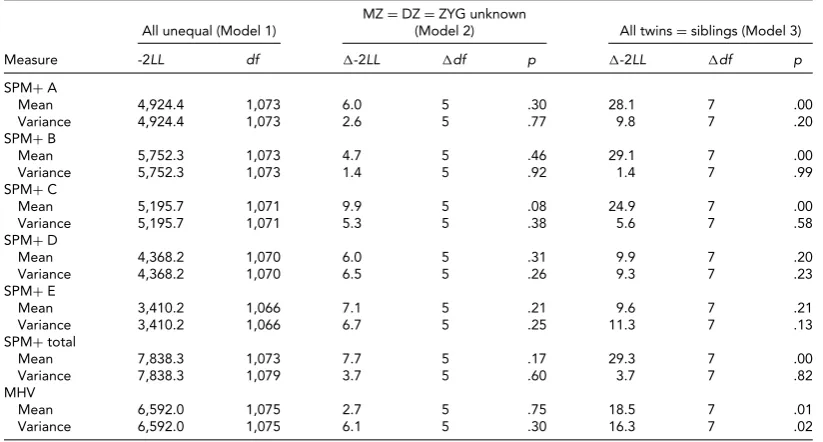
TABLE 3
Results of Fitting Models to SPM+Total and Its Subtests and MHV
All unequal (Model 1)
MZ=DZ=ZYG unknown
(Model 2) All twins=siblings (Model 3)
Measure -2LL df -2LL df p -2LL df p
SPM+A
Mean 4,924.4 1,073 6.0 5 .30 28.1 7 .00
Variance 4,924.4 1,073 2.6 5 .77 9.8 7 .20
SPM+B
Mean 5,752.3 1,073 4.7 5 .46 29.1 7 .00
Variance 5,752.3 1,073 1.4 5 .92 1.4 7 .99
SPM+C
Mean 5,195.7 1,071 9.9 5 .08 24.9 7 .00
Variance 5,195.7 1,071 5.3 5 .38 5.6 7 .58
SPM+D
Mean 4,368.2 1,070 6.0 5 .31 9.9 7 .20
Variance 4,368.2 1,070 6.5 5 .26 9.3 7 .23
SPM+E
Mean 3,410.2 1,066 7.1 5 .21 9.6 7 .21
Variance 3,410.2 1,066 6.7 5 .25 11.3 7 .13
SPM+total
Mean 7,838.3 1,073 7.7 5 .17 29.3 7 .00
Variance 7,838.3 1,079 3.7 5 .60 3.7 7 .82
MHV
Mean 6,592.0 1,075 2.7 5 .75 18.5 7 .01
Variance 6,592.0 1,075 6.1 5 .30 16.3 7 .02
Note: SPM+ =Standard Progressive Matrices-Plus version; MHV=Mill Hill Vocabulary Scales;df=degrees of freedom; -2LL=twice
the negative log-likelihood; MZ=monozygotic twins; DZ=dizygotic twins; ZYG unknown=twin pairs whose zygosity was not
determined (see the text for further details).
singletons and twins in the present sample were matched well in terms of family socio-economic background.
Model-Fitting Analyses of SPM+and MHV
Table 3 shows the results of fitting models to the data for SPM+ total and its subsets and MHV. In Model 2, we equated means and variances for the SPM+total and five subsets of the SPM+and MHV among the twin groups. The change in -2LLwas not significant in any of the tests, indicating that means and variances for cognitive abilities are comparable across different types of twins. These re-sults were consistent with those of prior studies (Voracek & Haubner, 2008). Next, we equated means for all twins with those for singletons (Model 3). On SPM+total and MHV, the changes in -2LLwere significant, suggesting that means for the overall test scores were significantly different between twins and singletons in both verbal and non-verbal measures. On the subtests of the SPM+, however, while the changes in -2LLwere significant for subsetsA, B, and C, they were not for subsetsDandE. When we equated vari-ances for all twins with those for singletons (Model 3), a significant change in -2LLoccurred only for one variable, MHV, suggesting that variances for cognitive abilities are generally comparable between twins and singletons.
Taken together, these results indicate that in general, twins are different from singletons in the mean level of cognitive abilities, but variances may be similar between the two groups.
Effect Sizes of Differences
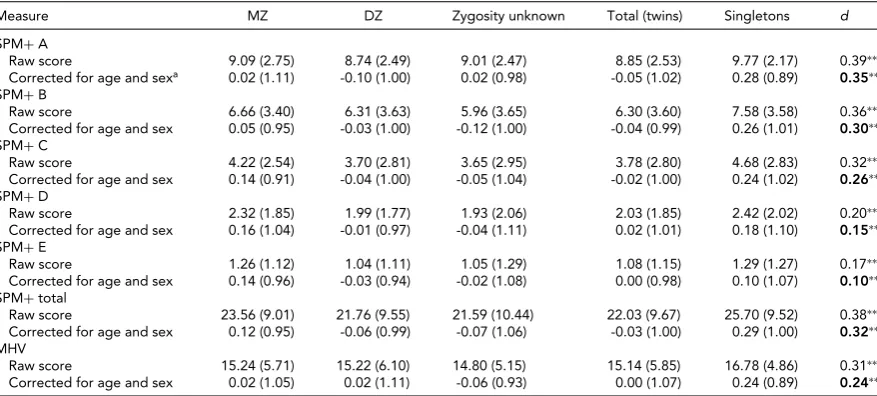
Table 4 presents means (SD) for the raw and age- and sex-corrected scores of each subset of the SPM+and the SPM+ total and the MHV for twins and singletons and the stan-dardized effect sizes of difference (d) in scores between twins and singletons. When singletons were compared to twins, mean scores for the former group were consistently higher than those for the latter group across all tests, indicating that singletons have generally higher cognitive abilities than do twins. As small but significant correlations were observed between age and test scores (r=0.10 to 0.16,p<.01) and males were slightly but significantly higher than females in the SPM+total (t=4.86,p<.01) and its subsets (t=2.64 to 5.67,p<.01), we adjusted all test scores for sex and age and standardized the residuals with a mean of zero andSD
of 1.0. For all tests,dwas slightly smaller for the age- and sex-corrected scores than for the raw scores, reflecting the presence of main effects of sex and age.Dvalues ranged from 0.10 to 0.35 for the age- and sex-corrected scores across all tests, while they ranged from 0.17 to 0.39 for the raw scores. In line with the results of model-fitting analyses in Table 3,
dvalues decreased progressively as the level of difficulty of the items increased.
Discussion
TABLE 4
Means (SD) for SPM+Total and Its Subtests and MHV for Twins and Singletons and the Standardized Effect Size of Difference (d) in Scores Between Twins and Singletons
Measure MZ DZ Zygosity unknown Total (twins) Singletons d
SPM+A
Raw score 9.09 (2.75) 8.74 (2.49) 9.01 (2.47) 8.85 (2.53) 9.77 (2.17) 0.39∗∗
Corrected for age and sexa 0.02 (1.11) -0.10 (1.00) 0.02 (0.98) -0.05 (1.02) 0.28 (0.89) 0.35∗∗
SPM+B
Raw score 6.66 (3.40) 6.31 (3.63) 5.96 (3.65) 6.30 (3.60) 7.58 (3.58) 0.36∗∗
Corrected for age and sex 0.05 (0.95) -0.03 (1.00) -0.12 (1.00) -0.04 (0.99) 0.26 (1.01) 0.30∗∗
SPM+C
Raw score 4.22 (2.54) 3.70 (2.81) 3.65 (2.95) 3.78 (2.80) 4.68 (2.83) 0.32∗∗
Corrected for age and sex 0.14 (0.91) -0.04 (1.00) -0.05 (1.04) -0.02 (1.00) 0.24 (1.02) 0.26∗∗
SPM+D
Raw score 2.32 (1.85) 1.99 (1.77) 1.93 (2.06) 2.03 (1.85) 2.42 (2.02) 0.20∗∗
Corrected for age and sex 0.16 (1.04) -0.01 (0.97) -0.04 (1.11) 0.02 (1.01) 0.18 (1.10) 0.15∗∗
SPM+E
Raw score 1.26 (1.12) 1.04 (1.11) 1.05 (1.29) 1.08 (1.15) 1.29 (1.27) 0.17∗∗
Corrected for age and sex 0.14 (0.96) -0.03 (0.94) -0.02 (1.08) 0.00 (0.98) 0.10 (1.07) 0.10∗∗
SPM+total
Raw score 23.56 (9.01) 21.76 (9.55) 21.59 (10.44) 22.03 (9.67) 25.70 (9.52) 0.38∗∗
Corrected for age and sex 0.12 (0.95) -0.06 (0.99) -0.07 (1.06) -0.03 (1.00) 0.29 (1.00) 0.32∗∗
MHV
Raw score 15.24 (5.71) 15.22 (6.10) 14.80 (5.15) 15.14 (5.85) 16.78 (4.86) 0.31∗∗
Corrected for age and sex 0.02 (1.05) 0.02 (1.11) -0.06 (0.93) 0.00 (1.07) 0.24 (0.89) 0.24∗∗
Note:∗p<.05,∗∗p<.01. MZ=monozygotic twins; DZ=dizygotic twins; Zygosity unknown=twin pairs whose zygosity was not determined (see
the text for further details).d=the absolute difference between group means divided by a pooled estimate of theSD; SPM+ =Standard
Progressive Matrices-Plus version; MHV=Mill Hill Vocabulary Scales.
aScores were adjusted for sex and age and standardized with a mean of zero and a standard deviation of 1.
cognitive abilities among Africans, as studies comparing twins and singletons to date have been carried out exclu-sively in European and Asian countries. While studies using contemporary twins and singletons (born in the late 1980s and 1990s) in Western developed countries have demon-strated that the twin deficit in cognitive abilities observed in the past disappeared by early adolescence, the present Nigerian sample, born in the 1990s and the early 2000s, indicated that the twin disadvantage in cognitive abilities still existed. The twin–singleton differences were demon-strated across verbal and non-verbal measures of cognitive abilities, although the latter (SPM+total) showed a larger difference than did the former (MHV). The average ofd
for SPM+total (0.32; equivalent to 4.8 IQ points) andd
for MHV (0.24; equivalent to 3.6 IQ points) found in the present sample was 0.28 (equivalent to 4.2 IQ points), which was almost identical to the twin–singleton difference (4.2 IQ points) reported in the meta-analysis based on earlier studies of Europeans (Voracek & Haubner, 2008). Overall, the data in the present sample mirrored the findings in old birth cohorts in developed countries.
On the subsets of SPM+, there was some inconsistency in model-fitting analysis results. Means were significantly higher in singletons than in twins only for subsetsA, B, andC, and not forD andE. It appears that mean differ-ences did not attain significance in the latter two subsets perhaps because reliabilities of the items for the two subsets were low due to difficulties of the items in the subsets. As indicated above, reliabilities dropped sharply in subsets D and E.
One should note that variances were generally similar in magnitude in twins and singletons across all measures except MHV. These results indicate that estimates of genetic and environmental influences on cognitive abilities derived from the classic twin design in the Nigerian population will be unlikely to be seriously biased because the twin method relies on decomposition of the variance rather than the mean level.
and prenatal period in children in Nigeria may be especially responsible for the cognitive disadvantage in twins found in the present study, as it has been shown that suboptimal nutrition impairs fluid intelligence more than crystallized intelligence (Lundgren et al., 2003) and nutritional supple-ments given to children raise their fluid intelligence more than their crystallized intelligence (Lynn, 1998; Lynn & Harland, 1998).
Our study is unique in that the data were collected from a developing country. However, there are some limitations that need to be mentioned. First, we were not able to collect birth weight or gestational age data because the vast major-ity of the participants did not know their birth weight or gestational age. However, a recent hospital sample in Nigeria showed that twins were significantly lower than singletons in the gestational age at delivery (34±5.2 weeks vs. 38.7± 2.4 weeks) and birth weight (2.3 kg ± 1.0 kg vs. 3.14 kg±0.73 kg; Obiechina et al., 2011). Prior studies based on participants in Western developed countries showed that after the twin–singleton IQ difference was adjusted for birth weight and gestational age, the difference was reduced by 50% to 30% as children (Ronalds et al., 2005), and dimin-ished to near zero as adults (Eriksen et al., 2012; Posthuma et al., 2000; Webbink et al., 2008). However, the question of whether or not Nigerian twins and singletons follow this developmental pattern remains to be answered in future studies. Second, although we collected twins and singletons from many public schools in Abuja and its neighboring states, our twin sample, especially MZ twins, may be some-what selected in terms of health because in our study we only included complete sets of twins who survived to age 9 years or above. Somewhat elevated scores in MZ twins in our sample (Table 4) probably reflected this selection bias. Given the well-known relationship between health and cog-nitive abilities (Deary, 2012; Lynn & Vanhanen, 2012), this selection, if any, may have resulted in an underestimation of the twin–singleton difference in our sample. Thus, it would be necessary in future research to replicate our findings us-ing samples from other low-income countries. Third, the sample size in the present study is relatively small, which limits the conclusions of our study to generalize to Nige-rians as a whole. However, one should note that the mean scores (22.03 and 25.70) on the SPM+of our twins and singletons are equivalent to British IQs of 65 (twins) and between 70 and 75 (singletons) according to the 2008 stan-dardization sample reported by Raven (2008). Given that twins have about 5 points of IQ deficit, our estimates are very close to the mean sub-Saharan African IQ of 67 esti-mated by Lynn (2006) on the basis of numerous studies in Africa, suggesting that our results might be generalized to sub-Saharan Africans in general. Finally, the participants in the present study were children and adolescents. Whether or not the twin–singleton gap in cognitive abilities found in the present sample continues into adulthood remains a topic worthy of further inquiry as the results will have
im-plications in determining the best time for intervention for cognitive development in children in low-income countries.
Acknowledgment
We thank the twins and singletons who participated in our study. Special thanks are given to the staff in the Educa-tion Boards and public school teachers and principals in Nigeria who assisted our study. The present study was sup-ported by the grant of the Pioneer Fund awarded to the first author.
References
Bobzom, D. N., & Audu, B. M. (1997). Outcome of twin preg-nancies in Maiduguri, Nigeria. Journal of Obstetrics and Gynaecology,17, 261–263.
Bulmer, M. G. (1970).The biology of twinning in man. Oxford, UK: Clarendon Press.
Calvin, C., Fernandes, C., Smith, P., Visscher, P. M., & Deary, I. J. (2009). Is there still a cognitive cost of being a twin in the UK?Intelligence,37, 243–248.
Christensen, K., Petersen, I., Skytthe, A., Herskind, A. M., McGue, M., & Bingley, P. (2006). Comparison of aca-demic performance of twins and singletons in adolescence: Follow-up study.British Medical Journal,333, 1095–1097. Cohen, J. (1988).Statistical power analysis for the behavioral
sciences. Hillsdale, NJ: Erlbaum.
Deary, I. J. (2012). Intelligence.The Annual Review of Psychol-ogy,63, 453–482.
Eriksen, W., Sundet, J. M., & Tambs, K. (2012). Twin-singleton differences in intelligence: A register-based birth cohort study of Norwegian males.Twin Research and Human Ge-netics,15, 649–655.
Ezechi, O. C., Fasubba, O. B., & Dare, F. O. (2000). Socioeco-nomic barriers to safe motherhood among booked patients in rural Nigerian communities.Journal of Obstetrics and Gynaecology,20, 32–34.
Hall, J. G. (2003). Twinning.Lancet,362, 735–743.
Hur, Y.-M., & Craig, M. J. (2013). Twin studies worldwide: An important resource for scientific research. Twin Research and Human Genetics,16, 1–12.
Hur, Y.-M., Kim, J. W., Chung, K. W., Shin, J. S., Jeong, H.-U., & Auta, E. (2013). The Nigerian twin and sibling registry. Twin Research and Human Genetics,16, 282–284.
Lundgren, E. M., Cnattingius, S., Jonsson, B., & Tuvemo, T. (2003). Birth characteristics and different dimensions of intellectual performance in young males: A nationwide population-based study.Acta Paediatrica,92, 1138–1143. Luo, D., Thompson, L. A., & Detterman, D. K. (2003).
Pheno-typic and behavioral genetic covariation between elemental cognitive components and scholastic measures.Behavior Genetics,33, 221–246.
analysis. Augusta, GA: Washington Summit Publishers. Lynn, R., & Harland, E. P. (1998). A positive effect of
iron supplementation on the IQs of iron deficient chil-dren. Personality and Individual Differences, 24, 883– 887.
Lynn, R., & Vanhanen, T. (2012).Intelligence: A unifying con-struct for the social sciences. London: Ulster Institute for Social Research.
MacGillivray, I. (1986). Epidemiology of twin pregnancy. Sem-inars in Perinatology,10, 4–8.
Neale, M. C., Boker, S. M., Xie, G., & Maes, H. (2003).Mx: Sta-tistical modeling. Richmond, VA: Department of Psychiatry, Virginia Commonwealth University.
Obiechina, N. J., Ololie, V. E., Eleje, G. U., Okechukwu, Z. C., & Anemeje, O. A. (2011). Twin versus singleton pregnancies: The incidence, pregnancy complications, and obstetric out-comes in a Nigerian tertiary hospital.International Journal of Women’s Health,3, 227–230.
Petrill, S. A., & Thompson, L. A. (1993). The phenotypic and genetic relationships among measures of cognitive ability,
ics,23, 511–518.
Posthuma, D., De Geus, E. J. C., Bliechrodt, N., & Boomsma, D. I. (2000). Twin-singleton differences in intelligence?Twin Research,3, 83–87.
Raven, J. (2008).Manual for Raven’s progressive matrices. Lon-don: Pearson.
Ronalds, G. A., De Stavola, B. L., & Leon, D. A. (2005). The cognitive cost of being a twin: Evidence from comparisons within families in the Aberdeen children of the 1950s cohort study.British Medical Journal,331, 1306.
Tsou, M. T., Tsou, M.-W., Wu, M.-P., & Liu, J.-T. (2008). Aca-demic achievement of twins and singletons in early adult-hood: Taiwanese cohort study.British Medical Journal,337, a438.
Voracek, M., & Haubner, T. (2008). Twin-singleton differences in intelligence: A meta-analysis.Psychological Report,102, 951–962.