IJEDR1702250
International Journal of Engineering Development and Research (www.ijedr.org)1596
A Comparison Study on Optimization of Process
Parameters between Die sinking EDM and WEDM
for Stainless Steel 304
1
Nishant,
2 Dr. Soupayan Mitra1 Post Graduate Scholar, Department of Mechanical Engineering, Jalpaiguri Govt. Engineering College, India 2 Associate Professor, Department of Mechanical Engineering, Jalpaiguri Govt. Engineering College, India
________________________________________________________________________________________________________
Abstract— Die sinking Electro Discharge Machining (EDM) and Wire Electro Discharge Machining (WEDM) are two important non-conventional machining processes. In this present study the process parameters which normally influence the metal removal rate (MRR) and surface roughness (SR) are optimized both for EDM and WEDM and compared for machining AISI 304 stainless steel. AISI 304 steel has good wear and abrasion resistance and the machining operations are conducted with the Tungsten carbide electrode as tool. Here the machining experiments are done following Taguchi L9 design to analyze the effect of three important machining parameters viz., discharge current, pulse on time, and applied voltage on material removal rate and surface roughness. The signal-to-noise ratios associated with the observed values in the experiments are determined and Analysis of variance (ANOVA) is done to ascertain the factors by which the response parameters viz., Material Removal Rate and Surface Roughness are most affected both for EDM and WEDM. The respective influence contribution of each of the machining parameters on response varies are also maintained
Keywords— EDM, WEDM, Material removal rate, Surface roughness, Taguchi method
I.INTRODUCTION
Non-conventional machining processes like Electro discharge machining (EDM) and wire electro discharge machining (WEDM) play important role in precision manufacturing industries like automobile, aerospace and sheet metal industries [1], especially for manufacturing of punch, dies, jigs and fixtures etc. Traditional machining processes are easy to implement and are used in much more occasions than non-conventional processes, however it is very difficult to machine complicated and complex shapes and hard materials like tool steels [1,2].Fig 1.1 and Fig 1.2 show the schematic diagrams of the working principle of EDM and WEDM processes.
The schematic of basis EDM process is shown in Fig 1.1. In die sinking EDM process [3,4,5] the work piece and tool are submerged into a non-conducting, dielectric fluid which is separated by a small gap for sparking. The dielectric fluid insulates the work piece from the tool and creates the resistance of electricity flow between the electrodes. The dielectric fluid may be typical hydrocarbon oil or de-ionized water. It also helps in cooling down the tool and work piece, clears the inter-electrode gap and concentrates the spark energy to a small cross sectional area under the electrode. Once adequate potential difference is applied by power supply across the small gap of work-piece and tool, high electrical discharge takes place in the form of spark at an interval of 10 of micro second and machining is accomplised.
Fig. 1.1 Schematic Diagram of Electric Discharge Machining.
IJEDR1702250
International Journal of Engineering Development and Research (www.ijedr.org)1597
Fig 1.2 Schematic Diagram of the working principle of WEDM process.
Experiment Design:
In the present analysis, Taguchi Design procedure has been followed for carrying out the experiments. Dr. Genichi Taguchi’s approach or DOE (Design of Experiment) is highly effective where it is suspected that there are more than one contributing factors to determine the quality or performance of a product or, process. Taguchi method recognizes that not all factors that cause variability can be controlled. These uncontrollable factors are called noise factors [8]. Taguchi designs try to identify controllable factors (control factors) that minimize the effect of the noise factors. The Taguchi methodology of experimentation is designed in such a way so that the major contributing factors of the process or product concerned are set in an optimum way which makes the process or product robust, or resistant to variation from the noise factors [9].
For Die Sinking EDM: In this machining process the controlling parameters and their levels are given in Table 1.1 following Taguchi’s L9 orthogonal array.
Table 1.1
Machining Symbol Unit Levels
parameter Level 1 Level 2 Level 3
Discharge
current Ip A 5 7 9
Pulse on time Ton µs 50 150 200
Voltage V V 45 55 65
For WEDM,
The controlling parameters and their levels are given [11] in Table 1.2 following Taguchi method.
Table 1.2
Machining control Parameter
Symbol Unit
Level 1 Level 2 Level 3 Pulse On
time
Ton µs 105 115 125 Pulse Off
time
Toff µs 75 85 95 Spark gap
Voltage
Sv V 40 50 60 Peak current IP A 10 15 20
OBSERVATION DATA
For Die Sinking EDM, the experiments are done for nine numbers of different combinations considering the three control parameters and MRR is calculated by taking weight of work piece before machining and after machining for each run. Each experiment is conducted for 10 minute i.e., for each experiment machining time is 10 minute. After each experiment surface roughness (SR) is measured. The experimental data and corresponding results are presented in Table 1.3 and Table 1.4.
Table 1.3
Run Ip Ton Voltage Wt. of work piece (in gm)
S. No. (A) (µs) (V) 𝑤𝑏𝑚 𝑤𝑎𝑚
1 5 50 45 150.592 150.356
IJEDR1702250
International Journal of Engineering Development and Research (www.ijedr.org)1598
3 5 200 65 150.030 149.758
4 7 50 55 149.758 149.371
5 7 150 65 149.371 148.886
6 7 200 45 148.886 148.358
7 9 50 65 148.358 147.883
8 9 150 45 147.883 147.145
9 9 200 55 147.145 146.464
Table 1.4
Run
Ip
Ton
Voltage
MRR
SR
no.
(A)
(µs)
(V)
(mm
3/min)
(µm)
1
5
50
45
2.9500
5.9333
2
5
150
55
4.0750
7.1333
3
5
200
65
3.4000
8.4000
4
7
50
55
4.8375
5.2667
5
7
150
65
6.0625
7.8000
6
7
200
45
6.6000
7.1333
7
9
50
65
5.9375
8.4000
8
9
150
45
9.2250
4.2000
9
9
200
55
8.5125
4.6667
For WEDM, similar to EDM, machining processes are carried out and the results obtained are shown in Table 1.5.
Table 1.5:
Ip Ton Toff Sv MRR SR
10 105 75 40 5.68 5.34
10 115 85 50 6.38 6.65
10 125 95 60 6.54 7.14
IJEDR1702250
International Journal of Engineering Development and Research (www.ijedr.org)1599
RESULT AND DISCUSSIONInfluence on MRR
Taguchi method is used to analysis the result of machining parameter for “larger is better” (since here the ‘response’ is MRR) criteria. The S/N ratios for MRR are calculated by using the equation (1)
LB: η = -10 log [1
𝑛
𝛴
ⅈ=1𝑛
𝑦ⅈ
−2] (1)Where, η denotes the S/N ratios calculated from observed values
𝑦ⅈ
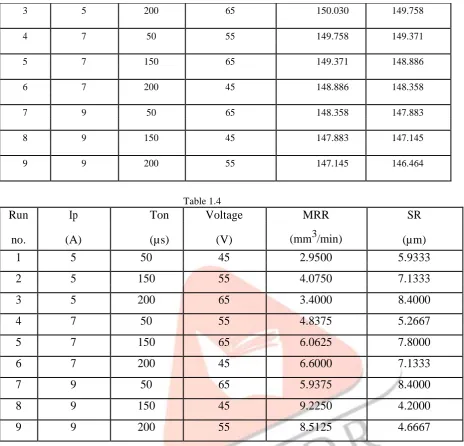
Represent the experimentally observed value of ith experiment n=1 is repeated number of each experiment in L-9 OrthogonalAnalysis of variance (ANOVA) is carried out for Die Sinking EDM, the results of which is shown in Table 1.6. This Table indicates that the discharge current is most significant factor while machining of AISI 304 Stainless steel with tungsten carbide tool after that pulse on time is also an important parameter and voltage is not significant factor during machining. Figure 1.3 represent that the main effect of S/N ratio on MRR by the factor.
Table 1.6
Analysis of Variance (MRR)
Effect Mean = 14.5931 Sigma = 3.40187
SS df MS F P
1 Ip 76.42654 2 38.21327 1857.607 0.000538
2 Ton 14.00673 2 7.00337 340.445 0.002929
3 V 2.10735 2 1.05367 51.221 0.019149
Residual error 0.04114 2 0.02057
Fig 1.3 – S/N ratio plot for MRR.
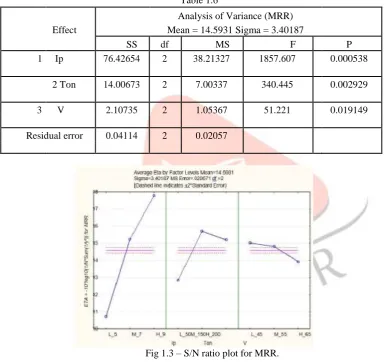
For WEDM, Table 1.7 shows the ANOVA values of MRR for each parameter level and are graphically represented in Figure 1.4
Table 1.7
S/N ratio (dB) %
Effect Level1 Level2 Level3 D SS V Contribution
Ip 15.83 17.67 17.98 2 5.2614 2.630 75.92
Ton 16.93 17.25 17.30 2 1.7186 0.859 12.41
Toff 16.41 17.56 17.51 2 0.3686 0.184 08.62
Sv 17.40 16.93 17.16 2 0.1338 0.066 03.05
IJEDR1702250
International Journal of Engineering Development and Research (www.ijedr.org)1600
Fig 1.4 S/N graph for MRR of WEDM
Generally the S/N ration are selected based on their characteristics; and a higher value of S/N represents the better performance. Therefore, out of all the three levels, the optimal level parameters are selected corresponding to the higher values of S/N ratio.
Influence on SR
Taguchi method is used to analysis the result of response (since here the ‘response’ is surface roughness) of machining parameter for “smaller is better”. The S/N ratio for Surface roughness are calculated by using the equation (2)
SB: η = -10log
[
1 𝑛𝛴
ⅈ=1𝑛
𝑦ⅈ
2]
(2) Where, η denotes the S/N ratios calculated from observed values
𝑦ⅈ
Represent the experimentally observed value of ith experiment n= 1 is repeated number of each experiment in L-9 OrthogonalFor Die Sinking EDM, ANOVA analysis (Table 1.8) is performed for EDM to know the % contribution of controlling parameters on ‘response’ i.e., surface roughness. It is observed that percentage contribution of voltage is about 65.64% and thus voltage has the maximum contribution or influence on the quality of surface roughness. The parameters such as discharge current (Ip) and pulse on time (Ton) has very less impact on surface quality of the work-piece.
n the Table 1.8, D.F. is the degree of freedom, SS is the sum of square, F is the Fisher value and % is the percentage of contribution of controlling parameter.
Table 1.8
Analysis of Variance (MRR)
Effect Mean = 14.5931 Sigma = 3.40187
SS df MS F P
1
Ip 76.42654 2 38.21327 1857.607 0.000538
Ton 14.00673 2 7.00337 340.445 0.002929
3
V 2.10735 2 1.05367 51.221 0.019149
Residual
IJEDR1702250
International Journal of Engineering Development and Research (www.ijedr.org)1601
Fig 1.5- S/N ratio plot of Surface Roughness for EDM
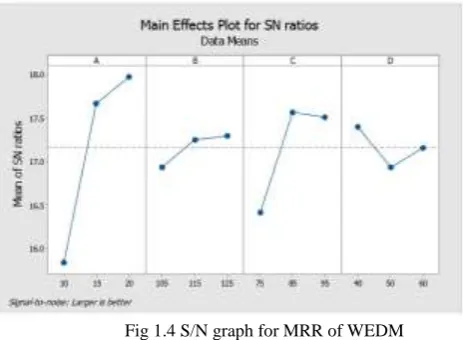
For WEDM, The ANOVA Table1.9 shows the effect of individual controlling parameters for WEDM. It is observed that, percentage contribution of the parameter Ton (24.59 % contribution) is most significant, Ip (64.83 % contribution) and Sv (06.02% contribution) are significant and Toff (04.56% contribution) is less significant on performance measures and are graphically represented in fig 1.6.
Table 1.9
S/N ratio (dB) %
Effect Level 1 Level 2 Level 3 D SS V Contribution
Ip -9.309 -8.252 -6.156 2 1.400 0.570 64.83
Ton -9.148 -7.671 -6.919 2 0.490 0.245 24.59
Toff -7.221 -7.228 -9.289 2 0.653 0.326 04.56
Sv -7.407 -7.708 -8.623 2 0.211 0.105 06.02
Total 8 2.7559
Fig 1.6- S/N graph for SR of WEDM. CONCLUSION
From the above analysis, it is evident that contribution of voltage on SR for EDM is 65.64 which is overwhelming but for WEDM it is 24.59 for pulse on time Ton and64.83 is for Ip. By comparing results for die sinking EDM and WEDM it can be further concluded that for MRR in Die sinking EDM increases linearly with some extent of current and decrease slightly with pulse on time where as in WEDM the discharge current is influencing factor then pulse on time and at last is voltage on the given input. In WEDM the S/N ratio shows that the surface quality of steel can be improved by reducing surface roughness using present statistical analysis. In Die sinking EDM the voltage is the effective parameter in case of surface roughness after that current and voltage are less effective on machined work piece.
REFERENCE
[1]ecoursesonline.iasri.res.in/mod/page/view.php?id=12848 [2] docsity.com/en/edm-lecture-notes/650915/
[3]www.scribd.com/document/29413913...-ANOVA-Die-Steel-H13 [4]www.ijera.com/papers/Vol5_issue11/Part- 1/A511010105.pdf
IJEDR1702250
International Journal of Engineering Development and Research (www.ijedr.org)1602
[6] Marafona J, Chousal J A G (2005). A finite element model of EDM based on the Joule effect. International Journal of Machine Tools & Manufacture, 46:1–8.[7] Luis C J, Puertas I, Villa G (2005) Material removal rate and electrode wear study on the EDM of silicon carbide. Journal of Materials Processing Technology, 164–165:889–896.
[8]G. Taguchi, E.A. Elsayed , T.C Hsiang `Quality Engineering in Production System`; McGraw-Hill 1989 & P.J. Ross
[9] P.J. Ross Taguchi techniques for quality engineering: loss function, orthogonal experiments, parameter and tolerance design’, , McGraw-Hill, 1996
[10]Dr. Soupayan Mitra, Nishant International Journal for Research in Engineering Application & Management ISO3297:2007 Volume 02,Issue 10 jan 2017