218
To Analyse The Effects Of Process Parameters
On Ig & Dd Of Ti-3al-2.5v Titanium Alloy (Grade 9)
On Wedm Using Taguchi Approach
Mohit Gulati, Rajiv Bharti, Dr. Raj KumarABSTRACT: WEDM is the most important machining method with which complex and complicated geometries can be easily machined. Based on exhaustive literature survey, it has been found that limited work has to be done on machining of Grade 9 Titanium alloy Ti-3Al-2.5V. Grade 9 Titanium alloy Ti-3Al-2.5V plate of 150mm×150mm×6mm is used for experimental purpose. The input process parameters pulse on time, pulse off time, spark gap set voltage and peak current are investigated to check their effects on performance characteristics like gap current & dimensional deviation. The ranges of process parameters are selected based on the literature survey. The experiments were designed using L9 orthogonal array with variation in process parameters. In this study MINITAB 15.0 software is used for designed the number of alternative experiments. The main aim of study is to check the effect of various process parameters on performance parameters.
Key words: WEDM; TON; TOFF; WT; WF; SV; IP; IG; DD
————————————————————
INTRODUCTION
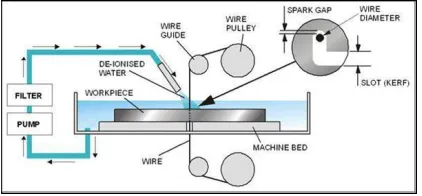
Wire Electrical discharge machining (WEDM) is a nontraditional, thermoelectric process which erodes material from the work piece by a series of discrete sparks between a work and tool electrode immersed in a liquid dielectric medium. These electrical discharges melt and vaporize minute amounts of the work material, which are then ejected and flushed away by the dielectric. The schematic representation of the WEDM cutting process is shown in Figure 1.
Figure 1: Schematic diagram of WEDM system
Singh and Garg, demonstrates the effects of various parameters of WEDM on machining of hot die steel H11 using one factor at a time approach. Different parameters are varied during experimentation. MRR is significantly increases with increase in pulse on time and peak current. Wire feed and wire speed are neutral parameters these parameters does not affect the material removal rate [1].
Aniza Aliasa et al made an effort to determine the important machining parameters viz. kerf width, MRR and SR. The main objective was to uncover the influence of three different machine rates which are 2 mm/min, 4 mm/min and 6 mm/min with constant current (6A) with WEDM of Titanium Ti-6Al-4V. The best combination of machining parameter viz. machine feed rate (4 mm/min), wire speed (8 m/min), wire tension (1.4kg) and voltage (60V) were identified [2]. The authors have done Experimentation on Inconel825 by using Taguchi’s L18 (21x37) orthogonal array. Analysis of the variance and the S/N ratios determined the importance of parameters and optimum parametric combination respectively for the response of surface roughness. Improved S/N ratio values and confirmation test results showed the possibility of improvement in surface finish using Taguchi’s method [3]. M M Dhobe et al analyzed the effect of various heat treatment processes and the machining parameters of WEDM like pulse on time (TON), pulse off time (TOFF), gap voltage (SV), peak current (IP) on the surface roughness of tool steel AISI D2. The surface roughness increases with increase in Pulse on time and Peak current, while decreases with increase in pulse off time and servo voltage. Similarly doubling the tempering after the hardening reduces surface roughness compared to single tempering [4]. The authors intended to study factors like pulse on time, pulse off time and wire feed for maximizations of MRR and minimization of SR in WEDM process using Taguchi Method. They optimized the parameters in the cutting of Cemented Tungsten Carbide. It was found that these parameters have significant influence on machining characteristics such as MRR and SR. The result of the work reveals that, the peak current significantly affects the SR and the pulse duration mainly affects the MRR [5]. BijoMathew et alapplied an effective Taguchi grey relational analysis to experimental results on AISI304. The experiment was done using Taguchi orthogonal array L27. The input parameters were pulse on time, pulse off time, servo voltage, wire feed, wire tension and dielectric pressure. The response table and grey relational grade for each level of machining parameters were established and the best combination of process parameters was obtained by Taguchi Grey relational analysis [6]. I. K. Chopde et al ________________________
Mohit Gulati, Rajiv Bharti, Dr. Raj Kumar
Research Scholar, Department of Mechanical Engineering, Galaxy Global Group of Institutions, Ambala. [email protected]
Professor, Department of Mechanical Engineering, Galaxy Global Group of Institutions, Ambala.
experimentally investigated the effect of process parameters on cryo treated AISI D 2 tool steel on wire electric discharge machining (WEDM). The factor Pulse on time (Ton) is the most significant factor, followed by the Spark gap voltage (Sv), Peak current (Ip) and Pulse off time (Toff). The confirmation test results and improved S/N ratio shows that the surface quality of cryo treated AISI D2 tool steel can be improved by reducing the surface roughness using present statistical analysis. The experimental result shows that the model suggested by the Taguchi’s method is suitable for improving the surface quality by reducing the surface roughness [7]. The authors considered Wire-cut electric discharge machining of AISI D3 tool steel. Experimentation has been completed by using Taguchi’s L9 orthogonal array. The results obtained are analyzed for the selection of an optimal combination of WEDM parameters to achieve better surface finish. The recommended levels of WEDM parameters for surface roughness are pulse on time 3 μs, pulse off time 4 μs, peak current 2 A and wire speed is 5 m/min. Among the tested parameters, the Wire speed and pulse on time shows strongest correlation to surface roughness as compared to current and pulse on time [8]. Piyush Pant et al studied the effect and optimization of pulse-on time, gap voltage, wire feed rate on surface roughness for die steel D3 using L27 orthogonal array. It has been found that pulse on-time is the most significant factor affecting the surface roughness. The surface roughness increases with an increase in pulse time and gap voltage but with increase in wire feed rate. The ranks and the delta values show that pulse on time have the greatest effect on surface roughness and is followed by wire feed rate and spark gap set voltage [9]. Miss. Dipti experimentally investigated on AISI D7. It was found that the Material Removal Rate (MRR) is mainly affected by Pulse-off time (Toff) and Sensitivity (Sen). The effect of pulse on time (Ton) is less on MRR. Feed (f) has least effect on it. The Surface Roughness (Ra) is mainly affected by Sensitivity (Sen) and Pulse-off time (Toff).It is observed that Pulse-on time (Ton), Feed (f) has the least favorable effect on Surface Roughness (Ra). In Taguchi L9 orthogonal matrix experiment, no interactions between the input factors are considered [10]. The authors investigated titanium alloy Ti-6Al-4V using Taguchi approach L36 mixed orthogonal array (21×38) with brass wire and optimal setting of process parameters for material removal rate has been obtained. It was found that short pulse time play a most significant parameter for MRR. Increase in short pulse time and pulse width results higher MRR. Further with decrease in SCMRV, cutting velocity increases which results higher MRR whereas MRR decrease with increase in WFR and WMT. As TBP increases, MRR decreases. The process parameters DC, MFR and IP have no such significant effect on MRR [11]. Literature review reveals that most of the research work has been carried out for conventional materials only and very limited work was reported on the wire electrical discharge machining of titanium alloy Ti-3Al-2.5V.
EXPERIMENTAL SETUP
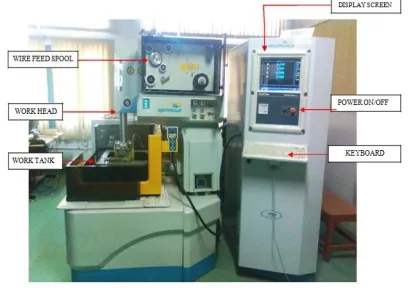
The experimental studies were performed on ELECTRONICA SPRINTCUT WEDM machine (Figure 2). In the present work titanium alloy (Ti-3Al-2.5V, composition: C = 0.029%, Fe = 0.129%, N = 0.003%, V = 2.44%, Al =
3.05%, Ti = Bal) with yield strength of 530MPa, a density of 4.48 g/cm3 and hardness of 300 HV has been used as workpiece material and brass wire of 0.25mm is used as a electrode material. Dimensions of work material used was 150mm x 150mm x 6mm. Cuts were made with circular cross section of 5mm.
Figure 2: Pictorial View of WEDM Machine Tool
Performance of WEDM is evaluated on the basis of Gap current (IG) and dimensional deviation (DD). The gap current is read on an ammeter, which is an integral part of machine, in amperes and is shown in Fig 2. For Dimensional deviation, the specimen cross-section is measured with the help of a digital vernier caliper and the deviation of the measured dimension is calculated in percentage using the following expression:
The set up for the measurement of dimensions is shown in Figure 3.
Figure 3: Set Up for Dimensional deviation Measurement
SELECTION OF PROCESS PARAMETERS
This paper makes use of Taguchi’s method for designing the experiments. L9 orthogonal array was
220
Table 1: Process Parameters and their Levels
RESULTS AND DISCUSSIONS
1.Selection of Optimal Parameters and levels
In this research work, the effects of each machining parameters on gap current and dimensional deviation during machining of Ti-3Al-2.5V are analyzed. Table 2 and Table 7 represent the experimental results and S/N ratio for IG and DD respectively. The response values from the experimental obtained mean data are used for analyzing the parametric effects on IG and DD. The peak value of S/N ratio helps to identify the significant parameters and analyze their effects on both the responses. Figure 4 and Figure 6 show the effect of given parameters on IG and DD respectively. MINITAB-15 software has been used to do the analysis of experiments so that the best optimal set of parameters can be obtained.
A. Gap Current
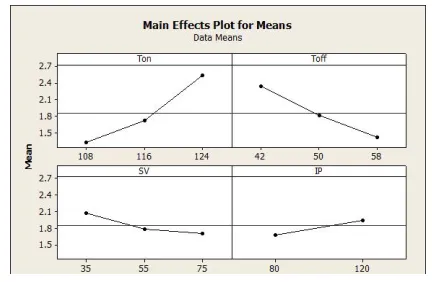
Figures 4 and 5 shows that gap current increases with increase in pulse on time and peak current, decreases with increase in pulse off time and spark gap set voltage.
Table 2: Experimental Results of Gap current
Figure 4: Effects of Process Parameters on Gap current (Raw Data)
Figure 5: Effects of Process Parameters on Gap current (S/N Data)
Table 3: Analysis of Variance for Gap current (S/N Data)
Source DF Seq SS Adj SS Adj MS F P
Ton 2 52.046 52.046 26.023 39.2 0.012 Toff 2 32.266 32.266 16.133 24.3 0.014 SV 2 8.242 8.242 4.121 6.21 0.023 IP 1 0.520 0.520 0.520 0.78 0.039 Error 1 0.664 0.664 0.664
Total 8 93.737
Table 4: Analysis of Variance for Gap current (Raw Data)
Source DF Seq SS Adj SS Adj MS F P
Ton 2 2.28469 2.2847 1.14235 15.42 0.017 Toff 2 1.29932 1.2993 0.64966 8.77 0.022 SV 2 0.22673 0.2267 0.11336 1.53 0.036 IP 1 0.13062 0.1306 0.13062 1.76 0.041 Error 1 0.07407 0.0741 0.07407
Total 8 4.01543 Factors Parameters Levels
L1 L2 L3
A Pulse on Time 108 116 124
B Pulse off Time 42 50 58
C Spark Gap Set Voltage
35 55 75
D Peak Current 80 120
Trial No.
Gap Current (Ampere)
Mean S/N Ratio
R1 R2 R3
1 1.8 1.9 1.85 1.85 5.33708
7 2 1.2 1.15 1.2 1.1833 1.4568 3 0.9 0.95 0.9 0.9166 -0.764
4 2.2 2.3 2.5 2.3333 7.3232
5 1.4 1.3 1.35 1.35 2.5947
6 1.5 1.4 1.5 1.4666 3.3127
7 2.9 2.9 2.7 2.8333 9.0311
8 2.8 2.9 3 2.9 9.2376
Table 5: Response Table for Gap current (S/N Data)
Level Ton Toff SV IP
1 1.973 10.116 8.978 6.2846 2 7.559 6.0752 6.999 6.4675
3 9.687 3.028 3.242
Delta 7.714 7.088 5.736 0.1829
Rank 1 2 3 4
Table 6: Response Table for Gap current (Raw Data)
Level Ton Toff SV IP
1 4.422974 7.230455 5.962486 4.422974 2 4.93289 4.429749 4.705726 4.93289 3 7.86859 2.62855 3.620542
Delta 3.445615 4.601904 2.341944 0.509915
Rank 1 2 3 4
In order to study the significance of the process variables towards cutting rate, analysis of variance (ANOVA) was performed. ANOVA of the S/N data and the raw data for gap current are given in Tables 3 and 4 respectively. From these tables, it is clear that pulse on time, pulse off time, spark gap set voltage and peak current significantly affect both the mean and the variation in the CR values. The response tables (Tables 5 and 6) show the average of each response characteristic (S/N data, means) for each level of each factor. The tables include ranks based on delta statistics, which compare the relative magnitude of effects. The ranks and the delta values for various parameters show that pulse on time has the greatest effect on gap current and is followed by pulse off time, spark gap set voltage and peak current in that order. As gap current is the ―larger the better‖ type quality characteristic, from Figure 4, it can be seen that the third level of pulse on time (A3), first level of pulse off time (B1), first level of spark gap set voltage (C1) and second level of peak current (D2) result in minimum value of surface roughness. The S/N ratio analysis (Figure 5) also suggests the same levels of the variables (A3, B1, C1& D2) as the best levels for minimum DD in WEDM process.
B. Dimensioanl deviation
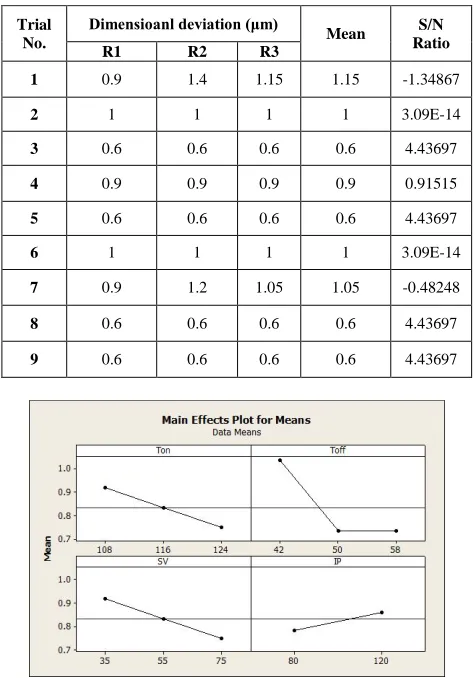
It is seen from the Figures 6 and 7 that dimensional deviation decreases with increase in pulse on time. With the increase in pulse off time dimensional deviation first decreases and then become constant. As spark gap set voltage increases, the dimensional deviation decrease and with the increase in peak current, increment in the value of dimensional deviation is observed.
Table 7: Experimental Results of Dimensioanl deviation
Figure 6: Effects of Process Parameters on Dimensioanl deviation (Raw Data)
Figure 7: Effects of Process Parameters on Dimensioanl deviation (S/N Data)
Table 8: Analysis of Variance for Dimensional deviation (S/N Data)
Source DF Seq SS Adj SS Adj MS F P Ton 2 4.72 4.72 2.36 0.13 0.018 Toff 2 21.30 21.30 10.65 0.61 0.022
SV 2 4.72 4.72 2.36 0.13 0.028
IP 1 1.83 1.83 1.83 0.10 0.061
Error 1 17.58 17.58 17.58 Total 8 50.16
Trial No.
Dimensioanl deviation (μm)
Mean S/N
Ratio
R1 R2 R3
1 0.9 1.4 1.15 1.15 -1.34867
2 1 1 1 1 3.09E-14
3 0.6 0.6 0.6 0.6 4.43697
4 0.9 0.9 0.9 0.9 0.91515
5 0.6 0.6 0.6 0.6 4.43697
6 1 1 1 1 3.09E-14
7 0.9 1.2 1.05 1.05 -0.48248
8 0.6 0.6 0.6 0.6 4.43697
222
Table 9: Analysis of Variance for Dimensional deviation (Raw Data)
Source DF Seq SS Adj SS Adj MS F P Ton 2 0.0417 0.0417 0.0208 0.14 0.023 Toff 2 0.1800 0.1800 0.0900 0.60 0.024 SV 2 0.0417 0.0417 0.0208 0.14 0.034 IP 1 0.0113 0.0113 0.0113 0.07 0.081 Error 1 0.1504 0.1504 0.1504
Total 8 0.4250
Table 10: Pooled Analysis of Variance for Dimensional deviation (S/N Data)
Source DF Seq SS Adj SS Adj MS F P Ton 2 4.721 4.721 2.360 0.24 0.008 Toff 2 21.298 21.298 10.649 1.10 0.012 SV 2 4.721 4.721 2.360 0.24 0.020 Error 2 19.417 19.417 9.709
Total 8 50.157
Table 11: Pooled Analysis of Variance for Dimensional deviation (Raw Data)
Source DF Seq SS Adj SS Adj MS F P Ton 2 0.04167 0.0416 0.0208 0.26 0.012 Toff 2 0.18000 0.1800 0.0900 1.11 0.020 SV 2 0.04167 0.0417 0.0208 0.26 0.026 Error 2 0.16167 0.1616 0.0808
Total 8 0.42500
Table 12: Response Table for Dimensional deviation (S/N Data)
Table 13: Response Table for Dimensional deviation (Raw Data)
In order to study the significance of the process variables towards dimensional deviation, analysis of variance (ANOVA) was performed. It was found that peak voltage is a non significant parameter for dimensional deviation. Non significant parameters were pooled and pooled versions of ANOVA of the S/N data and the raw data for dimensional deviation are given in Tables 10 and 11 respectively. From these tables, it is observed that pulse on time, pulse off time and spark gap set voltage significantly affect both the mean and the variation in the dimensional deviation values. The response tables (Tables 12 and 13) show the average of each response
characteristic (S/N data, raw data) for each level of each factor. The tables include ranks based on delta statistics, which compare the relative magnitude of effects. The ranks and the delta values for various parameters show that pulse off time has the greatest effect on dimensional deviation and is followed by pulse on time and spark gap set voltage. As dimensional deviation is the ―lower the better‖ type quality characteristic, from Figure 6, it can be seen that the third level of pulse on time (A3), third level of pulse off time (B3) and third level of spark gap set voltage (C3) provide minimum value of dimensional deviation. The S/N data analysis (Figure 7) also suggests the same levels of the variables (A3, B3 and C3) as the best levels for minimum dimensional deviation in WEDM process.
.
1. Estimation of Optimum Response Characteristics In this section, the optimal values of IG and DD with their respective confidence intervals have been predicted. Considering the influence of significant parameters, the optimal set of values of each response characteristic is predicted. The 95% confidence intervals of confirmation experiments (CICE) and population (CIPOP) are calculated by using the Equations as written below for ready reference:
Where, Fα (1, fe) = The F ratio at the confidence level of (1-α) against DOF 1 and error degree of freedom fe.
neff =
neff = 27/(1+7)
= 3.375 (For IG)
neff = 27 / (1+6)
= 3.857 (For DD)
N = Total number of results = 9 x 3 = 27
R = Sample size for confirmation experiments = 3 Ve = Error variance = 0.07407 (For IG)
Ve = Error variance = 0.0139 (For DD) (Table 4 and Table 11 resp.)
fe = error DOF = 1 (For IG) (Table 4) fe = error DOF = 2 (For DD) (Table 11) F0.05 (1, 1) = 161.4 (For IG)
F0.05 (1, 2) = 18.51 (For DD)
The optimum value of IG is predicted at the optimal levels of significant variables which have already been selected as pulse on time (A3), pulse off time(B1), spark gap set voltage (C1) and peak current(D2). The estimated mean of the response characteristic (IG) can be determined (Kumar,
Level Ton Toff SV
1 1.029434 -0.30533 1.029434 2 1.784042 2.957983 1.784042 3 2.797158 2.957983 2.797158 Delta 1.767725 3.263317 1.767725
Rank 2 1 2
Level Ton Toff SV
1 1.7023 1.993 2.05
2 1.926 1.965 1.938
3 2.215 1.887 1.856
Delta 0.513 0.106 0.194
1993 and Roy, 1990) as
Where,
T = overall mean of gap current = ( R1+ R2+ R3)/27 = 1.8537 ampere
Where, R1, R2, and R3 values are taken from the Table 2, and the values of A3, B1 , C1
D2 are taken from the Table 6.
So, μIG= 2.5278 + 2.3389 + 2.07222 + 1.93889 – 3 (1.8537) = 3.3167 ampere
Therefore:
CICE = ± 2.744 CIPOP = ± 1.8820
Therefore, the predicted confidence interval for confirmation experiments is:
Mean µIG - CICE < µIG < Mean µIG + CICE
0.57307 < µIG < 6.0627
The 95% confidence interval of the population is: Mean µIG – CIPOP < µIG < Mean µIG + CIPOP
1.43467 < µIG < 5.19867
The optimum value of DD is predicted at the optimal levels of significant variables which have already been selected as pulse on time (A3), pulse off time (B3) and spark gap set voltage (C3) and. The estimated mean of the response characteristic (DD) can be determined (Kumar, 1993 and Roy, 1990) as
(5.2)
Where, T = overall mean of dimensional deviation = (3)/27 = 0.83333 %
Where, R1, R2 and R3 values are taken from
The Table 7, and the values of A1, B3 and C3 are taken from the Table 13. Substituting the values of various terms in the above equation,
µDD = 0.75 + 0.73333 + 0.75 – 2 (0.8333) = 0.56667 %
So,
CICE = ± 0.9416 and CIPOP = ± 0.6228
Therefore, the predicted confidence interval for confirmation experiments is:
Mean µDD - CICE < µDD < Mean µDD + CICE -0.375 < µDD < 1.508
The 95% confidence interval of the population is: Mean µDD – CIPOP < µDD < Mean µDD + CIPOP - 0.056 < µDD < 1.189
3. Confirmation Experiment
In order to validate the results obtained, three confirmation experiments were conducted for each of the response characteristics (IG & DD) at optimal levels of the process variables. The average values of the characteristics were obtained and compared with the predicted values. The results are given in Table 14. The values of IG & DD obtained through confirmation experiments are within the 95% of CICE of respective response characteristic. It is to be pointed out that these optimal values are within the specified range of process variables. Any extrapolation should be confirmed through additional experiments.
CONCLUSION
1. The effects of the process parameters viz. pulse on time, pulse off time, spark gap set voltage and peak current, on response characteristics viz. gap current and dimensional deviation, were studied.
2. The optimal sets of process parameters were obtained for various performance measures using Taguchi’s design of experiment methodology. The summary of optimal results and results of predicted optimal values of the responses and their confidence intervals (both for confirmation experiment and population) are given in Table 14.
Table 14: Predicted Optimal Values, Confidence Intervals and Results of Confirmation Experiments
Performance Perform anceMea sures/ Respons es Optimal Set of Paramete rs Predict ed Optimal Value Predicted Confidence Intervals at 95% Confidence Level Actual Value (averag e of three confirm ation experi ments) Gap current
A3B1C1 D2
3.3167 Ampere
CIPOP : 0.5731 < µIG < 6.0627
CICE: 1.4347 < µIG < 5.1986
4.0 Ampere Dimensi onal Deviatio n
A3B3C3 0.56667 %
CIPOP : -0.056 < µDD < 1.189
CICE: -0.375 < µDD < 1.508
0.78
REFERENCES
[1] H. Singh & R. Garg. (2009), ―Effects of process parameters on material removal rate in WEDM‖, Journal of Achievements in Materials and Manufacturing Engineering, Volume 32, ISSUE 1, 70-74.
[2] Aniza Aliasa, Bulan Abdullaha and Norliana Mohd Abbas. (2012), ―Influence of machine feed rate in WEDM of Titanium Ti-6Al-4V with constant current (6A) using brass wire‖, Procedia Engineering 41 ( 2012 ) 1806 – 1811.
224 machining on inconel825‖, Elixir Mech. Engg. 43
(2012), 6669-6674.
[4] M M Dhobe1, I K Chopde and C L Gogte. (2013), ―Effect of heat treatment and process parameters on surface roughness in Wire Electro Discharge Machining‖ , Int. J. Mech. Eng. & Rob. Res. 2013 Vol. 2, No. 2, April 2013 pp. 275-281.
[5] G. Lakshmikanth, Nirmal Murali, G. Arunkumar and S. Santhanakrishnan. (2013), ―Investigation on Optimization of Machining Parameters in Wire EDM using Taguchi Technique‖, IJSRD - International Journal for Scientific Research & Development, Vol. 1, Issue 9, 2013 pp 1772-1774.
[6] BijoMathew, Benkim and J.Babu. (2014), ―Multiple Process Parameter Optimization of WEDM on AISI304 Using Taguchi Grey Relational Analysis‖, Procedia Materials Sciennces 5 (2014) 1613-1622
[7] K. Chopde, Chandrashekhar Gogte and DhobeMilind. (2014), ―Modeling and Optimization of WEDM Parameters for Surface Finish Using Design of Experiments‖, Proceedings of the 2014 International Conference on Industrial Engineering and Operations Management Bali, Indonesia, January 7 – 9, 2014 pp 1830-1839
[8] V. D. Shinde and Anand S. Shivade. (2014), ―Parametric Optimization of Surface Roughness in Wire Electric Discharge Machining (WEDM) using Taguchi Method‖, International Journal of Recent Technology and Engineering (IJRTE), Volume-3, Issue-2, May 2014 pp 10-15.
[9] Piyush Pant, Navneet K Pandey, S. Rajesha and Gaurav Jain. (2014), ―Experimental Study of Surface Roughness in Wedm Process and Ann Modelling‖, International Journal of Engineering and Advanced Technology (IJEAT), Volume-3, Issue-5, June 2014 pp 57-61.
[10]Miss. Dipti Ghanashyam Gonjari. (2014), ―Investigation of effect of WEDM process parameters on performance characteristics of tool steel grade AISI D7‖, IRACST – Engineering Science and Technology: An International Journal (ESTIJ), Vol.4, No.5, October 2014 pp 129-134.
[11]Parveen Kr. Saini and Mukesh Verma. (2014), ―Experimental Investigation of Wire-EDM Process Parameters on MRR of Ti-6al-4v Alloy‖, International Journal of Innovative Technology and Exploring Engineering (IJITEE), Volume-4, Issue-5, October 2014 pp 16-20.
[12]Roy, R.K. (1990), ―A primer on Taguchi method‖, Van Nostrand Reinhold, New York.